Swing Highs/Lows und Kerzenmuster
Schriftsteller:ChaoZhang, Datum: 2022-05-07 21:12:40Tags:aufwärtsAbwärts
Dieses Skript kennzeichnet Swing-Hochs und Swing-Tiefs sowie das Kerzenmuster, das an diesem Punkt aufgetreten ist. Das Skript kann folgende 6 Kerzenmuster erkennen: Hammer, inverse Hammer, bullish engulfing, hanging man, shooting star und bearish engulfing.
Die Bezeichnungen HH, HL, LH und LL, die Sie auf den Etiketten sehen können, sind wie folgt definiert:
HH: Höher hoch HL: Höher niedriger LH: Niedriger hoher LL: Niedriger Niedriger
Einstellung
Längen: Empfindlichkeit der Swing-Hoch-/Niedrigdetektion, wobei niedrigere Werte das Maximum/Minimum der kurzfristigen Kursschwankungen zurückgeben.
Verwendung und Details
Es kann interessant sein, zu sehen, ob ein Ober- oder ein Unterteil mit einem bestimmten Kerzenmuster assoziiert ist, was uns erlaubt, das Potenzial eines solchen Musters zu untersuchen, um eine Umkehrung anzuzeigen.
Beachten Sie, dass die Etiketten verschoben sind und später in Echtzeit angezeigt werden, da dieser Indikator nicht dazu bestimmt ist, Höhen/Böden in Echtzeit zu erkennen.
Höhere Werte der Länge können Fehler zurückgeben.
Zurückprüfung
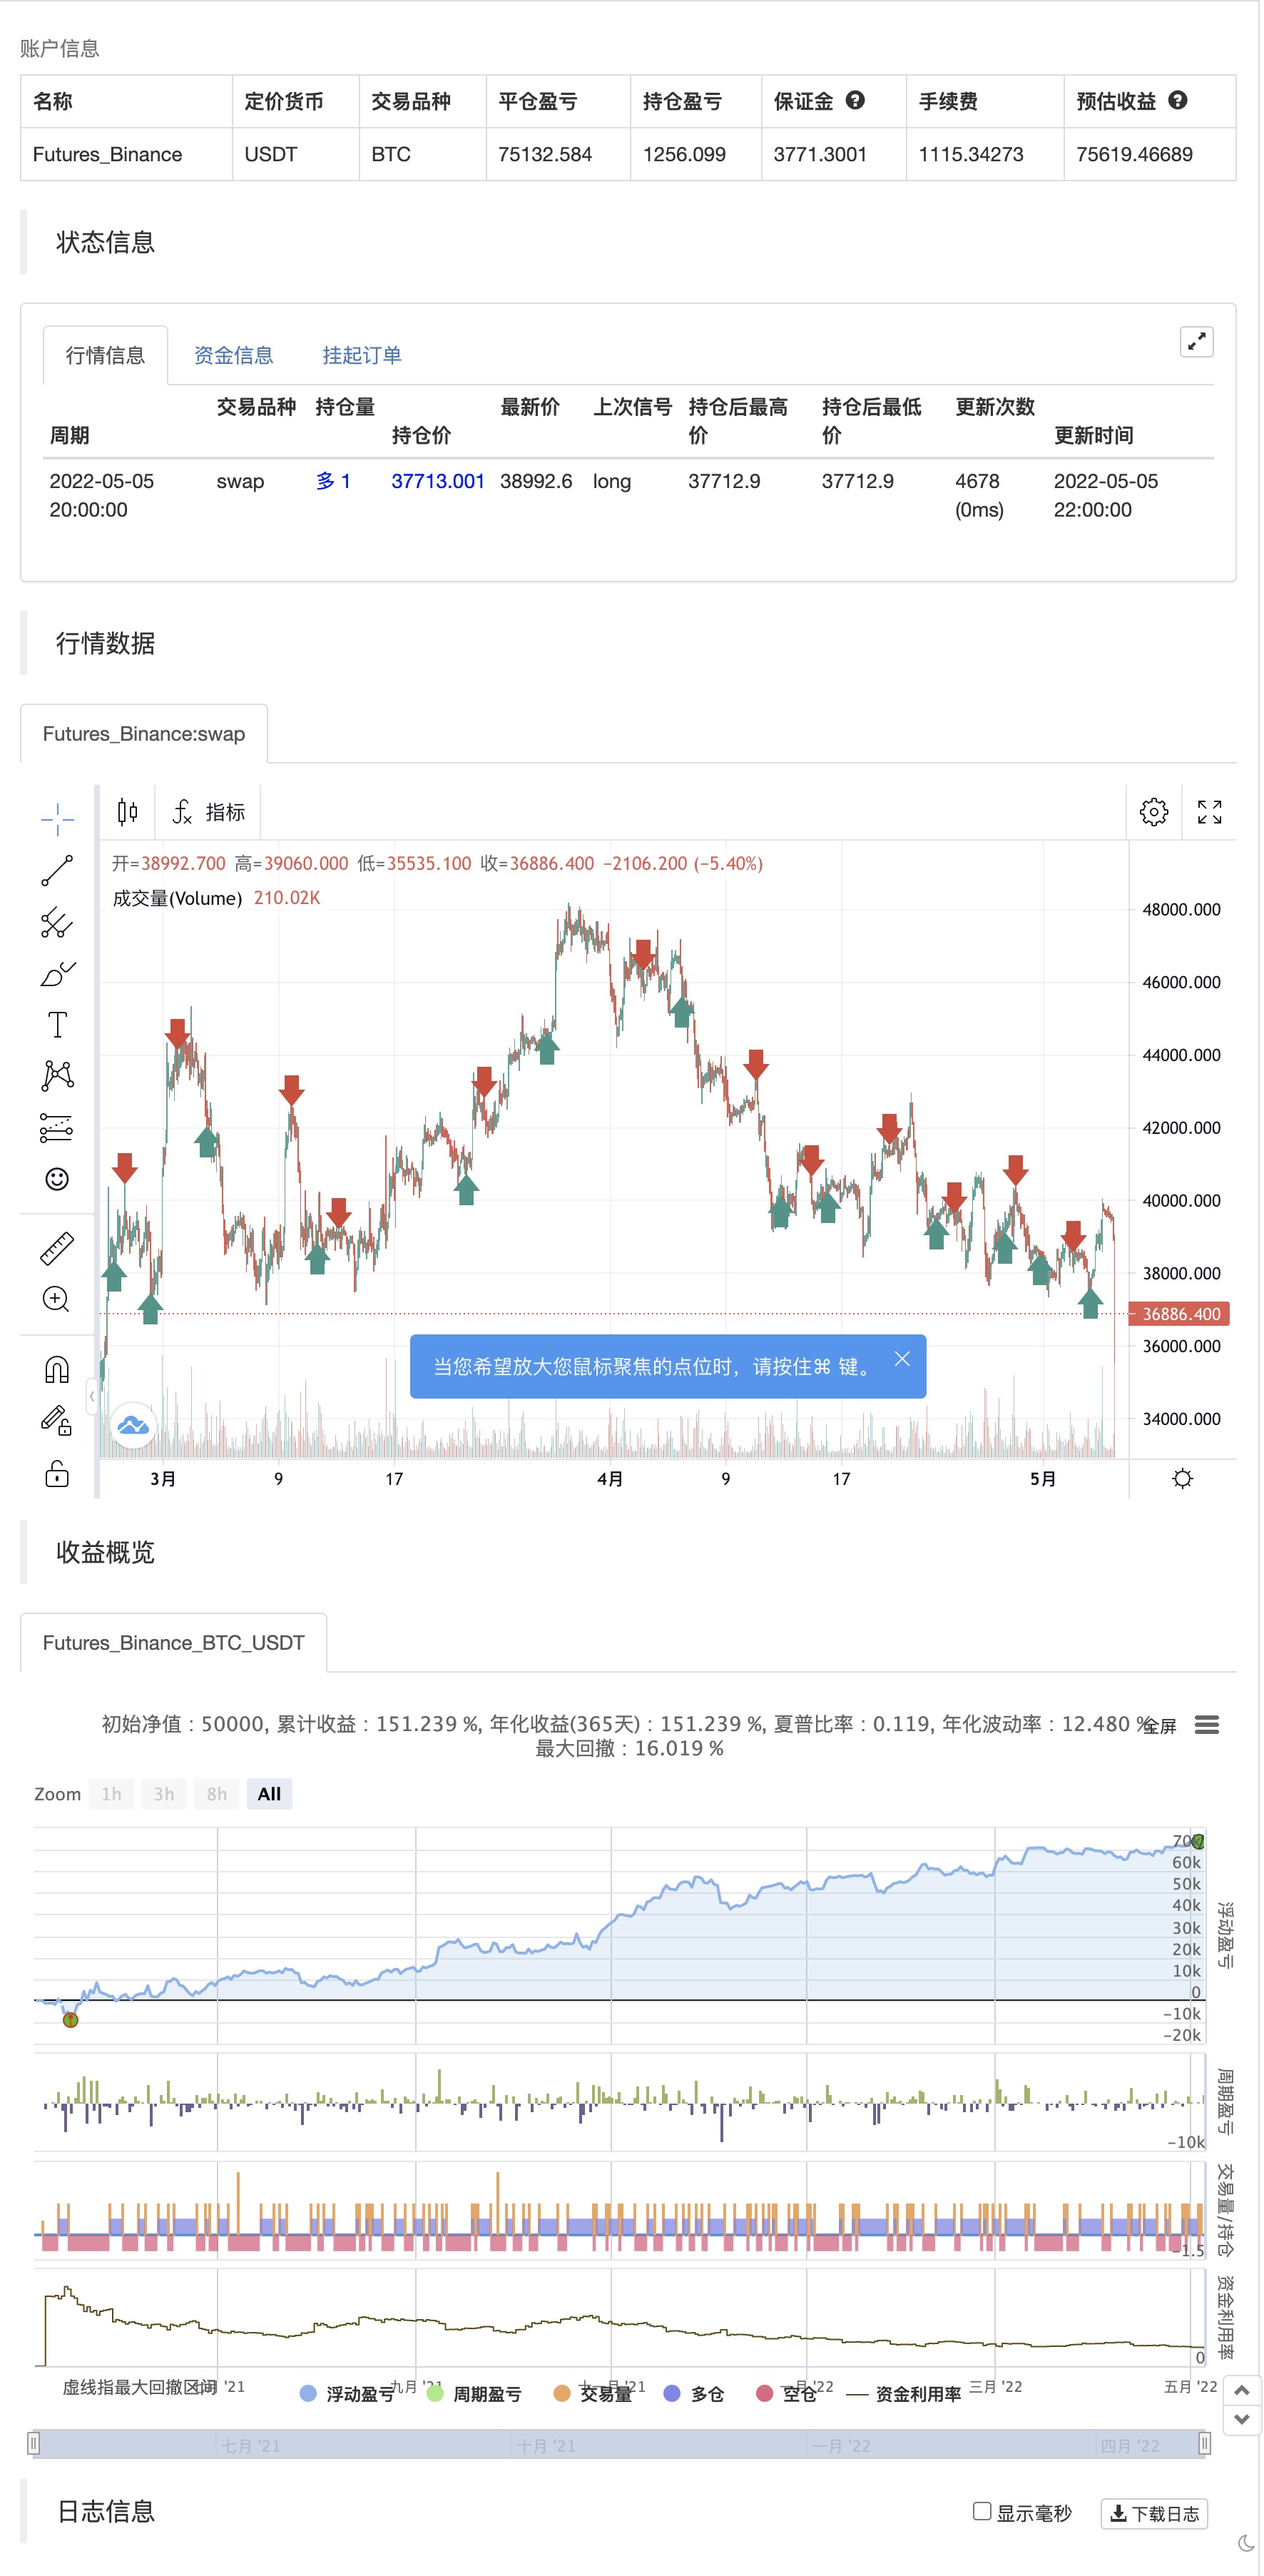
/*backtest
start: 2021-05-06 00:00:00
end: 2022-05-05 23:59:00
period: 2h
basePeriod: 15m
exchanges: [{"eid":"Futures_Binance","currency":"BTC_USDT"}]
*/

// This work is licensed under a Attribution-NonCommercial-ShareAlike 4.0 International (CC BY-NC-SA 4.0) https://creativecommons.org/licenses/by-nc-sa/4.0/
// © LuxAlgo

//@version=4
study("Swing Highs/Lows & Candle Patterns",overlay=true)
length = input(21)
//------------------------------------------------------------------------------
o = open[length],h = high[length]
l = low[length],c = close[length]
//------------------------------------------------------------------------------
ph = pivothigh(close,length,length)
pl = pivotlow(open,length,length)
valH = valuewhen(ph,c,0)
valL = valuewhen(pl,c,0)
valpH = valuewhen(ph,c,1)
valpL = valuewhen(pl,c,1)
//------------------------------------------------------------------------------
d = abs(c - o)
hammer = pl and min(o,c) - l > d and h - max(c,o) < d
ihammer = pl and h - max(c,o) > d and min(c,o) - l < d
bulleng = c > o and c[1] < o[1] and c > o[1] and o < c[1]
hanging = ph and min(c,o) - l > d and h - max(o,c) < d
shooting = ph and h - max(o,c) > d and min(c,o) - l < d
beareng = c > o and c[1] < o[1] and c > o[1] and o < c[1]
//------------------------------------------------------------------------------
//Descriptions
//------------------------------------------------------------------------------
hammer_ = "The hammer candlestick pattern is formed of a short body with a long lower wick, and is found at the bottom of a downward trend."
  + "\n" + "\n A hammer shows that although there were selling pressures during the day, ultimately a strong buying pressure drove the price back up."
ihammer_ = "The inverted hammer is a similar pattern than the hammer pattern. The only difference being that the upper wick is long, while the lower wick is short."
  + "\n" + "\n It indicates a buying pressure, followed by a selling pressure that was not strong enough to drive the market price down. The inverse hammer suggests that buyers will soon have control of the market."
bulleng_ = "The bullish engulfing pattern is formed of two candlesticks. The first candle is a short red body that is completely engulfed by a larger green candle"
  + "\n" + "\n Though the second day opens lower than the first, the bullish market pushes the price up, culminating in an obvious win for buyers"
hanging_ = "The hanging man is the bearish equivalent of a hammer; it has the same shape but forms at the end of an uptrend."
  + "\n" + "It indicates that there was a significant sell-off during the day, but that buyers were able to push the price up again. The large sell-off is often seen as an indication that the bulls are losing control of the market."
shotting_ = "The shooting star is the same shape as the inverted hammer, but is formed in an uptrend: it has a small lower body, and a long upper wick."
  + "\n" + "Usually, the market will gap slightly higher on opening and rally to an intra-day high before closing at a price just above the open – like a star falling to the ground."
beareng_ = "A bearish engulfing pattern occurs at the end of an uptrend. The first candle has a small green body that is engulfed by a subsequent long red candle."
  + "\n" + "It signifies a peak or slowdown of price movement, and is a sign of an impending market downturn. The lower the second candle goes, the more significant the trend is likely to be."
//------------------------------------------------------------------------------
n = bar_index
label lbl = na
H = valH > valpH ? "HH" : valH < valpH ? "LH" : na
L = valL < valpL ? "LL" : valL > valpL ? "HL" : na
txt = hammer ? "Hammer" : ihammer ? "Inverse Hammer" :
  bulleng ? "Bullish Engulfing" : hanging ? "Hanging Man" :
  shooting ? "Shooting Star" : beareng ? "Bearish Engulfing" : "None"
des = hammer ? hammer_ : ihammer ? ihammer_ :
  bulleng ? bulleng_ : hanging ? hanging_ :
  shooting ? shotting_ : beareng ? beareng_ : ""

//------------------------------------------------------------------------------
if ph
    strategy.entry("Enter Long", strategy.long)
else if pl
    strategy.entry("Enter Short", strategy.short)
- Broken Fractal: Jemandes zerbrochener Traum ist dein Gewinn!
- ZigZag PA-Strategie V4.1
- Demark-Einstellungsindikator
- Schwelende Kerzen
- Unterstützungs-Widerstands-Ausbruch
- MTF-RSI und STOCH-Strategie
- jma + dwma für Mehrkornprodukte
- Bewegliche durchschnittliche farbige EMA/SMA
- Handel mit mehreren Zeitrahmen
- RSI von zdmre
- MACD-Wert
- Z-Score mit Signalen
- Das ist eine sehr einfache Strategie für die Schwankungsrate.
- 3EMA + Boullinger + PIVOT
- Baguette nach Mehrkorn
- - Die Maschine.
- K-Umkehrindikator I
- Schwelende Kerzen
- MA Kaiser insilliconot
- Demark-Umkehrpunkte
- TMA-Überlagerung
- MACD + SMA 200-Strategie
- CM-Schleudersystem
- Bollinger + RSI, Doppelstrategie v1.1
- Bollinger-Band-Strategie
- Optimierter Trend-Tracker
- Monatliche Renditen in PineScript-Strategien
- ADX und DI für v4
- MacD-Anpassungsindicator - mehrfacher Zeitrahmen + alle verfügbaren Optionen!
- Indikator: WaveTrend-Oszillator