BRAHMASTRA
Schriftsteller:ChaoZhang, Datum: 2022-05-13 14:39:00 UhrTags:WMA
Zu jedem Zeitpunkt sehen Sie bis zu 4 Trendlinien in diesem Skript.
▶ Die Trendlinie verbindet sich mit den Pivot-Höhen im Aufwärtstrend ▶ Die Trendlinie schließt sich den Pivot-Tiefpunkten an, wenn der Trend aufwärts steigt ▶ Trendlinie, die sich in Abwärtstrend-Zustand mit Pivot-Hochs verbindet ▶ Trendlinie, die sich bei Abwärtstrendbedingungen an die Pivot-Tiefpunkte anschließt
Die ältere Linie bleibt bestehen, bis die neue Linie des gleichen Typs erscheint. Daher können Sie für Abwärtstrend-Instrumente, die lange zurück entstanden sind, immer noch Aufwärtstrend-Hoch- und Tieftrend-Linien sehen!! Außerdem ersetzen neue Trendlinien die alten nur, wenn sie stärker sind (Verbindung zu mehr Pivots mit weniger Überlauf)
Zurückprüfung
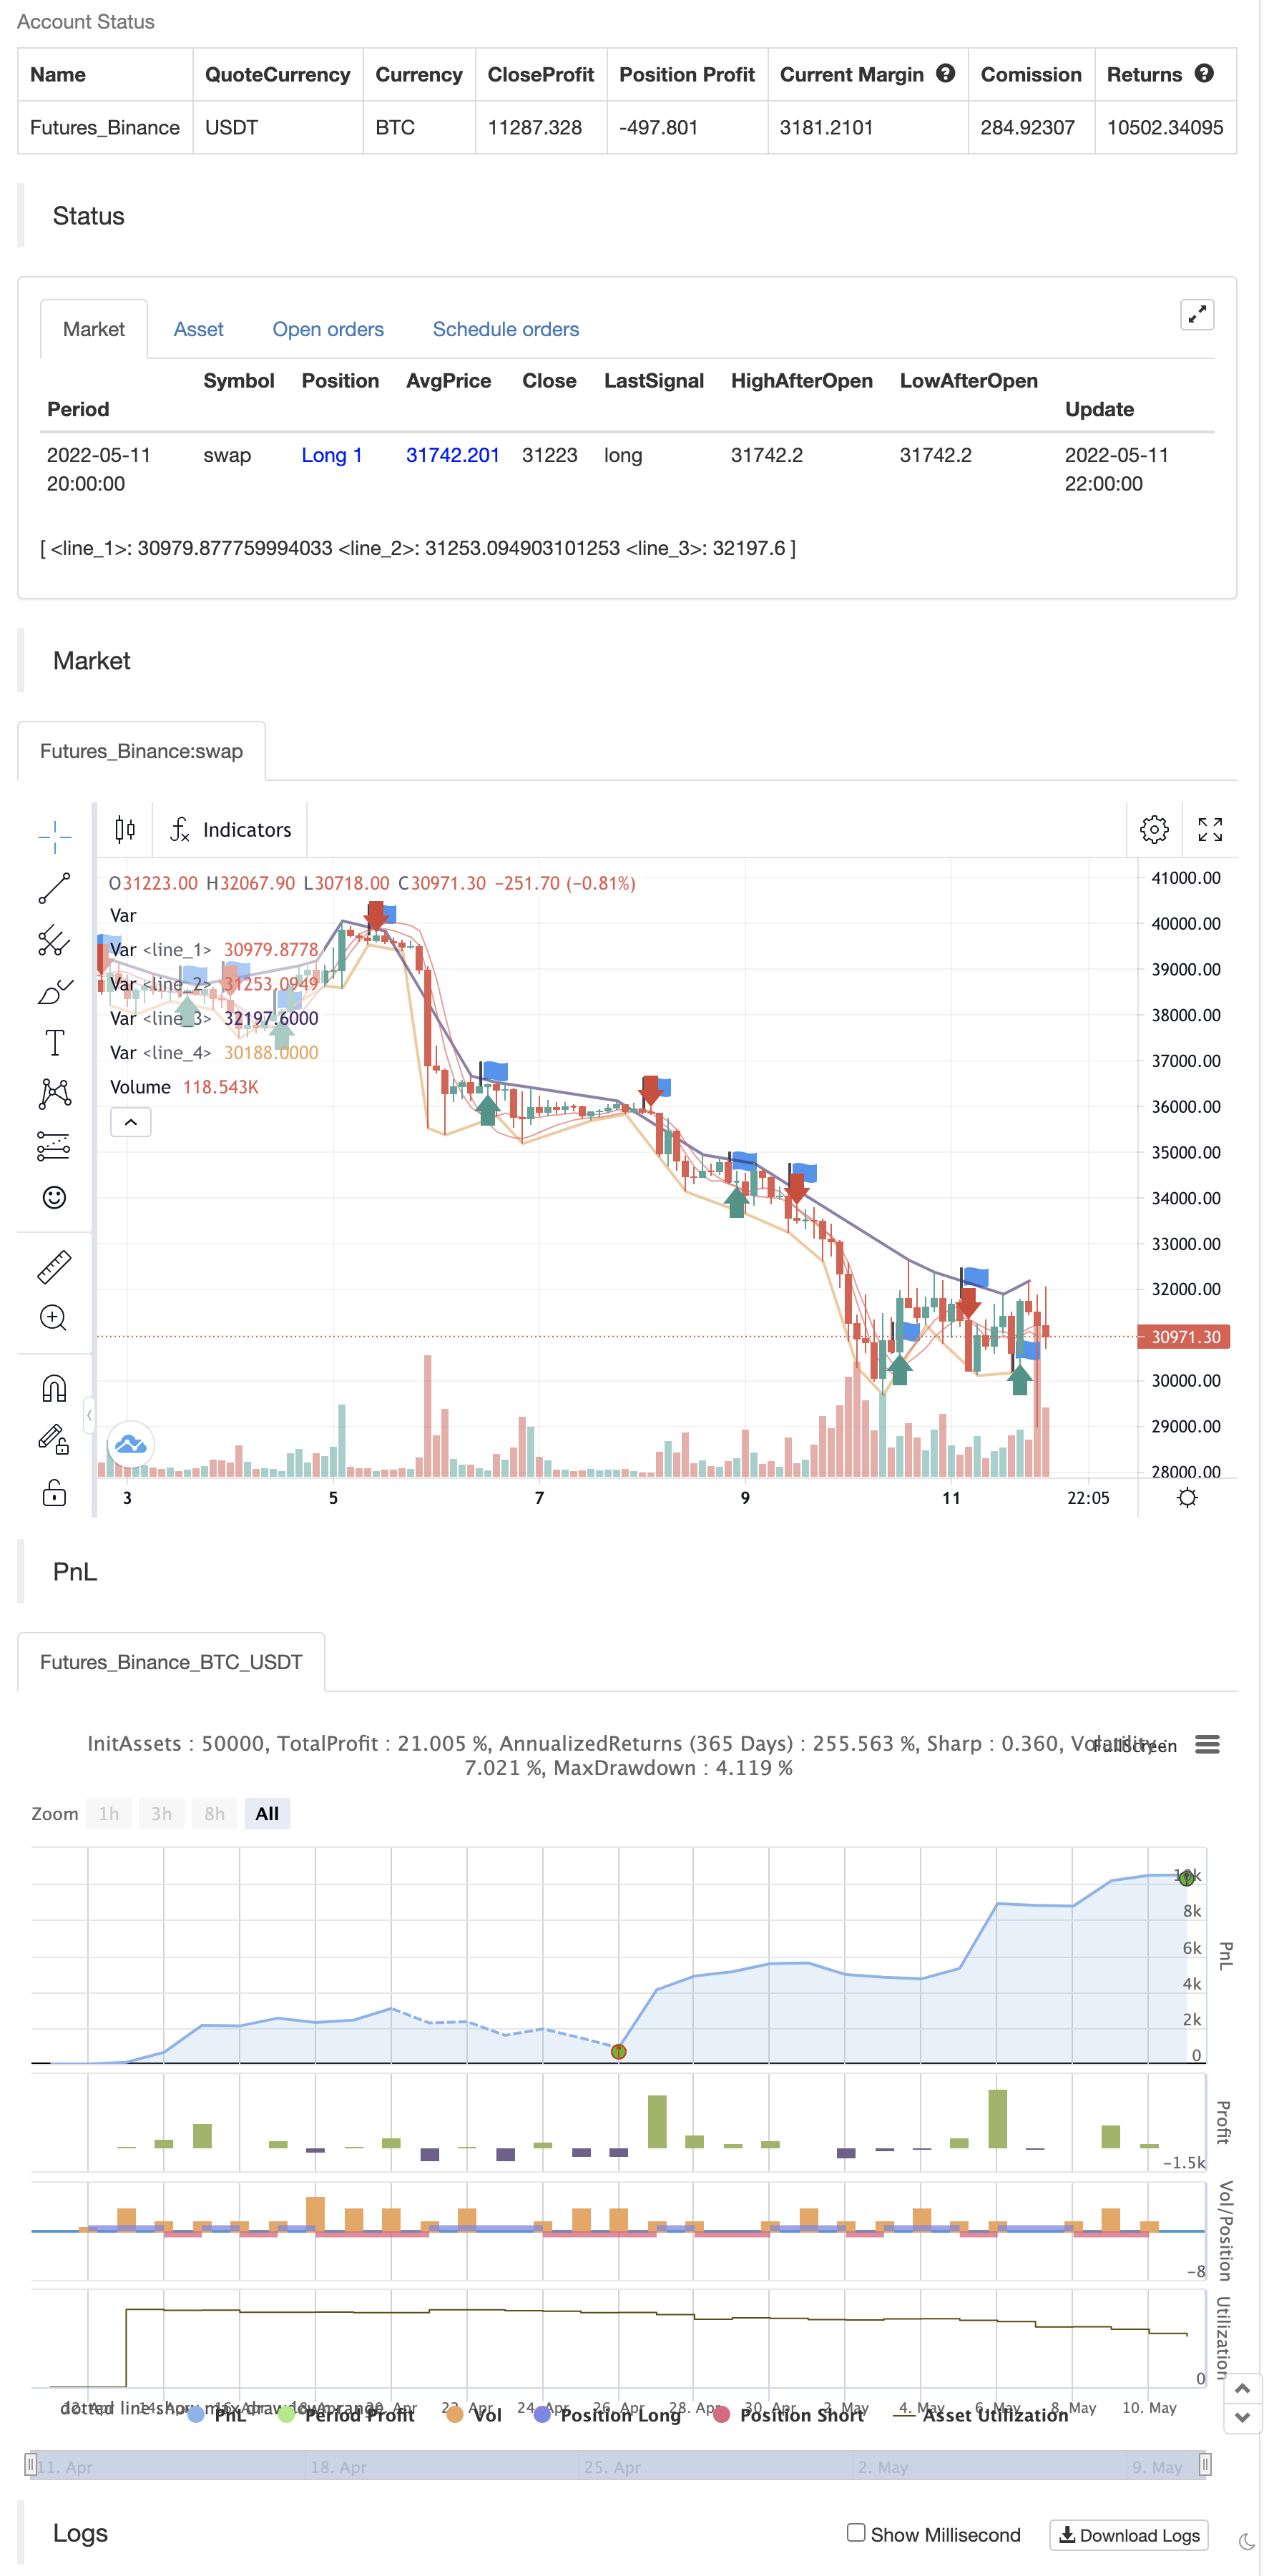
/*backtest
start: 2022-04-12 00:00:00
end: 2022-05-11 23:59:00
period: 2h
basePeriod: 15m
exchanges: [{"eid":"Futures_Binance","currency":"BTC_USDT"}]
*/

//@version=4
study("BRAHMASTRA", precision=2, overlay=true)
// compilation: capissimo

// This script utilizes two modules, Trendlines Module (by Joris Duyck) and HMA-Kahlman Trend Module.
// Trendlines module produces crossovers predictive of the next local trend.

//*** HMA-Kahlman Trend Module
price  = input(hl2,  "Price Data (hl2)")
hkmod  = input(true, "===HMA-Kahlman Trend Module===")
length = input(22,   "Lookback Window", minval=2)
k      = input(true, "Use Kahlman")
gain   = input(.7,   "Gain", minval=.0001, step=.01)
labels = input(true, "Show Labels?")
o      = input(true, "Use Offset")

hma(x, p) => wma((2 * wma(x, p / 2)) - wma(x, p), round(sqrt(p)))

hma3() => p = length/2, wma(wma(close, p/3)*3 - wma(close, p/2) - wma(close, p), p)

kahlman(x, g) =>
    kf = 0.0
    dk = x - nz(kf[1], x)
    smooth = nz(kf[1],x)+dk*sqrt(g*2)
    velo = 0.0
    velo := nz(velo[1],0) + (g*dk)
    kf := smooth+velo

a = k ? kahlman(hma(price, length), gain) : hma(price, length)
b = k ? kahlman(hma3(), gain) : hma3()
c = b > a ? color.lime : color.red
crossdn = a > b and a[1] < b[1]
crossup = b > a and b[1] < a[1]
ofs = o ? -1 : 0

fill(plot(a,color=c,linewidth=1,transp=75), plot(b,color=c,linewidth=1,transp=75), color=c, transp=55)
plotshape(labels and crossdn ? a : na, location=location.abovebar, style=shape.labeldown, color=color.red, size=size.tiny, text="S", textcolor=color.white, transp=0, offset=ofs)
plotshape(labels and crossup ? a : na, location=location.belowbar, style=shape.labelup, color=color.green, size=size.tiny, text="B", textcolor=color.white, transp=0, offset=ofs)

//*** Trendlines Module, see https://www.tradingview.com/script/mpeEgn5J-Trendlines-JD/
tlmod = input(true, "===Trendlines Module===")
l1    = input(2,    "Pivots Lookback Window", minval=1)

trendline(input_function, delay, only_up) => // Calculate line coordinates (Ax,Ay) - (Bx,By)
    var int Ax = 0, var int Bx = 0, var float By = 0.0, var float slope = 0.0
    Ay = fixnan(input_function)
    if change(Ay)!=0
        Ax := time[delay], By:= Ay[1], Bx := Ax[1]
        slope := ((Ay-By)/(Ax-Bx))
    else
        Ax := Ax[1], Bx := Bx[1], By := By[1]

    var line trendline=na, var int Axbis=0, var float Aybis=0.0, var bool xtend=true
    extension_time = 0
    Axbis := Ax + extension_time
    Aybis := (Ay + extension_time*slope)
    if tlmod and change(Ay)!=0
        line_color = slope*time<0?(only_up?na:color.red):(only_up?color.lime:na)
        if not na(line_color)
            trendline = line.new(Bx,By,Axbis, Aybis, xloc.bar_time, extend=xtend?extend.right:extend.none, color=line_color, style=line.style_dotted, width=1)
            line.delete(trendline[1])
    slope

pivot(len) =>
    high_point = pivothigh(high, len,len/2)
    low_point  = pivotlow(low, len,len/2)
    slope_high = trendline(high_point, len/2,false)
    slope_low  = trendline(low_point, len/2,true)
    [high_point, low_point, slope_high, slope_low]

[high_point1, low_point1, slope_high1, slope_low1] = pivot(l1)

color_high1 = slope_high1 * time<0 ? color.red : na
color_low1  = slope_low1  * time>0 ? color.lime : na
plot(tlmod ? high_point1 : na, color=color_high1, offset=-l1/2, linewidth=2)
plot(tlmod ? low_point1  : na, color=color_low1, offset=-l1/2, linewidth=2)


if crossup
    strategy.entry("Enter Long", strategy.long)
else if crossdn
    strategy.entry("Enter Short", strategy.short)
- Quantitative Handelsstrategie auf Basis des modifizierten Hull Moving Average und Ichimoku Kinko Hyo
- Quantitative Handelsstrategie auf der Grundlage gleitender Durchschnitte und Bollinger-Bänder
- VWMA-ADX Momentum und trendbasierte Bitcoin Long Strategie
- Leichtes Lager
- Low Scanner Strategie Krypto
- Scalping EMA ADX RSI mit Kauf/Verkauf
- Volumendivergenz
- Hull Moving Average Swing Trader
- Strategie der Hull Suite
- Gewinnmaximierer PMax
- Swing Hull/rsi/EMA-Strategie
- Geistertrends verfolgen Strategiedatenbanken
- Geistertrends verfolgen Strategien für die Geschäftsbank
- Geistertrend-Verfolgungsstrategien
- Regenbogen-Oszillator
- Beispiel für die Größe der Aktienkurvenposition
- KLineChart-Demo
- Villa Dynamic Pivot Supertrend-Strategie
- Crodls Supertrend
- RSI von zdmre
- FTL - Bereichsfilter X2 + EMA + UO
- Mobo-Bänder
- SAR + 3SMMA mit SL & TP
- SSS
- Vorlage für Warnmeldungen für den Mondstart [Indikator]
- HALFTREND + HEMA + SMA (Falschsignal-Strategie)
- RSI Divergenz mit Pivot, BB, SMA, EMA, SMMA, WMA, VWMA
- RSI und BB und gleichzeitig Überverkauft
- Rollende Heikin Ashi Kerzen
- Kombination 2/20 EMA und Bandpassfilter
- ESSMA