
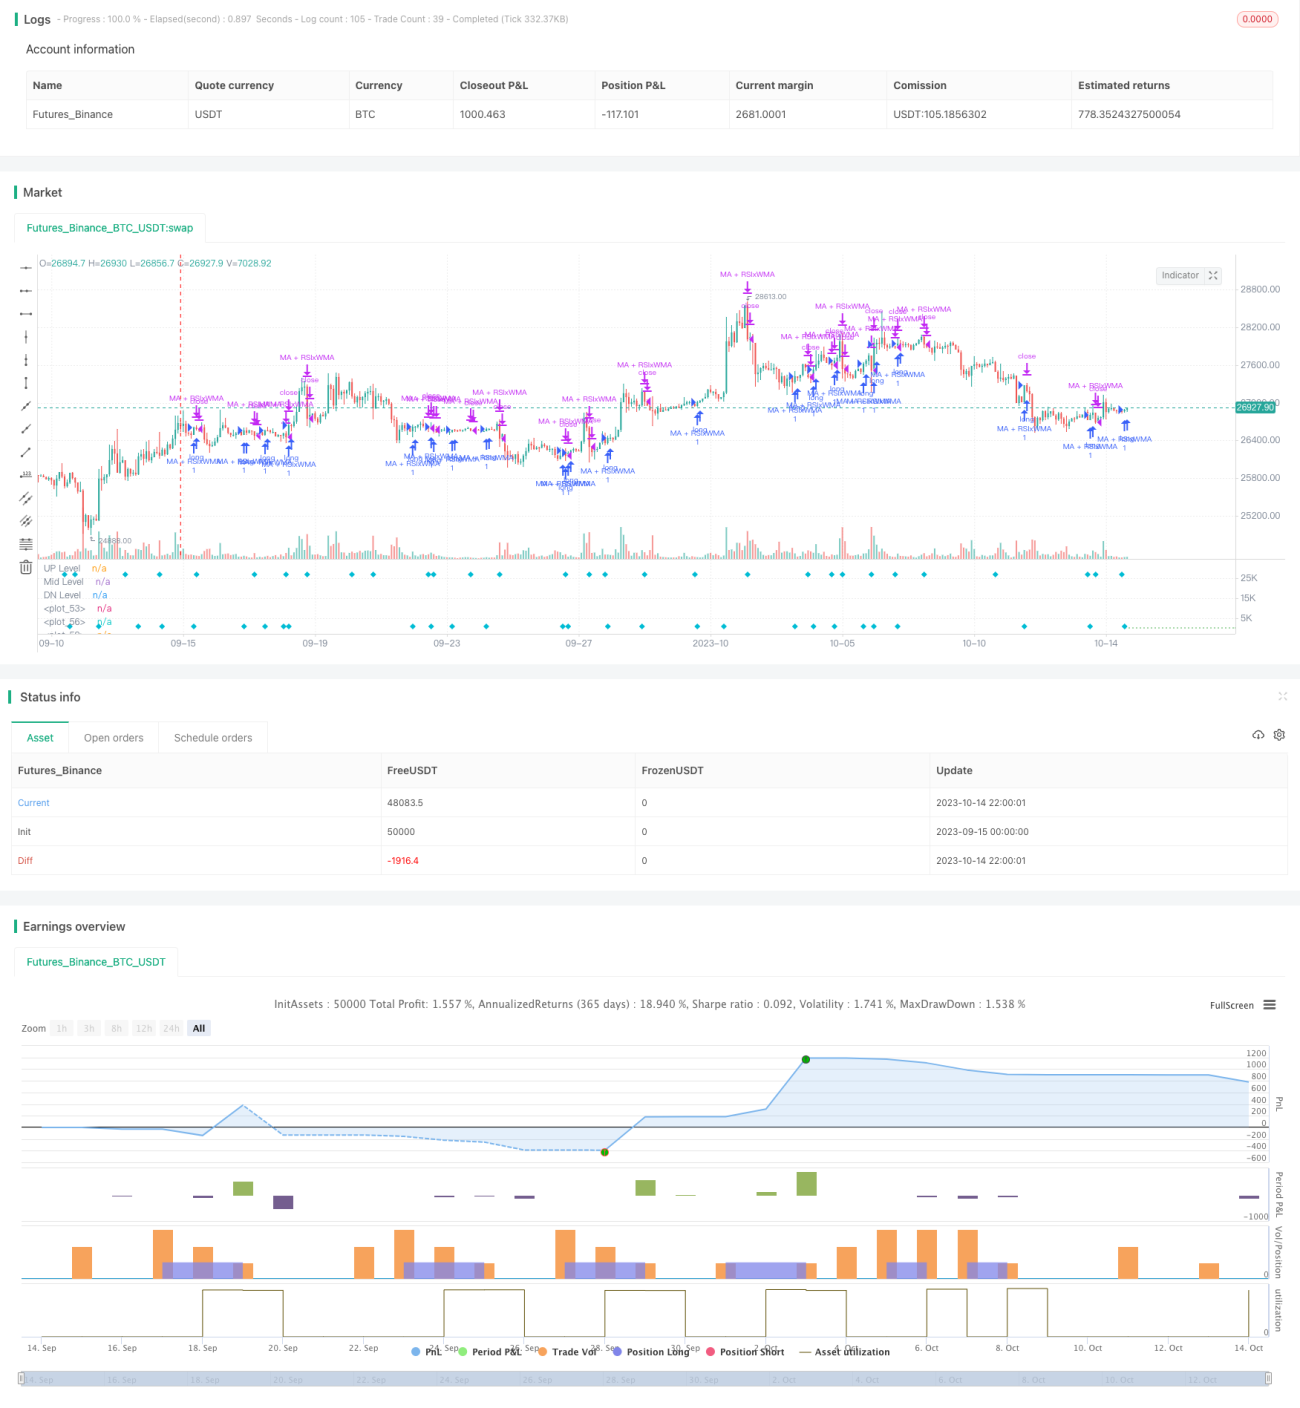
Die Kernidee dieser Strategie ist es, einen Trendwendepunkt zu identifizieren, der gleichzeitig einen relativ starken Index (RSI) und einen beweglichen Durchschnitt für verschiedene Zeiträume verwendet, um einen mittleren und langen Trend zu erfassen und gleichzeitig einen kurzen Trend zu erzielen. Die Strategie kombiniert mehrere Handelssignale und zielt darauf ab, die Erfolgsrate des Handels zu erhöhen.
Die Strategie kombiniert die Durchbruchsignale verschiedener Technikindikatoren mit den beweglichen Durchschnitten, die mit verschiedenen Parametern eingestellt sind, um Trends in verschiedenen Zeitabschnitten zu erkennen, wodurch die Zuverlässigkeit der Strategie verbessert wird. Der RSI-Indikator beurteilt den Überkauf, die EMA-Schnelllinie beurteilt den kurzfristigen Trend, die WMA-Langlinie beurteilt den mittleren Trend, die Preise und die Durchbruchbestätigung der Hilfsmittel. Die Kombination verschiedener Signale verbessert die Strategie.
Risiken können durch Parameteroptimierung, strenge Stop-Loss-Strategie und Berücksichtigung von Big Cycle Trends verringert werden.
Die Strategie integriert Trend-Tracking und Polar-Reversal-Trading-Konzepte, kombiniert mit mehreren Zeitfenstern und einer Vielzahl von Indikatoren, um die Erfolgsrate zu erhöhen. Der Schlüssel ist, das Risiko zu kontrollieren, die Parameter-Einstellungen zu optimieren und die Auswirkungen von Big Cycle-Trends auf den Handel zu berücksichtigen.
/*backtest
start: 2023-09-15 00:00:00
end: 2023-10-15 00:00:00
period: 2h
basePeriod: 15m
exchanges: [{"eid":"Futures_Binance","currency":"BTC_USDT"}]
*/
// This source code is subject to the terms of the Mozilla Public License 2.0 at https://mozilla.org/MPL/2.0/
// © HamidBox
//@version=4
// strategy("H-M By HamidBox-YT", default_qty_type=strategy.cash, default_qty_value= 100, initial_capital=100, currency='USD', commission_type=strategy.commission.percent, commission_value=0.1)
ma(source, length, type) =>
type == "SMA" ? sma(source , length) :
type == "EMA" ? ema(source , length) :
type == "WMA" ? wma(source , length) :
type == "VWMA" ? vwma(source , length) :
na
WMA(source, length, type) =>
type == "SMA" ? sma(source , length) :
type == "EMA" ? ema(source , length) :
type == "WMA" ? wma(source , length) :
type == "VWMA" ? vwma(source , length) :
na
WithMA(source, length, type) =>
type == "SMA" ? sma(source , length) :
type == "EMA" ? ema(source , length) :
type == "WMA" ? wma(source , length) :
type == "VWMA" ? vwma(source , length) :
na
rsi_inline = input(true , title="RSI Value)", inline="rsi")
rsiLength = input(title="Length:", type=input.integer, defval=9, minval=1, inline="rsi")
rsiLineM = input(title="Level:", type=input.integer, defval=50, minval=1, inline="rsi")
rsi_OSOBinline = input(true , title="RSI)", inline="rsiosob")
rsiLineU = input(title="O-BOUGHT", type=input.integer, defval=70, minval=1, inline="rsiosob")
rsiLineD = input(title="O-SOLD", type=input.integer, defval=30, minval=1, inline="rsiosob")
ma_inline = input(true , title="Price-MA)", inline="ma")
ma_type = input(title="Type", defval="EMA", options=["EMA","SMA","WMA","VWMA"], inline="ma")
emaLength = input(title="Length", type=input.integer, defval=3, inline="ma")
wma_inline = input(true , title="Trending-MA)", inline="wma")
ma_type2 = input(title="", defval="WMA", options=["EMA","SMA","WMA","VWMA"], inline="wma")
wmaLength = input(title="Length", type=input.integer, defval=21, inline="wma")
////////////////////////////////////////////////////////////////////////////////
startTime = input(title="Start Time", type = input.time, defval = timestamp("01 Jan 2021 00:00 +0000"), group="Backtest Time Period")
endTime = input(title="End Time", type = input.time, defval = timestamp("01 Jan 2200 00:00 +0000"), group="Backtest Time Period")
inDateRange = true
////////////////////////////////////////////////////////////////////////////////
rsi = rsi(close , rsiLength)
r = plot(rsi_inline ? rsi : na, color=color.yellow, linewidth=2)
EMA = ma(rsi, emaLength, ma_type)
e = plot(ma_inline ? EMA : na, color=color.lime)
myWMA = ma(rsi, wmaLength, ma_type2)
w = plot(wma_inline ? myWMA : na, color=color.white, linewidth=2)
up = hline(rsiLineU, title='UP Level', linewidth=1, color=color.red, linestyle=hline.style_dotted)
mid = hline(rsiLineM, title='Mid Level', linewidth=2, color=color.white, linestyle=hline.style_dotted)
dn = hline(rsiLineD, title='DN Level', linewidth=1, color=color.green, linestyle=hline.style_dotted)
col_e_w = EMA > myWMA ? color.new(color.green , 85) : color.new(color.red , 85)
col_r_w = rsi > myWMA ? color.new(color.green , 85) : color.new(color.red , 85)
fill(e , w, color=col_e_w)
fill(r , w, color=col_r_w)
////////////////////////////////////////////////////////////////////////////////
//Signals = input(true,group="👇 🚦 --- Backtesting Signals Type --- 🚦 ")
///////////////////////////////////////////////////////////////////////////////
RSI_Cross = input(false, "RSI x Trending-MA", inline="wma_cross",group="👇 🚦 --- Backtesting Signals Type --- 🚦 ") // INPUT
rsiBuySignal = crossover(rsi , myWMA)
plotshape(RSI_Cross ? rsiBuySignal : na, title="RSI Crossover", style=shape.labelup, location=location.bottom, color=color.green)
rsiSellSignal = crossunder(rsi , myWMA)
plotshape(RSI_Cross ? rsiSellSignal : na, title="RSI Crossunder", style=shape.labeldown, location=location.top, color=color.red)
if rsiBuySignal and RSI_Cross and inDateRange
strategy.entry("RSIxWMA", strategy.long)
if rsiSellSignal and RSI_Cross and inDateRange
strategy.close("RSIxWMA", comment="x")
if (not inDateRange)
strategy.close_all()
////////////////////////////////////////////////////////////////////////////////
MA_Cross = input(false, "MA x Trendin-MA",group="👇 🚦 --- Backtesting Signals Type --- 🚦 ") // INPUT
maBuySignal = crossover(EMA, myWMA)
plotshape(MA_Cross ? maBuySignal : na, title="MA Cross", style=shape.circle, location=location.bottom, color=color.lime)
maSellSignal = crossunder(EMA , myWMA)
plotshape(MA_Cross ? maSellSignal : na, title="RSI Crossunder", style=shape.circle, location=location.top, color=color.maroon)
if maBuySignal and MA_Cross and inDateRange
strategy.entry("MAxWMA", strategy.long)
if maSellSignal and MA_Cross and inDateRange
strategy.close("MAxWMA", comment="x")
if (not inDateRange)
strategy.close_all()
////////////////////////////////////////////////////////////////////////////////
Mix = input(false, "RSI + EMA x Trending-MA",group="👇 🚦 --- Backtesting Signals Type --- 🚦 ") // INPUT
rsi_ma_buy = crossover(rsi , myWMA) and crossover(EMA, myWMA)
rsi_ma_sell = crossunder(rsi , myWMA) and crossunder(EMA, myWMA)
plotshape(Mix ? rsi_ma_buy : na, title="RSI Crossunder", style=shape.circle, location=location.bottom, color=color.lime, size=size.tiny)
plotshape(Mix ? rsi_ma_sell : na, title="RSI Crossunder", style=shape.circle, location=location.top, color=color.yellow, size=size.tiny)
if rsi_ma_buy and Mix and inDateRange
strategy.entry("RSI+EMA x WMA", strategy.long)
if rsi_ma_sell and Mix and inDateRange
strategy.close("RSI+EMA x WMA", comment="x")
if (not inDateRange)
strategy.close_all()
////////////////////////////////////////////////////////////////////////////////
wma_cross = input(false, "Trending-MA x 50",group="👇 🚦 --- Backtesting Signals Type --- 🚦 ") // INPUT
wma_buy = crossover(myWMA , rsiLineM)
plotshape(wma_cross ? wma_buy : na, title="WMA Cross", style=shape.diamond, location=location.bottom, color=color.aqua)
wma_sell = crossunder(myWMA , rsiLineM)
plotshape(wma_cross ? wma_sell : na, title="WMA Cross", style=shape.diamond, location=location.top, color=color.aqua)
if wma_buy and wma_cross and inDateRange
strategy.entry("WMA x 50", strategy.long)
if wma_sell and wma_cross and inDateRange
strategy.close("WMA x 50", comment="x")
if (not inDateRange)
strategy.close_all()
////////////////////////////////////////////////////////////////////////////////
rsi_50 = input(false, "RSI x 50",group="👇 🚦 --- Backtesting Signals Type --- 🚦 ") // INPUT
rsi_50_buy = crossover(rsi , rsiLineM)
plotshape(rsi_50 ? rsi_50_buy : na, title="WMA Cross", style=shape.cross, location=location.bottom, color=color.purple)
rsi_50_sell = crossunder(rsi , rsiLineM)
plotshape(rsi_50 ? rsi_50_sell : na, title="WMA Cross", style=shape.cross, location=location.top, color=color.purple)
if rsi_50_buy and rsi_50 and inDateRange
strategy.entry("RSI Cross 50", strategy.long)
if rsi_50_sell and rsi_50 and inDateRange
strategy.close("RSI Cross 50", comment="x")
if (not inDateRange)
strategy.close_all()
////////////////////////////////////////////////////////////////////////////////
RSI_OS_OB = input(false, "RSI OS/OB x Trending-MA",group="👇 🚦 --- Backtesting Signals Type --- 🚦 ") // INPUT
rsi_OB_buy = (rsi < rsiLineD or rsi[1] < rsiLineD[1] or rsi[2] < rsiLineD[2] or rsi[3] < rsiLineD[3] or rsi[4] < rsiLineD[4] or rsi[5] < rsiLineD[5]) and rsiBuySignal
plotshape(RSI_OS_OB ? rsi_OB_buy : na, title="RSI OB + Cross", style=shape.circle, location=location.bottom, color=color.lime, size=size.tiny)
rsi_OS_sell = (rsi > rsiLineU or rsi[1] > rsiLineU[1] or rsi[2] > rsiLineU[2] or rsi[3] > rsiLineU[3] or rsi[4] > rsiLineU[4] or rsi[5] > rsiLineU[5]) and maSellSignal
plotshape(RSI_OS_OB ? rsi_OS_sell : na, title="RSI OS + Cross", style=shape.circle, location=location.top, color=color.red, size=size.tiny)
if rsi_OB_buy and RSI_OS_OB and inDateRange
strategy.entry("RSI-OBOS x WMA", strategy.long)
if rsi_OS_sell and RSI_OS_OB and inDateRange
strategy.close("RSI-OBOS x WMA", comment="x")
if (not inDateRange)
strategy.close_all()
////////////////////////////////////////////////////////////////////////////////
rsi_OB_OS = input(false, "RSI Over Sold/Bought",group="👇 🚦 --- Backtesting Signals Type --- 🚦 ") // INPUT
rsiBuy = crossover(rsi , rsiLineD)
rsiSell = crossunder(rsi, rsiLineU)
rsiExit = crossunder(rsi, rsiLineD)
plotshape(rsi_OB_OS ? rsiBuy : na, title="RSI OB", style=shape.cross, location=location.bottom, color=color.purple)
plotshape(rsi_OB_OS ? crossunder(rsi, rsiLineU) : na, title="RSI OS", style=shape.cross, location=location.top, color=color.purple)
plotshape(rsi_OB_OS ? rsiExit : na, title="RSI OS", style=shape.cross, location=location.bottom, color=color.red)
if rsiBuy and rsi_OB_OS and inDateRange
strategy.entry("RSI OB", strategy.long)
if (rsiSell or rsiExit) and rsi_OB_OS and inDateRange
strategy.close("RSI OB", comment="x")
if (not inDateRange)
strategy.close_all()
////////////////////////////////////////////////////////////////////////////////
////////////////////////////////////////////////////////////////////////////////
With_MA_Vis = input(true , title="With MA Signal)", inline="WITH MA", group="With MA")
withMA_type = input(title="", defval="SMA", options=["EMA","SMA","WMA","VWMA"], inline="WITH MA", group="With MA")
with_MALen = input(title="", defval=9, type=input.integer, inline="WITH MA", group="With MA")
// TAKE-PROFIT / STOP-LOSS
Stop_Take_Vis = input(true, "TP-SL")
LongSLValue = input(title="SL %", type=input.float, defval=3, minval=0.5) * 0.01
LongTPValue = input(title="TP %", type=input.float, defval=15, minval=0.5) * 0.01
LongSLDetermine = strategy.position_avg_price * (1 - LongSLValue)
LongTPDetermine = strategy.position_avg_price * (1 + LongTPValue)
//////////////////////////
with_ma = WithMA(close, with_MALen, withMA_type)
Close_buy_MA = crossover(close , with_ma)
Close_sell_MA = crossunder(close , with_ma)
// PLOT OPTION
WithMaSignal = input(true, "MA + RSI x Trending-MA",group="With MA") // INPUT
// CONDITION IN VARIABLE
withMA_RSI_BUY = (Close_buy_MA and rsiBuySignal) and WithMaSignal and inDateRange
withMA_RSI_SELL = (Close_sell_MA and rsiSellSignal) and WithMaSignal and inDateRange
// PLOT ING
plotshape(WithMaSignal ? withMA_RSI_BUY : na, title="With MA", style=shape.diamond, location=location.bottom, color=color.aqua)
plotshape(WithMaSignal ? withMA_RSI_SELL : na, title="With MA", style=shape.diamond, location=location.top, color=color.aqua)
if withMA_RSI_BUY
strategy.entry("MA + RSIxWMA", strategy.long)
if withMA_RSI_SELL
strategy.close("MA + RSIxWMA", comment="x")
if (not inDateRange)
strategy.close_all()
// FOR SL - TP
if (strategy.position_size > 0) and Stop_Take_Vis
strategy.exit("BUY", stop=LongSLDetermine, limit=LongTPDetermine)