Bipolare Strategie mit monatlicher Rendite

1
Follow
1778
Followers
Übersicht
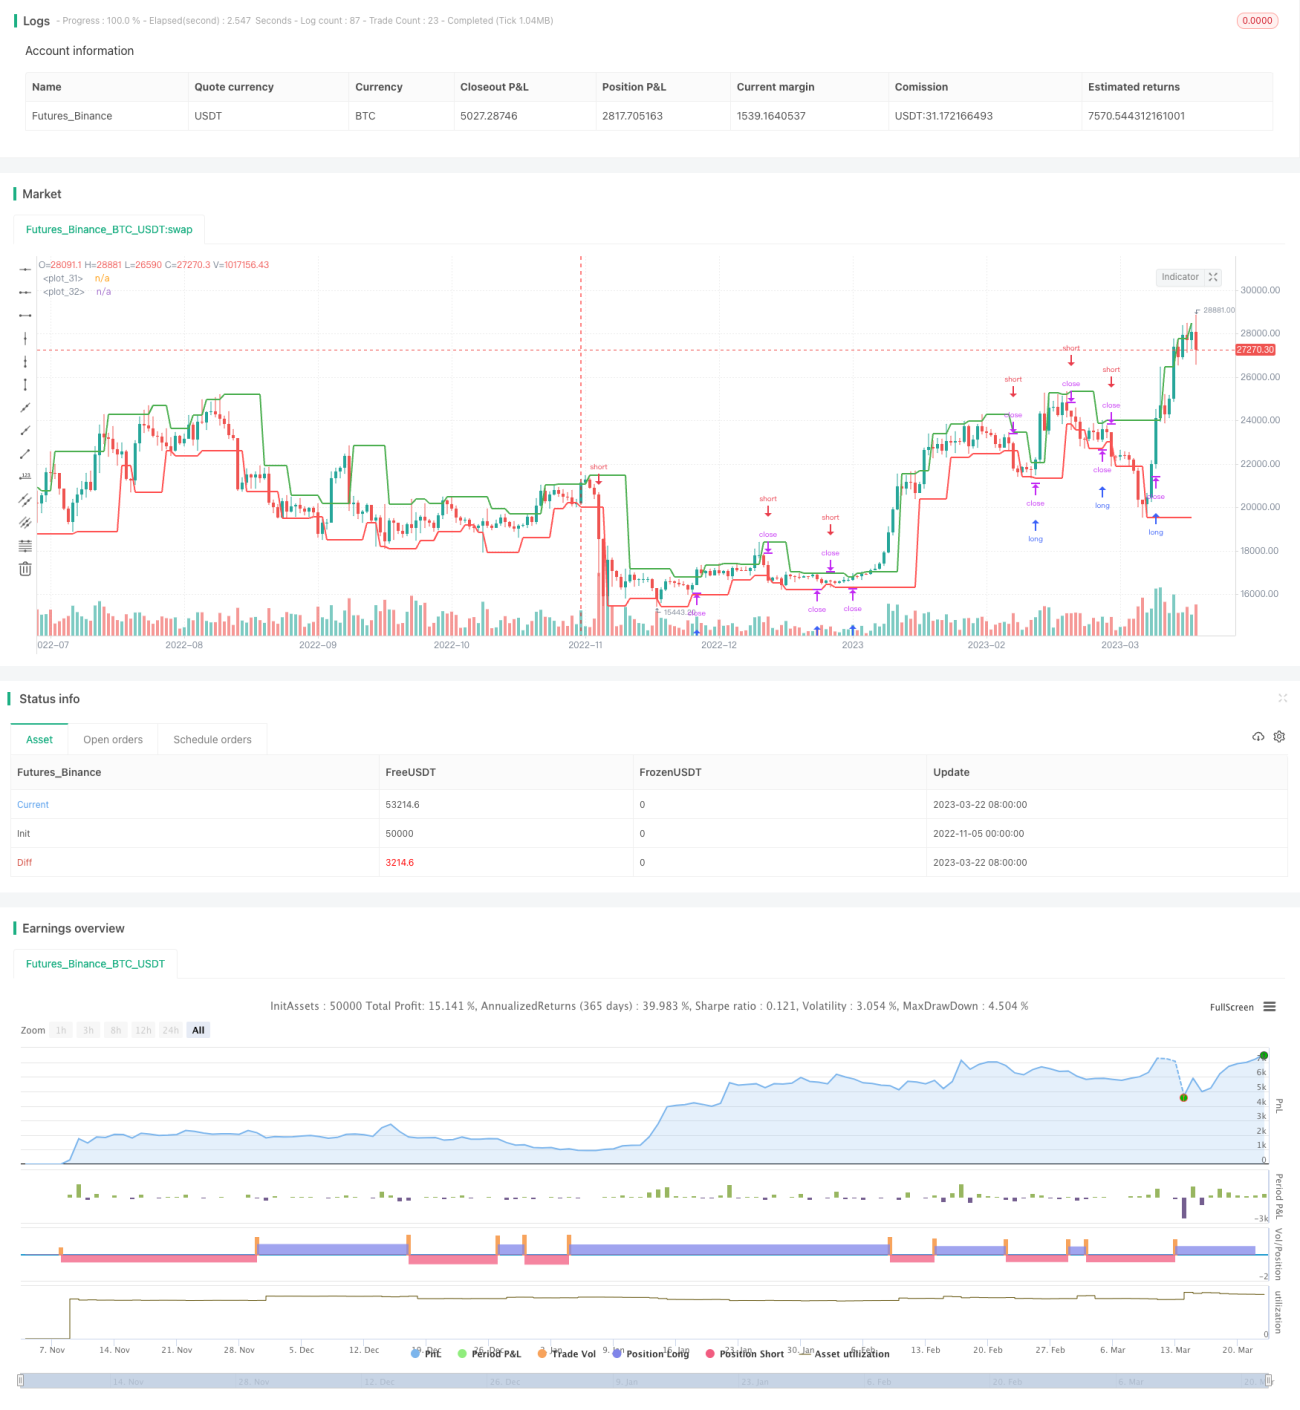
Die Strategie nutzt die K-Linie, um eine Trendwende zu ermitteln, und signalisiert damit einen Mehrfachhandel. Wenn die Strategie profitabel ist, wird sie die Gewinne des Monats sperren, um zu verhindern, dass die Rücknahme eine größere Verlust verursacht.
Grundlagen der Strategie
- Nutzung
pivothigh()Undpivotlow()Die Funktion berechnet die Achsenpunkte der K-Linie. An den Achsenpunkten kann man eine Trendwende erkennen. - Wenn der Preis über den oberen Pfeilpunkt fällt, wird eine Mehrkopfposition eingelegt. Wenn der Preis unter den unteren Pfeilpunkt fällt, wird eine Kurzkopfposition eingelegt.
- Zu Beginn des Monats berechnet man die Rendite des Vormonats und speichert sie in einem Array.
- Zu Beginn jedes Jahres berechnet man die Rendite des Vorjahres und speichert sie in Arrays.
- Eine Tabelle der Ertragsraten, die die Ertragslage für jeden Monat und jedes Jahr visualisiert.
Analyse der Stärken
- Mit Hilfe von Hubs kann eine Trendwende ermittelt werden, wodurch ein Teil des Noise-Trading-Signals herausgefiltert werden kann.
- Ein monatliches Locken der Gewinne verringert den Einfluss von verlustreichen Monaten und polarisiert die Gewinne.
- Die Gewinntabelle zeigt die Monatsgewinnung auf, so dass man die guten und schlechten Zeiten der Strategie sehen kann.
Risikoanalyse
- Bei Veränderungen der Pivot-Punkte kann es zu falschen Umkehrungspositionen kommen. Die Parameter können entsprechend optimiert oder die Filterbedingungen erhöht werden.
- Wenn Sie Ihre Position zu Beginn des Monats zwangsweise platzieren, verpassen Sie die Gewinnchancen für den Rest des Monats. Sie können in Betracht ziehen, nur einen Teil Ihrer Position zu sperren.
- Die Tabelle kann keine Risikoindikatoren wie maximale Rücknahme anzeigen. Es kann in Betracht gezogen werden, andere Indikatoren hinzuzufügen, die das Risiko der Strategie messen.
Optimierungsrichtung
- Filterbedingungen können in der Nähe von Hubpunkten hinzugefügt werden, um häufige ungültige Umkehrgeschäfte zu vermeiden.
- Es ist möglich, nur einen Teil der Positionen zu sperren und nicht die gesamte Position zu platzieren, um die Möglichkeit von Verlusten zu verringern.
- Die Darstellung von quantifizierten Risikoindikatoren wie Maximal-Rücknahme und Sharpe-Ratio in der Tabelle kann erhöht werden.
Zusammenfassung
Die Strategie nutzt die Eckpunkte, um die Trendwende zu ermitteln und die Gewinne am Ende der Woche zu sperren, um das Rücktrittsrisiko effektiv zu kontrollieren. Einige Parameter und die Strategielogik können jedoch weiter optimiert werden, um die Handelssignale genauer und die Risikokontrolle stabiler zu machen. Die intuitive Darstellung der monatlichen Erträge in Form von Tabellen ist auch für die Strategieanalyse von Nutzen.
Source
Pine
/*backtest
start: 2022-11-05 00:00:00
end: 2023-03-23 05:20:00
period: 1d
basePeriod: 1h
exchanges: [{"eid":"Futures_Binance","currency":"BTC_USDT"}]
*/

//@version=4
strategy("Monthly Returns in PineScript Strategies", overlay = true, default_qty_type = strategy.percent_of_equity, default_qty_value = 25, calc_on_every_tick = true, commission_type = strategy.commission.percent, commission_value = 0.1)

// Inputs Strategy parameters
Related strategies
Comment
All comments (0)
No data
- 1