Nutzung der Dual Moving Average Crossover-Strategie
Überblick
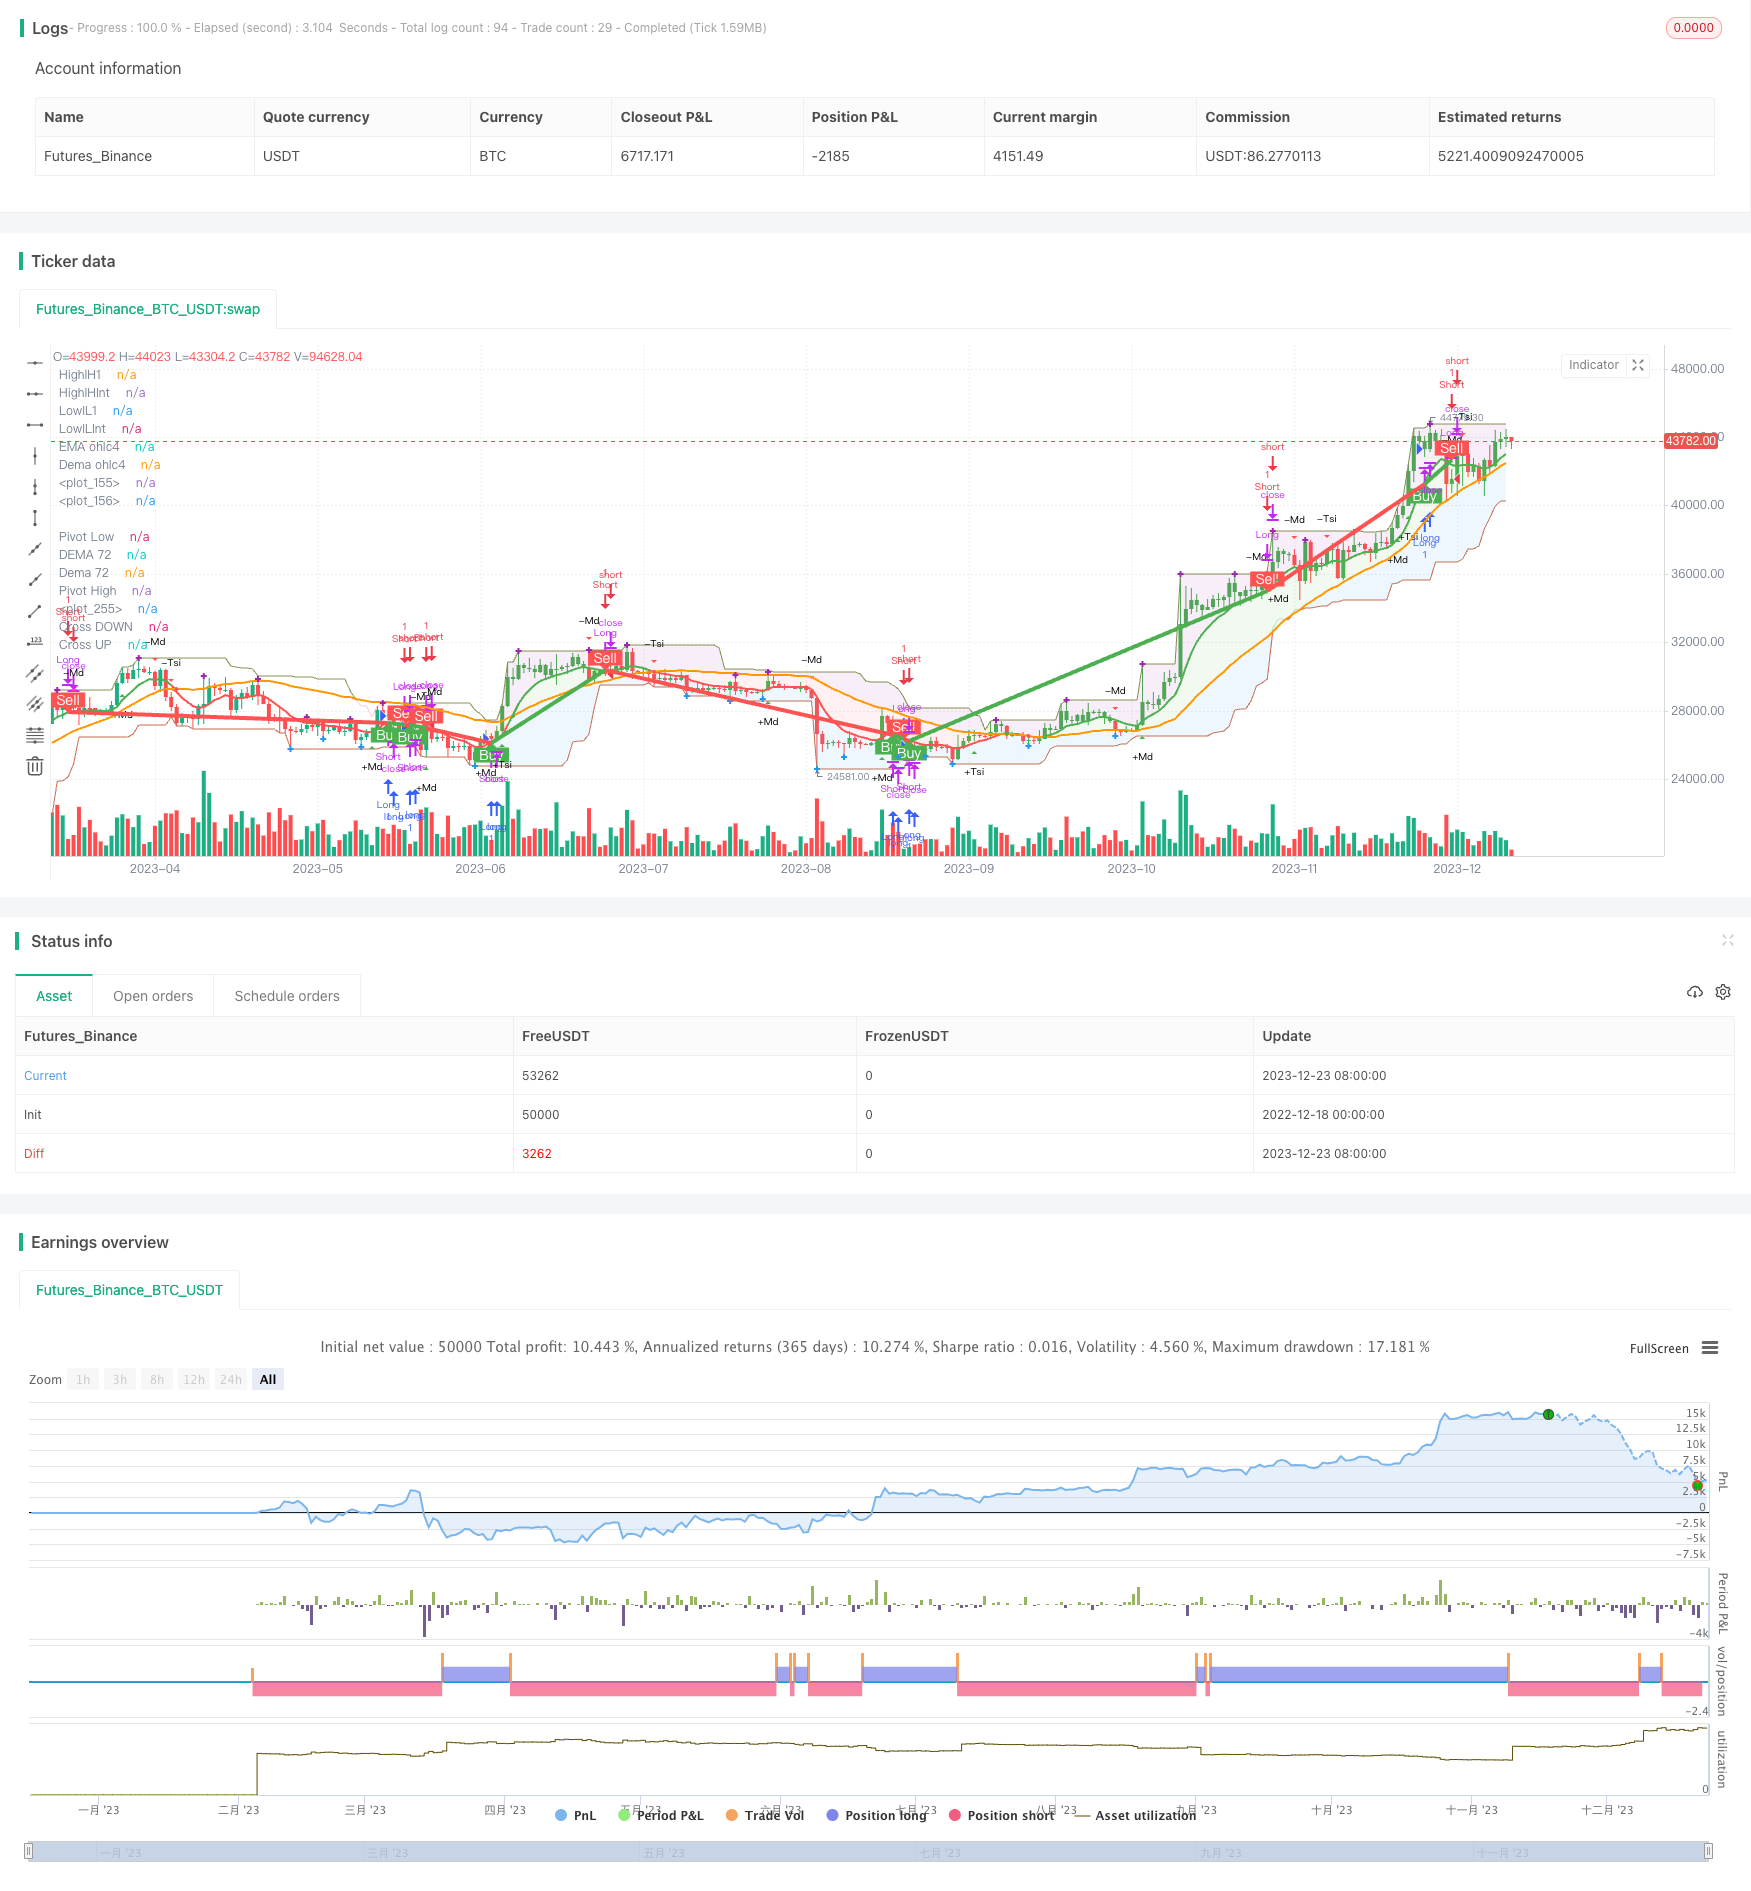
Dies ist eine einfache Quantifizierungsstrategie, die eine doppelte Moving Average-Kreuzung als Kauf- und Verkaufssignal verwendet. Es verwendet zwei unterschiedliche periodische MA-Linien, die ein Kaufsignal erzeugen, wenn die kurzperiodische MA-Linie von unten durch die langperiodische MA-Linie geht. Es erzeugt ein Verkaufsignal, wenn die kurzperiodische MA von oben durch die langperiodische MA geht.
Strategieprinzip
Die Strategie wird durch die Berechnung der 8-Zyklus-EMA und 72-Zyklus-EMA des Close-Preises und durch die Diagrammierung auf der Grafik erzeugt. Wenn die 8EMA 72 EMA überschreitet, erzeugt es ein Kaufsignal; wenn die 8EMA 72 EMA unterschreitet, erzeugt es ein Verkaufssignal.
Die Grundannahme der Strategie lautet: Die Kurz-MA-Linie repräsentiert die aktuelle Preisentwicklung und -bewegung, die Langzeit-MA-Linie den langfristigen Trend. Wenn die Kurz-MA eine lange MA durchbricht, zeigt dies, dass die kurzfristige Tendenz stärker wird und die Preise dazu bringt, die langfristige Durchschnittslinie zu durchbrechen, so dass ein Kauf möglich ist.
Die Strategie nutzt auch den William %R-Indikator, um überkaufte und überverkaufte Bereiche zu bestimmen, und den MACD-Indikator, um die Richtung der Preisbewegung zu bestimmen, um eine Referenz für Handelsentscheidungen zu liefern. Darüber hinaus werden einige Hilfsindikatoren wie Dema, Pivots usw. in der Strategie eingerichtet, um die Analyse der Trends zu unterstützen.
Analyse der Stärken
Der größte Vorteil der Dual-MA-Kreuzung besteht darin, dass sie einfach zu verstehen und zu implementieren ist. Durch die Kreuzung von zwei MA kann ein Handelssignal nach den Regeln erzeugt werden, ohne dass komplexe Modelle und Parameter optimiert werden müssen.
Ein weiterer Vorteil ist, dass die MA-Cross-Strategie in einem Trendmarkt besser funktioniert. Die MA-Cross-Strategie kann die großen Trends besser nutzen, wenn die Aktienkurse deutlich steigen oder fallen.
Risikoanalyse
Es gibt auch einige Risiken bei einer doppelten MA-Kreuzungsstrategie, die beachtet werden müssen. Erstens sind MA-Linien-Kreuzungen häufig und können zu Fehlsignalen und Kettenverlusten führen. Zweitens sind die MA-Kreuzungssignale häufig verspätet und können die Auswirkungen von Überraschungen nicht rechtzeitig widerspiegeln.
Risiken können durch die Kombination von anderen Indikatoren bestätigt werden, die Optimierung der MA-Parameter, oder in der Tendenz offensichtliche Markt-Operationen zu reduzieren. Es ist außerdem sehr wichtig, eine Stop-Loss-Stop-Sperre und Positionsmanagement.
Optimierungsrichtung
Diese einfache Double-MA-Strategie kann in folgenden Bereichen optimiert werden:
Tests mit verschiedenen Kombinationen von MA-Periodenparametern, um die optimale Parameter zu finden;
Signalfilterung mit anderen Indikatoren wie MACD, KDJ usw., um die Strategie zu stabilisieren;
Einrichtung von dynamischen Ausstiegsmechanismen, die die optimalen Stop-Loss-Positionen verfolgen, anstatt einfach feste Werte zu verwenden;
Anpassung der MA-Zyklen an die Marktsituation und Optimierung der Parameter;
In Kombination mit fortgeschrittenem maschinellem Lernen und Deep-Learning-Modellen werden Prognosen erstellt, um die Signalgenauigkeit zu verbessern.
Zusammenfassen
Diese Strategie ist als einfache Double MA Cross-Strategie leicht zu verstehen und zu implementieren, obwohl es einige Probleme mit Verzögerungen und Falschsignalen gibt. Mit einigen Optimierungsänderungen kann sie eine grundlegende und praktische Quantitative Trading-Strategie sein.
/*backtest
start: 2022-12-18 00:00:00
end: 2023-12-24 00:00:00
period: 1d
basePeriod: 1h
exchanges: [{"eid":"Futures_Binance","currency":"BTC_USDT"}]
*/

// This source code is subject to the terms of the Mozilla Public License 2.0 at https://mozilla.org/MPL/2.0/
// © DalmarSantos
//@version=4
//Entry and Exit points to TRADE ==> Pontos de Entrada e Saida de TRADE
//Functions in use ==> Funções em uso
//(1) DEMA - Double Exponential Moving Average 08/17/34/72 ==> Média Móvel Exponencial Dupla
//(2) ema() - Exponential Moving Averge 72/ochl4 ==> Média Móvel Exponencial
//(3) plot()
//(4) barcolor()
//(5) cross()
//(6) pivots()
//(7) William R% Md
//(8) Maximum and Minimum Value
//(9) fill()
//(10) macd() - Moving Average Convergence Divergence
//(11) tsi() - Trading Strenght Indicator==> Índice de Força Real (IFR)
//(12) Buy and Sell TRADE Points
//(13) Strategy Buy and Sell TRADE Points
strategy("[DS]Entry_Exit_TRADE.V01-Strategy", overlay=true)
//variable ==> variáveis
return = input(title="Return Candels ?", type=input.integer, defval=190) //quantity of candles to analise ==> quantidade de candles para analise
//
//****************************
//Function==> Função | (1)DEMA
//****************************
//Dema 08
e1 = ema(close,8)
e2 = ema(e1,8)
dema08 = 2 * e1 - e2
//
//Dema 17
e1 := ema(close,17)
e2 := ema(e1,17)
dema17 = 2 * e1 - e2
//
//Dema 34
e1 := ema(close,34)
e2 := ema(e1,34)
dema34 = 2 * e1 - e2
//
//Dema 72
e1 := ema(close,72)
e2 := ema(e1,72)
dema72 = 2 * e1 - e2
//
//******************************
//Function==> Função | (2) ema()
//******************************
ema72 = ema(close,72)
emaOhlc4=ema(ohlc4,8)
//
//******************************
//Function==> Função | (3)plot()
//******************************
//
////Show the avareges ==> Apresenta as médias
//plot(dema17, title="DEMA 17", color=color.new(color.lime,0), linewidth=1, style=plot.style_line, transp=0, show_last=return) // Doble Exponential Moving Avarage 17
//plot(dema34, title="DEMA 34", color=color.new(color.black,0), linewidth=1, style=plot.style_line, transp=0, show_last=return) // Doble Exponential Moving Avarage 34

plot(dema72, title="DEMA 72", color=color.orange, linewidth=2, style=plot.style_line, transp=0, show_last=return) // Doble Exponential Moving Avarage 72
plot(emaOhlc4, title="EMA ohlc4", color=emaOhlc4>dema72 ? color.new(color.green,0) : color.new(color.red,0), linewidth=2, style=plot.style_line, transp=0, show_last=return) // Doble Exponential Moving Avarage 72
//
//***********************************
//Function==> Função | (4) barcolor()
//***********************************
//Show color TRADE bar if emaOhlc4>dema72 green (Buy) if not red (Red) ==> Mostra a cor da barra de TRADE se emaOhlc4>dema72 verde (Compra) se não vermelha (Venda)
barcolor(close>dema34 and close>dema72 or close>close[1]  ? color.new(color.green,0) : color.new(color.red,0), show_last=return)
//
//********************************
//Function==> Função | (5) cross()
//********************************
// Show the intersections crossing average on the graph ==> Apresenta no gráfico o local dos cruzamentos das médias
//UP ==> para CIMA
plot(crossover(emaOhlc4,dema72) ? dema72 : na, title="Cross UP", color=color.green, transp=0, style=plot.style_circles, linewidth=5, show_last=return)
//DOWM ==> para BAIXO
plot(crossunder(emaOhlc4,dema72) ? dema72 : na, title="Cross DOWN", color=color.red, transp=50, style=plot.style_circles, linewidth=5, show_last=return)
//
//********************************
//Function==> Função | (6) pivot()
//Reference: Pine Script Manual
//********************************
_Pivots	= input(title = "══════ Pivots ══════", type = input.bool, defval = false)
leftBars = input(4)
rightBars=input(4)
pivotHigh = pivothigh(leftBars, rightBars) //pivot de alta
plot(pivotHigh>ema72[rightBars] ? pivotHigh : na, title="Pivot High", style=plot.style_cross, linewidth=3, color= color.purple, transp=50, offset=-rightBars, show_last=return)
pivotLow = pivotlow(leftBars, rightBars) //pivot de baixa
plot(pivotLow<ema72[rightBars] ? pivotLow : na, title="Pivot Low", style=plot.style_cross, linewidth=3, color= color.blue, transp=50, offset=-rightBars, show_last=return)
//
//***************************************
//Function==> Função | (7) WILLIAM R% MOD
//Reference: Pine Script Manual
//***************************************
// Getting inputs
_WilliamR	= input(title = "══════ William R% Mod ══════", type = input.bool, defval = false)
SOB_William = input(title="OverBought Area", type=input.integer, defval=-7) //OverBought area ==> Area de SobreCompra
SOS_William = input(title="OverSold Area", type=input.integer, defval=-93) //OverSold area ==> Area de SobreVenda
length_William = input(17, minval=1) //interval ==> intervalo
highestHigh_William = highest(length_William) //maximum value ==> valor máximo
highestLow_William = lowest(length_William) //minumum value ==> valor mínimo
R_William = (highestHigh_William - close) / (highestHigh_William - highestLow_William) * -100
//Show the position ==> mostra a posição
//plotshape(R_William > SOS_William ? na : high, text="+R%", title="+r(+)%R Up", location=location.belowbar, color=color.green, transp=30, style=shape.triangleup, size=size.tiny, show_last=return)
//plotshape(R_William < SOB_William ? na : low, text="-R%", title="(-)%R DN", location=location.abovebar, color=color.red, transp=30, style=shape.triangledown, size=size.tiny, show_last=return)
//
// Show label with William %R value ==> Mostra a etiqueta com o valor do William %R
// The color label red is when the value arrive on OverBought Area and green on OverSold Area, be careful with these areas ==> O rótulo de cor vermelha é quando o valor chega na área de SobreCompra e verde na área de SobreVenda, cuidado com estas áreas
//
corTest=color.white
colorText = color.white
estilo = label.style_label_upper_left
textW=""
if R_William>SOB_William
    corTest := color.new(color.red,0) //vermelho escuro
    estilo := label.style_label_lower_left
    textW:="OB"

if R_William>-30 and R_William<=SOB_William
    corTest := #f5948e //vermelho intermediário
    estilo := label.style_label_lower_left

if R_William>-50 and R_William<=-30
    corTest := #f5d5d3 //vermelho claro
    colorText := color.black

if R_William>-70 and R_William<=-50
    corTest := #e7f5d3 //verde claro
    colorText := color.black

if R_William>=SOS_William and R_William<=-70
    corTest := color.lime //verde intermediario
    estilo := label.style_label_upper_left
    colorText := color.black

if R_William<SOS_William
    corTest := color.new(color.green,0) // verde escuro
    estilo := label.style_label_upper_left
    textW:="OS"
// Make a label at the high of the current bar
myLabel = label.new(x=bar_index, y=close, style= estilo, color=corTest, text=tostring(R_William,"#.#")+"% "+textW, textcolor=colorText, size=size.normal)
// Get the label text
labelText = label.get_text(id=myLabel)
// Then set the label's text to a new string that
// includes its current text
label.set_text(id=myLabel, text=labelText)
label.delete(myLabel[1])
//
//**************************************************
//Function==> Função | (8) MAXIMUM AND MINIMUM VALUE
//Reference: Pine Script Manual
//**************************************************
//Maximum High and Minimum Low close position ==> Posição Máxima e Minima de fechamento
ExtremoHigh=high+(highestHigh_William-high)
ExtremoLow=low-(low-highestLow_William)
plot(ExtremoHigh, color=color.new(color.red,70), style=plot.style_line, linewidth=1, show_last=return)
plot(ExtremoLow, color=color.new(color.green,70), style=plot.style_line, linewidth=1, show_last=return)
//Show the Extreme High and Low close position ==> Mostra a extrema posicao alta e baixa do fechamento
lH1 = 0.0
lHInt = close
lL1 = close
lLInt = close
Vr_LinhaH=0.0
Vr_LinhaL=0.0
Vr_LinhaC=0.0
if emaOhlc4<dema72
    Vr_LinhaH := high+(highestHigh_William-high)
    lH1 := Vr_LinhaH>dema72 ?  Vr_LinhaH : dema72
    lHInt:=emaOhlc4<dema72 ? dema72 : emaOhlc4
    lLInt := lHInt==emaOhlc4 ? dema72 : emaOhlc4
    Vr_LinhaL:= low-(low-highestLow_William)
    lL1 := Vr_LinhaL>lLInt ?  lLInt : Vr_LinhaL

if emaOhlc4>dema72
    Vr_LinhaH := high+(highestHigh_William-high)
    lH1 := Vr_LinhaH>dema72 ?  Vr_LinhaH : dema72
    lHInt:=dema72>emaOhlc4 ? dema72 : emaOhlc4
    lLInt := lHInt==dema72 ? emaOhlc4 : dema72
    Vr_LinhaL:= low-(low-highestLow_William)
    lL1 := Vr_LinhaL>lLInt ?  lLInt : Vr_LinhaL
//
//*******************************
//Function==> Função | (9) fill()
//Reference: Pine Script Manual
//*******************************
//Show TRADE area in red (Sell) and green (Buy) ==> Mostra a área de trade em vermelho (Venda) e verde (Compra)
Line1 = plot(emaOhlc4, title="Dema ohlc4", color=color.new(color.white,100), linewidth=1, transp=0, show_last=return)
Line2 = plot(dema72,  title="Dema 72", color=color.new(color.white,100), linewidth=1,transp=0, show_last=return)
fill(Line1, Line2, color=emaOhlc4>dema72 ? color.new(color.green,90) : color.new(color.red,90), transp=70, show_last=return)

//High area ==> Area de alta
HighlH1 = plot(lH1, title="HighlH1", color=color.green, linewidth=1, transp=90, show_last=return, style=plot.style_linebr)
HighlHInt = plot(lHInt, title="HighlHInt", color=color.green, linewidth=1, transp=100, show_last=return, style=plot.style_linebr)
fill(HighlH1, HighlHInt, color=color.new(color.purple,90),  transp=0, show_last=return)

//Low area ==> Area de baixa
LowlL1 = plot(lL1, title="LowlL1", color=color.red, linewidth=1, transp=90, show_last=return, style=plot.style_linebr)
LowlLInt = plot(lLInt, title="LowlLInt", color=color.red, linewidth=1, transp=100, show_last=return, style=plot.style_linebr)
fill(LowlL1, LowlLInt, color=color.new(color.blue,90),  transp=0, show_last=return)
//
//***************************************************************************
//Function==> Função | (10) macd() - Moving Average Convergence Divergence
//Reference: Pine Script Manual - adapted TradingView version - Dalmar Santos
//***************************************************************************
// Getting inputs
_Macd	= input(title = "═════ Macd ══════════", type = input.bool, defval = false)
fast_length_Macd = input(title="Fast Length", type=input.integer, defval=12)
slow_length_Macd = input(title="Slow Length", type=input.integer, defval=26)
src_Macd = input(title="Source", type=input.source, defval=close)
signal_length_Macd = input(title="Signal Smoothing", type=input.integer, minval = 1, maxval = 50, defval = 9)
// Calculating
fast_ma_Macd = ema(src_Macd, fast_length_Macd)
slow_ma_Macd = ema(src_Macd, slow_length_Macd)
macd_Macd = fast_ma_Macd - slow_ma_Macd
signal_Macd = ema(macd_Macd, signal_length_Macd)
hist_Macd = macd_Macd - signal_Macd
//cross Macd
MacdUp = crossover(macd_Macd,signal_Macd) ? 1 : 0
MacdDown = crossunder (macd_Macd,signal_Macd) ? 1 : 0
plotshape(MacdUp, text="+Md", title="(+)MACD UP", location=location.belowbar, color=color.green, transp=30, style=shape.triangleup, size=size.tiny, show_last=return)
plotshape(MacdDown, text="-Md", title="(-)MACD DN", location=location.abovebar, color=color.red, transp=30, style=shape.triangledown, size=size.tiny, show_last=return)
//
//*****************************************************************************************
//Function==> Função | (11) tsi() - Trading Strenght Indicator ==> Indice de Força do Trading
//Reference: Pine Script Manual - adapted TradingView version - Dalmar Santos
//*****************************************************************************************
_Tsi	= input(title = "═════ Tsi ══════════", type = input.bool, defval = false)
long_tsi = input(title="Long Length", type=input.integer, defval=72)
short_tsi = input(title="Short Length", type=input.integer, defval=17)
signal_tsi = input(title="Signal Length", type=input.integer, defval=17)
price_tsi = close
double_smooth(src_tsi, long_tsi, short_tsi) =>
	fist_smooth_tsi = ema(src_tsi, long_tsi)
	ema(fist_smooth_tsi, short_tsi)
pc_tsi = change(price_tsi)
double_smoothed_pc_tsi = double_smooth(pc_tsi, long_tsi, short_tsi)
double_smoothed_abs_pc_tsi = double_smooth(abs(pc_tsi), long_tsi, short_tsi)
tsi_value_tsi = 100 * (double_smoothed_pc_tsi / double_smoothed_abs_pc_tsi)
//TSI signal ==> Signal do TSI
TsiUp = crossover(tsi_value_tsi,ema(tsi_value_tsi, signal_tsi)) ? 1 : 0
TsiDown = crossunder(tsi_value_tsi,ema(tsi_value_tsi, signal_tsi)) ? 1 : 0
//Show the Position ==> Mostra a posicao
plotshape(TsiUp==1 ? low : na, text="+Tsi", title="(+)TSI Up", location=location.belowbar, color=color.green, transp=30, style=shape.triangleup, size=size.tiny, show_last=return)
plotshape(TsiDown==1 ? high : na, text="-Tsi", title="(-)TSI DN", location=location.abovebar, color=color.red, transp=30, style=shape.triangledown, size=size.tiny, show_last=return)
//
//***************************************************************************
//Function==> Função | (12) Buy and Sell TRADE Points
//Reference: Pine Script Manual - adapted TradingView version - Dalmar Santos
//***************************************************************************
//Cross Point ==> pontos de cruzamento
crossUP=crossover(emaOhlc4,dema34)
crossDN=crossunder(emaOhlc4,dema34)
//Show de Buy and Sell points ==> mostra pontos de compra e venda
tradeColor=crossUP ? color.red : crossDN ? color.green : na
//line buy or sell ==> linha de compra ou venda
plot(crossUP ? dema34 : crossDN ? dema34: na, color=tradeColor, style=plot.style_line, linewidth=4, editable=false, show_last=return)
//Buy point ==> pontos de compra
plotshape(crossUP ? dema34 : na, style=shape.labelup, location=location.absolute, text="Buy", transp=0, textcolor = color.white, color=color.green, editable=false, show_last=return)
//Sell points ==> pontos de venda
plotshape(crossDN ? dema34: na, style=shape.labeldown, location=location.absolute, text="Sell", transp=0, textcolor = color.white, color=color.red, editable=false, show_last=return)
//
//************************************************************
//Function==> Função | (13) Strategy Buy and Sell TRADE Points
//Reference: Pine Script Manual - Dalmar Santos
//************************************************************
//Start backtest year, month, day, hour, minute, second ==> Inicio do backtest ano, mês, dia, hora, minuto, segundo
start = timestamp(2021,01,01,1,00,00)
//*****************
//BUY ==> COMPRA
//*****************
if time>= start
    if crossUP
        strategy.close("Short", comment="Close Sell")
        strategy.entry("Long", strategy.long, 1, comment="Open Buy")

//*****************
//SELL ==> Venda
//*****************
    if crossDN
        strategy.close("Long", comment="Close Buy")
        strategy.entry("Short", strategy.short, 1, comment="Open Sell")