
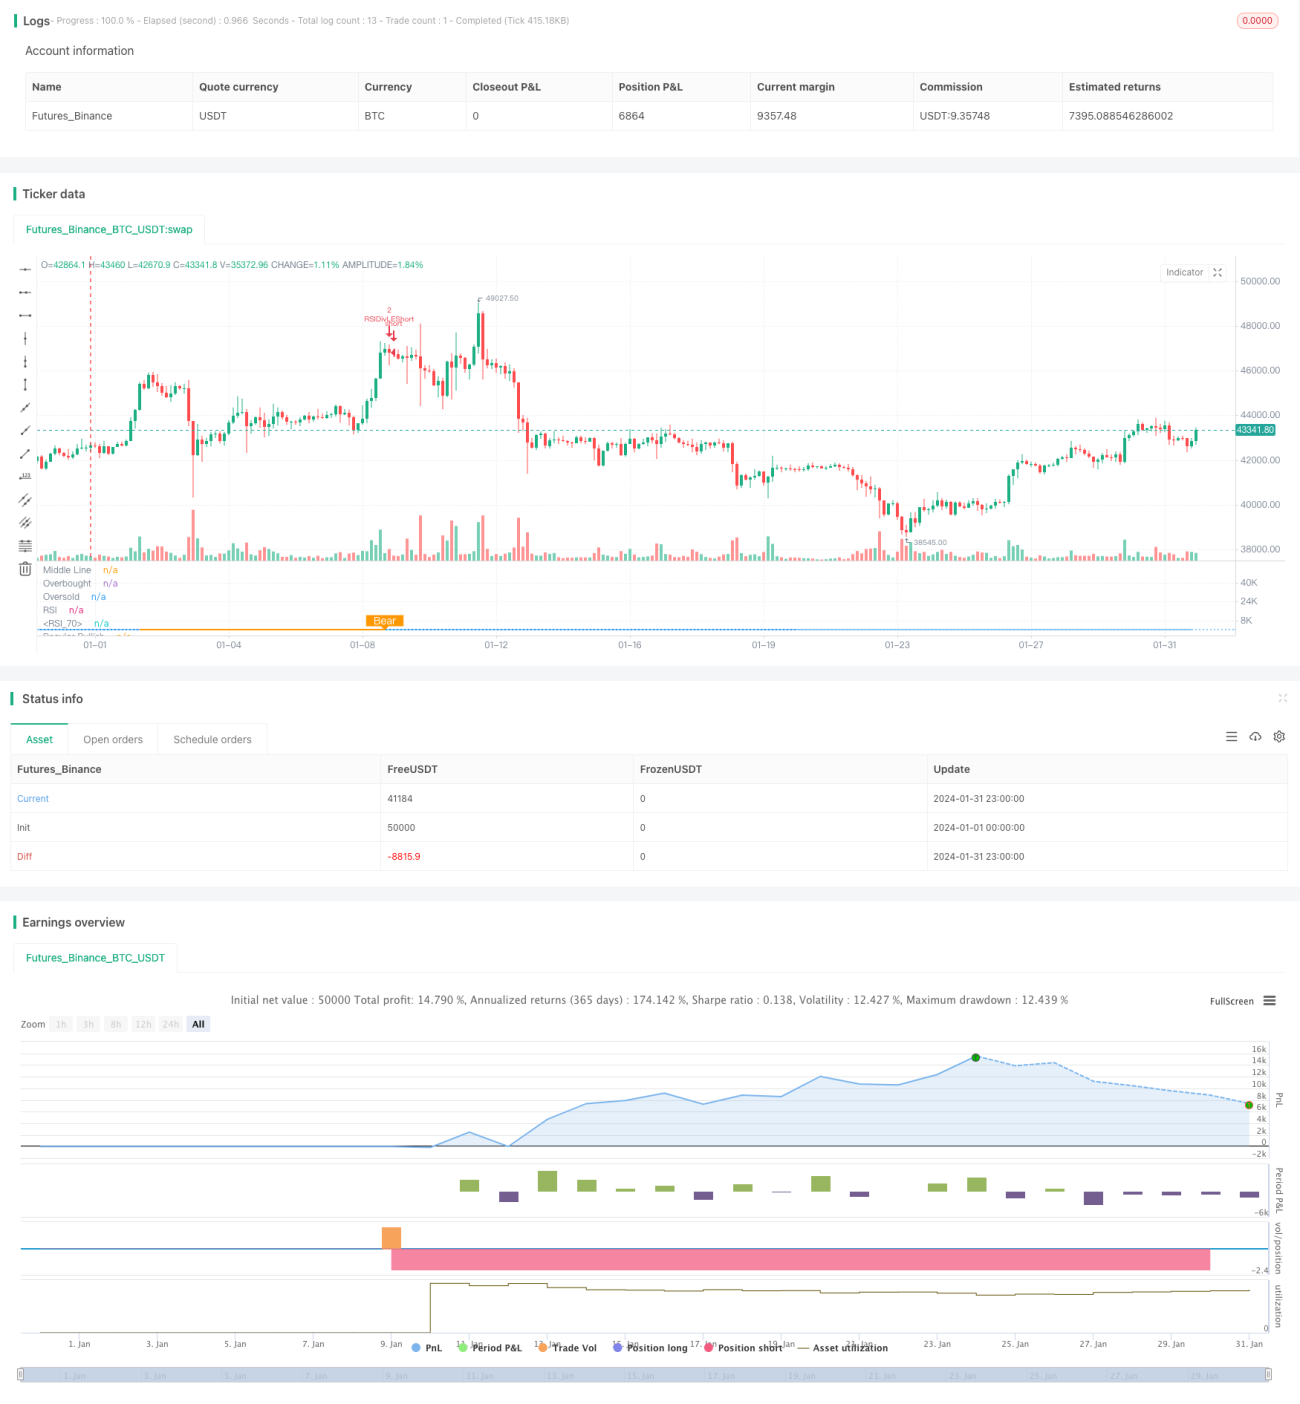
Die Strategie identifiziert das Phänomen der hohen Spaltung durch den RSI-Indikator und trifft Handelsentscheidungen entsprechend. Die zentrale Idee ist, dass bei neuen Niedrigkeiten und neuen Höhen im RSI-Indikator ein mehrköpfiges Spaltungssignal erzeugt wird, das zeigt, dass sich eine Basis gebildet hat, und dass bei neuen Höhen und neuen Niedrigkeiten im RSI ein hoher Spaltungssignal erzeugt wird, der zeigt, dass sich eine Spitze gebildet hat.
Die Strategie verwendet hauptsächlich den RSI-Indikator, um die Mehrspaltung zwischen dem Preis und dem RSI zu identifizieren, wie folgt:
Durch die Identifizierung der Mehrspaltung zwischen dem Preis und dem RSI-Indikator kann ein Wendepunkt in der Preisentwicklung im Voraus erfasst werden, anhand dessen Handelsentscheidungen getroffen werden können.
Diese Strategie hat folgende Vorteile:
Die Strategie birgt auch Risiken:
Eine Abweichung des RSI-Indikators bedeutet nicht unbedingt eine sofortige Umkehr des Preises, es kann eine Zeitlücke vorhanden sein, was zu einem Risiko führt, dass ein Stop-Loss ausgelöst wird. Die Lösung besteht darin, den Stop-Loss angemessen zu lockern und dem Preis genügend Zeit zu geben, um das Abweichungssignal zu bestätigen.
Eine längere Dauer der Trennung erhöht das Risiko. Die Lösung ist die Kombination eines längeren Tages- oder Kreis-RSI-Indikators als Filterbedingungen.
Eine zu geringe Abweichung kann auch keine Trendwende bestätigen, und es ist notwendig, den Rücklaufbereich angemessen zu vergrößern, um nach einer deutlicheren RSI-Abweichung zu suchen.
Die Strategie kann auch in folgenden Richtungen optimiert werden:
Optimierung der RSI-Parameter und Suche nach der optimalen Kombination
Versuchen Sie, andere technische Kennzahlen wie MACD, KD, etc. zu identifizieren
Erhöhung der Anzahl von Fehltransaktionen in Krisenperioden durch Erhöhung der Filterbedingungen für die entsprechenden Krisenperioden
RSI-Indikatoren in Kombination mit mehr Zeiträumen auf der Suche nach den besten Kombinationssignalen
Die RSI-Strategie für die Trennung von Hohlräumen erstellt Handelssignale durch die Identifizierung von Hohlräumen zwischen dem RSI-Indikator und dem Preis, um die Wendepunkte für die Preisentwicklung zu ermitteln. Die Strategie ist einfach und praktisch und kann die Gewinnwahrscheinlichkeit durch optimierte Parameter-Einstellungen und erhöhte Filterbedingungen weiter erhöhen.
/*backtest
start: 2024-01-01 00:00:00
end: 2024-01-31 23:59:59
period: 3h
basePeriod: 15m
exchanges: [{"eid":"Futures_Binance","currency":"BTC_USDT"}]
*/
// This source code is subject to the terms of the Mozilla Public License 2.0 at https://mozilla.org/MPL/2.0/
// © Nextep
//@version=4
strategy(title="RSI top&bottom destroy ", overlay=false, pyramiding=4, default_qty_value=2, default_qty_type=strategy.fixed, initial_capital=10000, currency=currency.USD)
// INPUT Settings --------------------------------------------------------------------------------------------------------------------------------------------------
len = input(title="RSI Period", minval=1, defval=13)
src = input(title="RSI Source", defval=close)
// defining the lookback range for shorts
lbRshort = input(title="Short Lookback Right", defval=1)
lbLshort = input(title="Short Lookback Left", defval=47)
// defining the lookback range for longs
lbRlong = input(title="Long Lookback Right", defval=2)
lbLlong = input(title="Long Lookback Left", defval=14)
rangeUpper = input(title="Max of Lookback Range", defval=400)
rangeLower = input(title="Min of Lookback Range", defval=1)
// take profit levels
takeProfitLongRSILevel = input(title="Take Profit at RSI Level", minval=0, defval=75)
takeProfitShortRSILevel = input(title="Take Profit for Short at RSI Level", minval=0, defval=25)
// Stop loss settings
longStopLossType = input("PERC", title="Long Stop Loss Type", options=['ATR','PERC', 'FIB', 'NONE'])
shortStopLossType = input("PERC", title="Short Stop Loss Type", options=['ATR','PERC', 'FIB', 'NONE'])
longStopLossValue = input(title="Long Stop Loss Value", defval=14, minval=0)
shortStopLossValue = input(title="Short Stop Loss Value", defval=5, minval=-10)
// PLOTTING THE CHARTS --------------------------------------------------------------------------------------------------------------------------------------------------
// Plotting the Divergence
plotBull = input(title="Plot Bullish", defval=true)
plotBear = input(title="Plot Bearish", defval=true)
bearColor = color.orange
bullColor = color.green
textColor = color.white
noneColor = color.new(color.white, 100)
// Adding the RSI oscillator
osc = rsi(src, len)
ma_len = 14 // Length for the moving average
rsi_ma = sma(osc, ma_len) // Calculate the moving average of RSI
plot(osc, title="RSI", linewidth=1, color=color.purple)
plot(rsi_ma, color=color.blue, title="RSI MA") // Plot the RSI MA
// Adding the lines of the RSI oscillator
plot(osc, title="RSI", linewidth=1, color=color.purple)
hline(50, title="Middle Line", linestyle=hline.style_dotted)
obLevel = hline(75, title="Overbought", linestyle=hline.style_dotted)
osLevel = hline(25, title="Oversold", linestyle=hline.style_dotted)
fill(obLevel, osLevel, title="Background", color=color.purple, transp=80)
atrLength = input(14, title="ATR Length (for Trailing stop loss)")
atrMultiplier = input(3.5, title="ATR Multiplier (for Trailing stop loss)")
// RSI PIVOTS --------------------------------------------------------------------------------------------------------------------------------------------------
// Define a condition for RSI pivot low
isFirstPivotLowlong = not na(pivotlow(osc, lbLlong, lbRlong))
// Define a condition for RSI pivot high
isFirstPivotHighlong = not na(pivothigh(osc, lbLlong, lbRlong))
// Define a condition for the first RSI value
firstPivotRSIValuelong = isFirstPivotLowlong ? osc[lbRlong] : na
// Define a condition for the second RSI value
secondPivotRSIValuelong = isFirstPivotLowlong ? valuewhen(isFirstPivotLowlong, osc[lbRlong], 1) : na
// Define a condition for RSI pivot low
isFirstPivotLowshort = not na(pivotlow(osc, lbLshort, lbRshort))
// Define a condition for RSI pivot high
isFirstPivotHighshort = not na(pivothigh(osc, lbLshort, lbRshort))
// Define a condition for the first RSI value
firstPivotRSIValueshort = isFirstPivotLowshort ? osc[lbRshort] : na
// Define a condition for the second RSI value
secondPivotRSIValueshort = isFirstPivotLowshort ? valuewhen(isFirstPivotLowshort, osc[lbRshort], 1) : na
_inRange(cond) =>
bars = barssince(cond == true)
rangeLower <= bars and bars <= rangeUpper
// ADDITIONAL ENTRY CRITERIA --------------------------------------------------------------------------------------------------------------------------------------------------
// RSI crosses RSI MA up by more than 2 points and subsequently down
rsiUpCross = crossover(osc, rsi_ma + 1)
rsiDownCross = crossunder(osc, rsi_ma - 1)
// Calculate the daily RSI
rsiDaily = security(syminfo.ticker, "D", rsi(src, 14))
// BULLISH CONDITIONS --------------------------------------------------------------------------------------------------------------------------------------------------
// LOWER LOW PRICE & HIGHER LOW OSC
// Price: Lower Low
priceLL = na(isFirstPivotLowlong[1]) ? false : (low[lbRlong] < valuewhen(isFirstPivotLowlong, low[lbRlong], 1))
// Osc: Higher Low
oscHL = na(isFirstPivotLowlong[1]) ? false : (osc[lbRlong] > valuewhen(isFirstPivotLowlong, osc[lbRlong], 1) and _inRange(isFirstPivotLowlong[1]))
// BULLISH PLOT
bullCond = plotBull and priceLL and oscHL and isFirstPivotLowlong
plot(
isFirstPivotLowlong ? osc[lbRlong] : na,
offset=-lbRlong,
title="Regular Bullish",
linewidth=2,
color=(bullCond ? bullColor : noneColor),
transp=0
)
plotshape(
bullCond ? osc[lbRlong] : na,
offset=-lbRlong,
title="Regular Bullish Label",
text=" Bull ",
style=shape.labelup,
location=location.absolute,
color=bullColor,
textcolor=textColor,
transp=0
)
// BEARISH CONDITIONS --------------------------------------------------------------------------------------------------------------------------------------------------
// HIGHER HIGH PRICE & LOWER LOW OSC
// Osc: Lower High
oscLH = na(isFirstPivotHighshort[1]) ? false : (osc[lbRshort] < valuewhen(isFirstPivotHighshort, osc[lbRshort], 1) and _inRange(isFirstPivotHighshort[1]))
// Price: Higher High
priceHH = na(isFirstPivotHighshort[1]) ? false : (high[lbRshort] > valuewhen(isFirstPivotHighshort, high[lbRshort], 1))
// BEARISH PLOT
bearCond = plotBear and priceHH and oscLH and isFirstPivotHighshort
plot(
isFirstPivotHighshort ? osc[lbRshort] : na,
offset=-lbRshort,
title="Regular Bearish",
linewidth=2,
color=(bearCond ? bearColor : noneColor),
transp=0
)
plotshape(
bearCond ? osc[lbRshort] : na,
offset=-lbRshort,
title="Regular Bearish Label",
text=" Bear ",
style=shape.labeldown,
location=location.absolute,
color=bearColor,
textcolor=textColor,
transp=0
)
// ENTRY CONDITIONS --------------------------------------------------------------------------------------------------------------------------------------------------
longCondition = false
shortCondition = false
// Entry Conditions
longCondition := bullCond
shortCondition := bearCond
// Conditions to prevent entering trades based on daily RSI
longCondition := longCondition and rsiDaily >= 23
shortCondition := shortCondition and rsiDaily <= 80
// STOPLOSS CONDITIONS --------------------------------------------------------------------------------------------------------------------------------------------------
// Stoploss Conditions
long_sl_val =
longStopLossType == "ATR" ? longStopLossValue * atr(atrLength)
: longStopLossType == "PERC" ? close * longStopLossValue / 100 : 0.00
long_trailing_sl = 0.0
long_trailing_sl := strategy.position_size >= 1 ? max(low - long_sl_val, nz(long_trailing_sl[1])) : na
// Calculate Trailing Stop Loss for Short Entries
short_sl_val =
shortStopLossType == "ATR" ? 1 - shortStopLossValue * atr(atrLength)
: shortStopLossType == "PERC" ? close * (shortStopLossValue / 100) : 0.00 //PERC = shortstoplossvalue = -21300 * 5 / 100 = -1065
short_trailing_sl = 0.0
short_trailing_sl := strategy.position_size <= -1 ? max(high + short_sl_val, nz(short_trailing_sl[1])) : na
// RSI STOP CONDITION
rsiStopShort = (strategy.position_avg_price != 0.0 and close <= strategy.position_avg_price * 0.90) or (strategy.position_avg_price != 0.0 and rsi(src, 14) >= 75)
rsiStopLong = (strategy.position_avg_price != 0.0 and close >= strategy.position_avg_price * 1.10) or (strategy.position_avg_price != 0.0 and rsi(src, 14) <= 25)
// LONG CONDITIONS --------------------------------------------------------------------------------------------------------------------------------------------------
strategy.entry(id="RSIDivLELong", long=true, when=longCondition)
strategy.entry(id="RSIDivLEShort", long=false, when=shortCondition)
// Close Conditions
shortCloseCondition = bullCond // or cross(osc, takeProfitShortRSILevel)
strategy.close(id="RSIDivLEShort", comment="Close All="+tostring(-close + strategy.position_avg_price, "####.##"), when=abs(strategy.position_size) <= -1 and shortStopLossType == "NONE" and shortCloseCondition )
strategy.close(id="RSIDivLEShort", comment="TSL="+tostring(-close + strategy.position_avg_price, "####.##"), when=abs(strategy.position_size) >= -1 and ((shortStopLossType == "PERC" or shortStopLossType == "ATR") and cross(short_trailing_sl,high))) // or rsiStopShort)// or rsiStopShort)
longCloseCondition = bearCond
strategy.close(id="RSIDivLELong", comment="Close All="+tostring(close - strategy.position_avg_price, "####.##"), when=abs(strategy.position_size) >= 1 and longStopLossType == "NONE" and longCloseCondition)
strategy.close(id="RSIDivLELong", comment="TSL="+tostring(close - strategy.position_avg_price, "####.##"), when=abs(strategy.position_size) >= 1 and ((longStopLossType == "PERC" or longStopLossType == "ATR") and cross(long_trailing_sl,low))) //or rsiStopLong