Peak and slope
Author: The Little Dream, Created: 2017-01-05 14:06:15, Updated:Peak and slope
-
Peak kurtosis and skewness
This article was originally published by EasyTrader.
This is a trading strategy that applies the kurtosis and skewness of the statistical data distribution. When the data is trending and the potential trend is positive, we do more. When the data is trending and the potential trend is negative, we do nothing.
So, how do we determine the trend and the intensity of the trend? Let's review the definition of peaks and slopes first.
Let's first define the normal distribution.
Distribution: The distribution of the number of occurrences of all the values in a variable, represented by the number of variables on the diagonal axis and the coordinate graph of the occurrence frequency on the vertical axis.
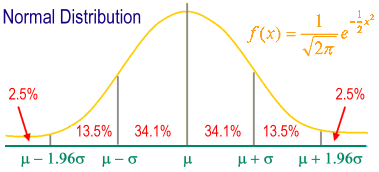
Standard normal distribution: a normal distribution graph drawn as the base unit of the coordinate axis centered on the mean and the standard deviation; the shape is a bell-shaped symmetric graph.
m ± 1 s contains 68.26% of the entire sample group.
m ± 2 s contains 95.44% of the entire sample group.
m ± 3 s contains 99.74% of the entire sample group.
95% of individuals fall between m ± 1.96s.
99% of individuals fall between m ± 2.58s.
In statistics, peak (Kurtosis) measures the peak state of the probability distribution of a real number of random variables. Peak high means that the differential increase is caused by an extreme deviation of the low frequency greater than or less than the mean.
The kurtosis is a statistical measure of the sharpness of the distribution pattern of a set of data. The peak of a normal distribution is 3, so we call a peak greater than 3 a sharp peak, indicating a more concentrated and smooth distribution of data than a normal distribution. We use a peak less than 3 as a flat peak, indicating a smoother distribution of data than a normal distribution.
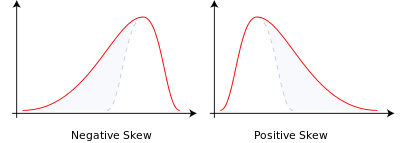
Skewness describes the symmetry of the distribution of data, or the position of the population in the data mode. Skewness equal to 0 describes perfect symmetry. This statistic also requires a comparison with the normal distribution: skewness greater than 0 indicates that the array is skewed to the right, showing a right-handed long tail and extreme values are more likely to be on the right, compared with the normal distribution.
In probability theory and statistics, bias measures the asymmetry of the probability distribution of a real random variable. The value of bias can be positive, negative, or even undefined. Quantitatively, bias is negative if the tail is longer on the left side of the probability density function than on the right side, and the vast majority of values (including medians) are on the right side of the mean.
There are two types of bias:
- Negative bias or left bias: the tail on the left side is longer and the distribution is concentrated on the right side.
- Orthorhombic or right-sided: the tail on the right side is longer, and the distribution of the main body is concentrated on the left side.
- If the distribution is symmetric, then the mean = the median, and the bias is zero. (Also, if the distribution is a monomial distribution, then the mean = the median = the set of numbers.)
-
So, we can conclude the following rules of trade: When the peak is less than 0 (the market is in a trending market), the bias is greater than N (the trend is up), do more; When the peak is less than 0 (the market is in a trending market), the bias is less than M (the trend is down), do nothing;
MATLAB source code: Interested can be converted to JS language test.
input:ExitType(5) ;
input:NBarL(2),NBarS(2),TradeProfit(0.053),TradeStopLoss(0.023),ATRs_L(5.4),ATRs_S(10.9);
vars: IsBalanceDay(False),MP(0),PF(0),PL(0),HLRange(100);

inputs:Length(20),Trigger(3),UpSkew(3.4),DownSkew(2.2) ;
vars:KurtValue(0),SkewValue(0),BuyPoint(0),SellPoint(0);

MP = MarketPosition ;
if DAYofMonth(Date) > 14 and DAYofMonth(Date) < 22 and DAYofWeek(Date)= 3 then isBalanceDay = True else isBalanceDay =False ;

PF = AvgPrice*TradeProfit ;
PL = AvgPrice*TradeStopLoss ;

{计算峰度 }
KurtValue = Kurtosis(Close,Length) ;
{计算偏度}
SkewValue = Skew(Close,Length) ;

{ 峰度向下跌破 Trigger 线 ,建立买卖点 }
if KurtValue Cross under Trigger then Begin
BuyPoint = High 3;
SellPoint = Low-3;
end;

{ 偏度大于某数值后 ,趋势确认进场作多 }
if  SkewValue > -UpSkew 2 then Buy next bar at BuyPoint stop ;
{ 偏度小于某数值后 ,趋势确认进场作空 }
if  SkewValue < -DownSkew 2 then Sell next bar at SellPoint Stop ;
end;

if ExitType = 1 then SetStopLoss(PL * BigPointValue) ;

if ExitType = 2 then Begin
SetStopLoss(PL * BigPointValue) ;
setProfitTarget(PF * BigPointValue) ;
end;

if ExitType = 3 then Begin
if MP > 0 and BarsSinceEntry = NBarL then ExitLong next bar at Market ;
if MP < 0 and BarsSinceEntry = NBarS then ExitShort next bar at Market ;
end;

if ExitType = 4 then Begin
SetStopLoss(PL * BigPointValue) ;
setProfitTarget(PF * BigPointValue) ;
if MP > 0 and BarsSinceEntry = NBarL then {Sell } ExitLong next bar at Market ;
if MP < 0 and BarsSinceEntry = NBarS then {Buy} ExitShort next bar at Market ;
end;

if ExitType = 5 then Begin
{*******************************************************************
Description : ATR Trailing Stop Long Exit
Provided By : Omega Research, Inc. (c) Copyright 1999
********************************************************************}
{Inputs: ATRs_L(3);}
Variables: PosHigh(0), ATRVal_L(0);

ATRVal_L = AvgTrueRange(10) * ATRs_L;
If BarsSinceEntry = 0 Then PosHigh = High;
If MarketPosition = 1 Then Begin
If High > PosHigh Then PosHigh = High;
ExitLong ("ATR") Next Bar at PosHigh - ATRVal_L Stop;
End else ExitLong ("ATR eb") Next bar at High - ATRVal_L Stop;

{*******************************************************************
Description : ATR Trailing Stop Short Exit
Provided By : Omega Research, Inc. (c) Copyright 1999
******************************************************************}
{Inputs: ATRs_S(3);}
Variables: PosLow(0), ATRVal_S(0);

ATRVal_S = AvgTrueRange(10) * ATRs_S;
If BarsSinceEntry = 0 Then PosLow = Low;
If MarketPosition = -1 Then Begin
If Low < PosLow Then PosLow = Low;
ExitShort ("ATR_1") Next Bar at PosLow ATRVal_S Stop;
End else ExitShort ("ATR_1 eb") Next bar at Low ATRVal_S Stop;
end;

if IsBalanceDay then setExitonClose ;
Translated from Faruto's blog
- Why investing requires strategic thinking?
- Python -- numpy matrix operations
- Algorithmic trading strategies
- Martinel's tactics, his single-handed gamble on fate?
- JSLint detects the syntax of JavaScript
- How partial equity impacts the average price of holdings
- Bitcoin exchange network error GetOrders: parameter error
- The template of the listing system triggers the design outline of ten items
- The technical gist of the shark system trading rules
- Template 3.0: Draw line class library
- The most profitable economist, writing papers and leading economist, Tom Maynard Keynes
- Template 3.2: Digital currency trading class library (integrated Cash, futures support OKCoin futures/BitVC)
- I'm sorry, but Gauss did a small job.
- A Brief History of Risk (IV) Von Mover and the Curve of the Gods
- A short history of risk (5) Bayes, a man who lives only in his textbooks
- A brilliant explanation for the alternative to stop loss
- 2.13 Common error messages, exchange API error codes, various problems encountered by digital currency robots!
- OkCoin China API error code requested
- The real volatility applied to the market basis of thinking about shushupengli trading ideas with pen
- 2.12 _D (()) Function and Timestamp