BRAHMASTRA también
El autor:¿ Qué pasa?, Fecha: 2022-05-13 14:39:00Las etiquetas:La WMA
En cualquier momento, verá hasta 4 líneas de tendencia en este script.
▶ Línea de tendencia que se une a los máximos del eje en tendencia alcista ▶ Línea de tendencia que se une a los mínimos del eje en tendencia alcista ▶ Línea de tendencia que se une a los máximos pivot en la tendencia bajista ▶ La línea de tendencia se une a los mínimos del eje en condiciones de tendencia bajista
La línea vieja permanecerá hasta que la nueva llegue del mismo tipo. Por lo tanto, todavía podrá ver las líneas de tendencia alta y baja de tendencia alcista para los instrumentos de tendencia bajista que se crearon hace mucho tiempo!! Además, las nuevas líneas de tendencia reemplazan a las viejas solo si son más fuertes (conectarse a más pivotes con menos desbordamiento)
Prueba posterior
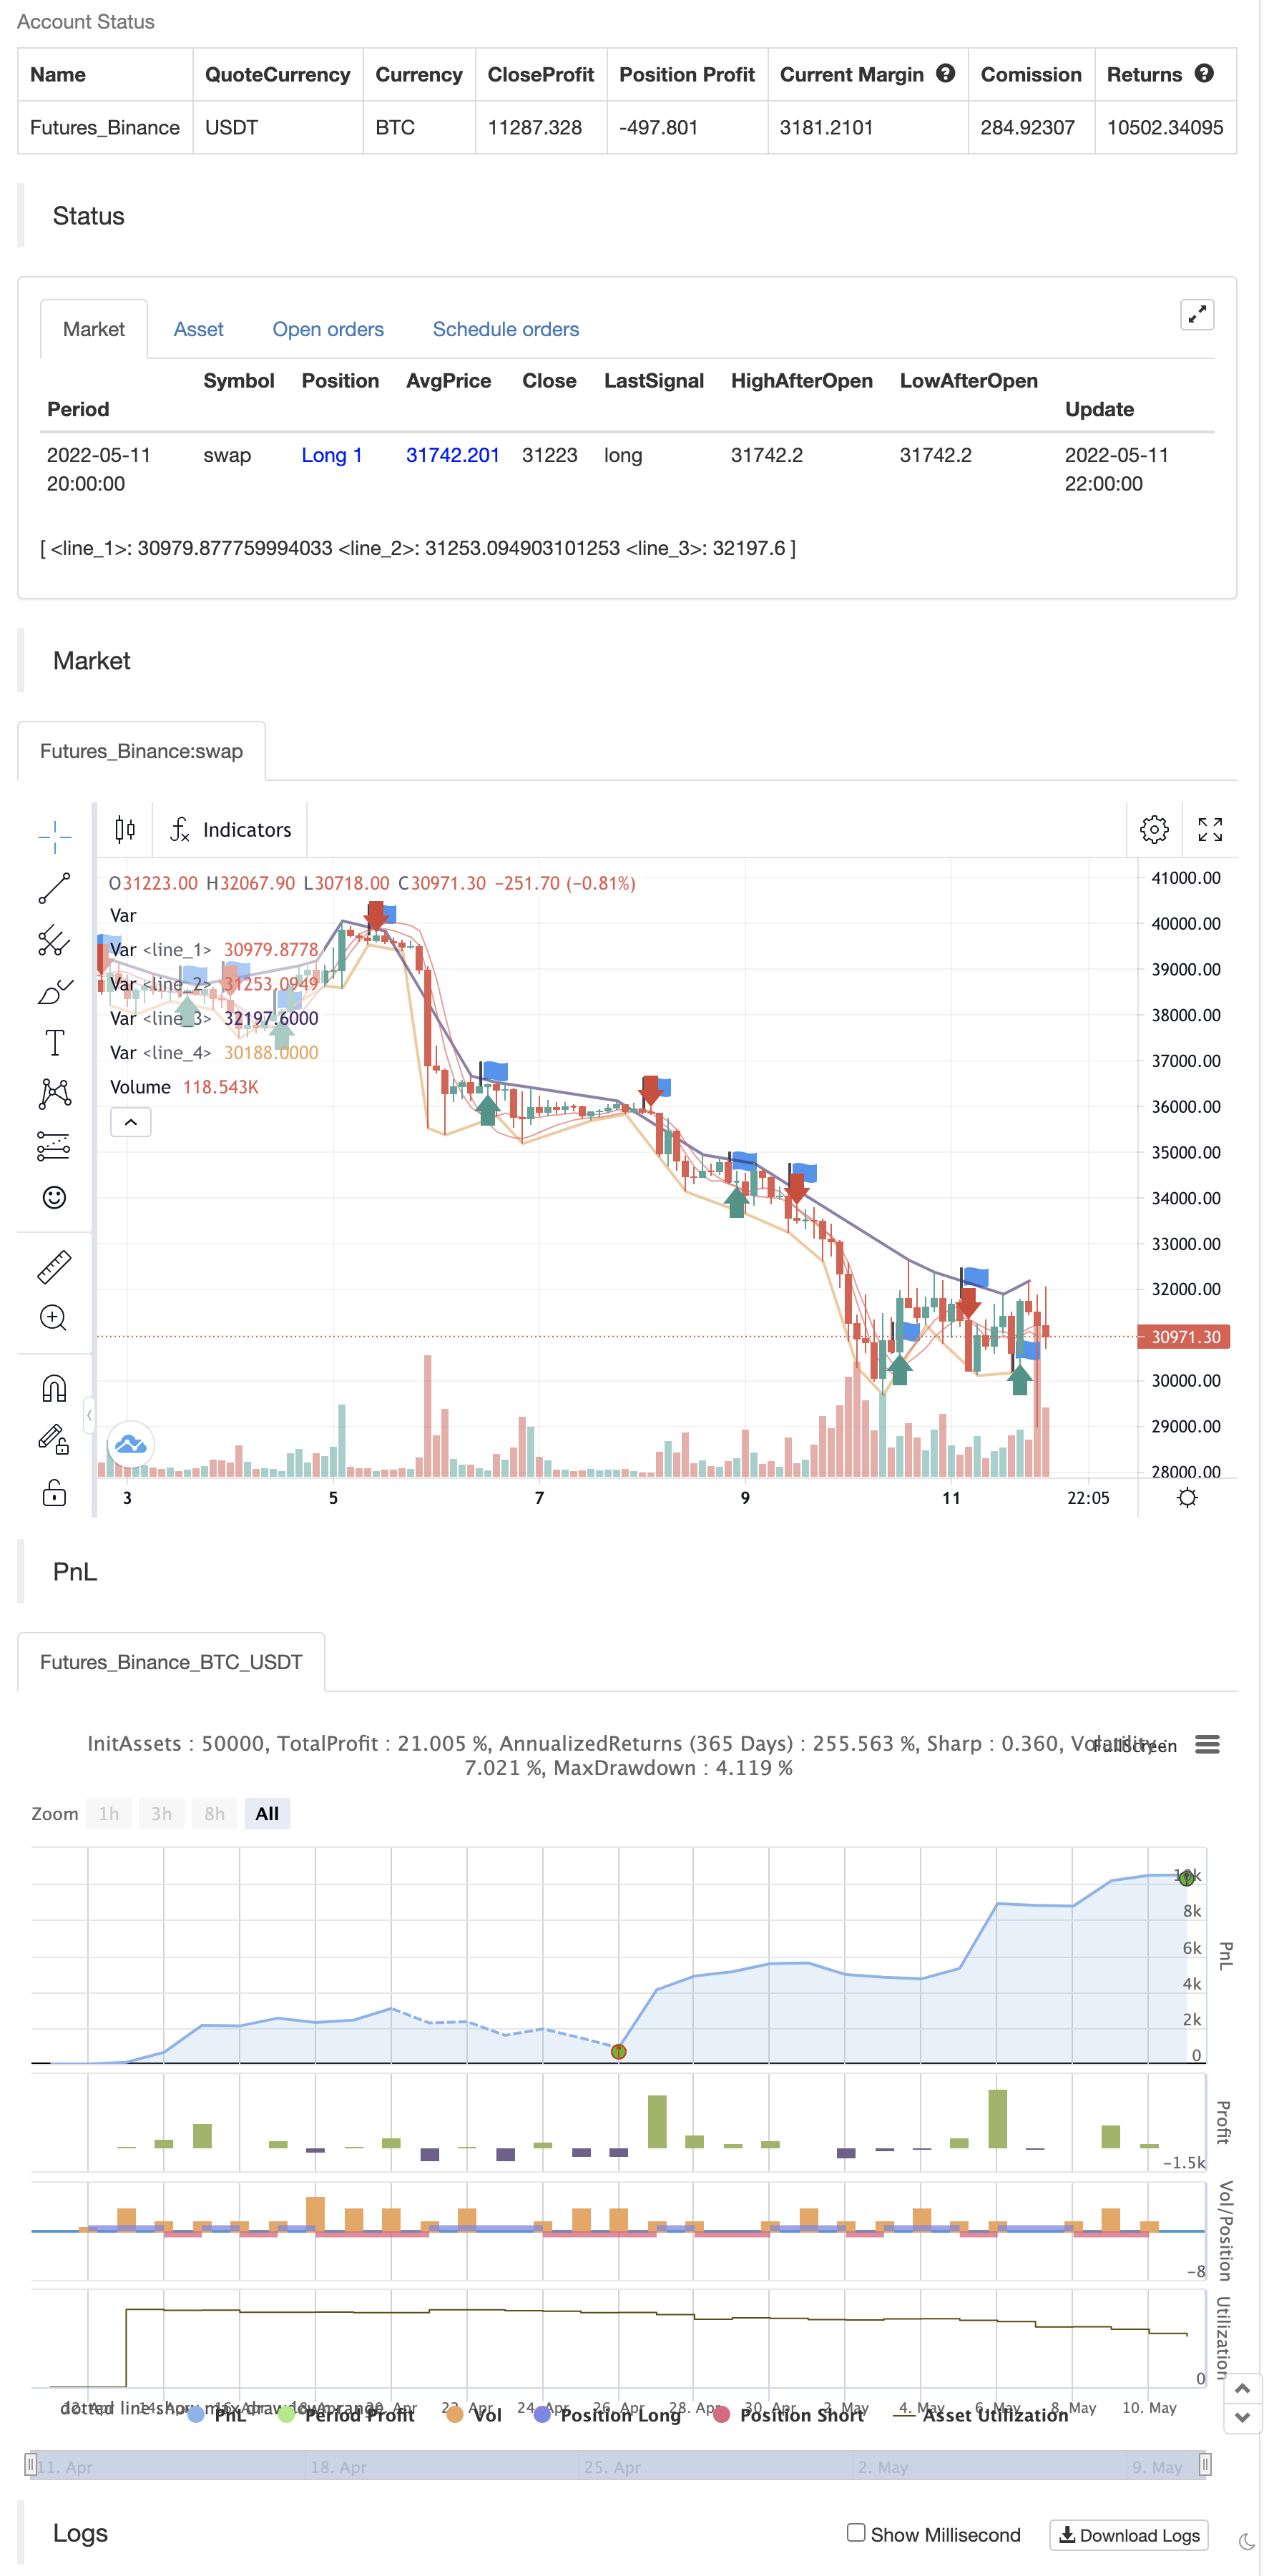
/*backtest
start: 2022-04-12 00:00:00
end: 2022-05-11 23:59:00
period: 2h
basePeriod: 15m
exchanges: [{"eid":"Futures_Binance","currency":"BTC_USDT"}]
*/

//@version=4
study("BRAHMASTRA", precision=2, overlay=true)
// compilation: capissimo

// This script utilizes two modules, Trendlines Module (by Joris Duyck) and HMA-Kahlman Trend Module.
// Trendlines module produces crossovers predictive of the next local trend.

//*** HMA-Kahlman Trend Module
price  = input(hl2,  "Price Data (hl2)")
hkmod  = input(true, "===HMA-Kahlman Trend Module===")
length = input(22,   "Lookback Window", minval=2)
k      = input(true, "Use Kahlman")
gain   = input(.7,   "Gain", minval=.0001, step=.01)
labels = input(true, "Show Labels?")
o      = input(true, "Use Offset")

hma(x, p) => wma((2 * wma(x, p / 2)) - wma(x, p), round(sqrt(p)))

hma3() => p = length/2, wma(wma(close, p/3)*3 - wma(close, p/2) - wma(close, p), p)

kahlman(x, g) =>
    kf = 0.0
    dk = x - nz(kf[1], x)
    smooth = nz(kf[1],x)+dk*sqrt(g*2)
    velo = 0.0
    velo := nz(velo[1],0) + (g*dk)
    kf := smooth+velo

a = k ? kahlman(hma(price, length), gain) : hma(price, length)
b = k ? kahlman(hma3(), gain) : hma3()
c = b > a ? color.lime : color.red
crossdn = a > b and a[1] < b[1]
crossup = b > a and b[1] < a[1]
ofs = o ? -1 : 0

fill(plot(a,color=c,linewidth=1,transp=75), plot(b,color=c,linewidth=1,transp=75), color=c, transp=55)
plotshape(labels and crossdn ? a : na, location=location.abovebar, style=shape.labeldown, color=color.red, size=size.tiny, text="S", textcolor=color.white, transp=0, offset=ofs)
plotshape(labels and crossup ? a : na, location=location.belowbar, style=shape.labelup, color=color.green, size=size.tiny, text="B", textcolor=color.white, transp=0, offset=ofs)

//*** Trendlines Module, see https://www.tradingview.com/script/mpeEgn5J-Trendlines-JD/
tlmod = input(true, "===Trendlines Module===")
l1    = input(2,    "Pivots Lookback Window", minval=1)

trendline(input_function, delay, only_up) => // Calculate line coordinates (Ax,Ay) - (Bx,By)
    var int Ax = 0, var int Bx = 0, var float By = 0.0, var float slope = 0.0
    Ay = fixnan(input_function)
    if change(Ay)!=0
        Ax := time[delay], By:= Ay[1], Bx := Ax[1]
        slope := ((Ay-By)/(Ax-Bx))
    else
        Ax := Ax[1], Bx := Bx[1], By := By[1]

    var line trendline=na, var int Axbis=0, var float Aybis=0.0, var bool xtend=true
    extension_time = 0
    Axbis := Ax + extension_time
    Aybis := (Ay + extension_time*slope)
    if tlmod and change(Ay)!=0
        line_color = slope*time<0?(only_up?na:color.red):(only_up?color.lime:na)
        if not na(line_color)
            trendline = line.new(Bx,By,Axbis, Aybis, xloc.bar_time, extend=xtend?extend.right:extend.none, color=line_color, style=line.style_dotted, width=1)
            line.delete(trendline[1])
    slope

pivot(len) =>
    high_point = pivothigh(high, len,len/2)
    low_point  = pivotlow(low, len,len/2)
    slope_high = trendline(high_point, len/2,false)
    slope_low  = trendline(low_point, len/2,true)
    [high_point, low_point, slope_high, slope_low]

[high_point1, low_point1, slope_high1, slope_low1] = pivot(l1)

color_high1 = slope_high1 * time<0 ? color.red : na
color_low1  = slope_low1  * time>0 ? color.lime : na
plot(tlmod ? high_point1 : na, color=color_high1, offset=-l1/2, linewidth=2)
plot(tlmod ? low_point1  : na, color=color_low1, offset=-l1/2, linewidth=2)


if crossup
    strategy.entry("Enter Long", strategy.long)
else if crossdn
    strategy.entry("Enter Short", strategy.short)
- Estrategia de negociación cuantitativa basada en la media móvil modificada del casco y Ichimoku Kinko Hyo
- Estrategia de negociación cuantitativa basada en medias móviles y bandas de Bollinger
- VWMA-ADX Momentum y estrategia larga de Bitcoin basada en tendencias
- El stock fácil
- Estrategia de escáner bajo cripto
- El valor de las operaciones de venta de valores de mercado se calculará en función de las operaciones de venta de valores.
- Divergencia de volumen
- Hull Moving Average Swing Trader (Tradador de movimiento de la media del casco)
- Estrategia de la suite del casco
- Maximizador de ganancias PMax
- Estrategia Swing Hull/rsi/EMA
- La base de datos de estrategias de seguimiento de tendencias fantasmas
- La trayectoria fantasma sigue la estrategia del archivo de negocios
- Las estrategias de seguimiento de tendencias fantasmales
- Oscilador de arco iris
- Ejemplo de dimensionamiento de la posición de la curva de renta variable
- Demo del gráfico de línea
- Estrategia de supertrend de pivote dinámico de Villa
- La súper tendencia de Crodl
- RSI por zdmre
- FTL - Filtro de rango X2 + EMA + UO
- Bandas de Mobo
- SAR + 3SMMA con SL y TP
- El SSS
- Plantilla de alertas de lanzamiento lunar [Indicador]
- HALFTREND + HEMA + SMA (Estrategia de la señal falsa)
- El índice de variación de las tasas de cambio de la media de las tasas de variación de las tasas de variación de las tasas de variación de las tasas de variación de las tasas de variación de las tasas de variación de las tasas de variación de las tasas de variación de las tasas de variación de las tasas de variación de las tasas de variación de las tasas de variación de las tasas de variación de las tasas de variación de las tasas de variación de las tasas de variación de las tasas de variación.
- RSI y BB y simultáneamente sobrevendido
- Las velas de Heikin Ashi
- Combo 2/20 EMA y filtro de banda
- La AEVM