Estrategia de seguimiento de tendencias con bandas de Bollinger de doble media móvil
Descripción general
Esta estrategia se basa en el doble promedio de la banda de Brin para tomar decisiones comerciales que siguen la tendencia. Utiliza la convergencia y la dispersión de la banda de Brin para determinar los cambios en la tendencia, compra cerca de la banda de Brin, vende cerca de la banda de Brin, realiza una compra baja y una venta alta, y se marcha a beneficio.
Principio de estrategia
Esta estrategia aplica al mismo tiempo las versiones de Brinbelt Simple y Brinbelt Aumentado.
La media de cálculo de SMA de las simples bandas de Brin con el precio de cierre, y la media de cálculo de EMA de las bandas de Brin con el precio de cierre.
Las órbitas superiores y inferiores se calculan a través de la diferencia estándar de ± N veces la de la órbita media.
La estrategia determina la tendencia en función de la distancia entre la banda de Brin y la banda descendente. Cuando la dispersión es menor que el umbral establecido, se indica que se está entrando en el rango de tendencia y se puede realizar una operación de seguimiento de tendencia.
En concreto, cuando el precio se acerca a la baja, compra más, y cuando se acerca a la cima, vende la posición cerrada. El modo de parada es el porcentaje de parada fijo, mientras que se puede activar el seguimiento de la parada.
El objetivo de ganancias depende de la opción de colocarse en un mercado cercano a la vía media o a la vía superior.
La estrategia también puede optar por vender solo si se asegura una ganancia para evitar pérdidas.
Análisis de las ventajas
La estrategia tiene las siguientes ventajas:
- La integración de la doble franja de bosque para mejorar la eficiencia de las decisiones
La aplicación de Brines simples y Brines mejorados permite comparar los efectos de los dos tipos de Brines, elegir la versión más óptima y mejorar la eficiencia de la toma de decisiones.
- La tendencia en el ancho de los canales de la banda de Brin
Cuando el corredor de la correa de Brin se estrecha, es decir, cuando se entra en una tendencia, la probabilidad de seguir la tendencia es mayor.
- La flexibilidad para detener los daños
El uso de un porcentaje fijo de stop loss para controlar las pérdidas individuales. También se puede elegir un stop en el medio de la vía o cerca de la vía superior, así como la activación de stop tracking para bloquear más ganancias.
- Mecanismos de protección para evitar pérdidas
La venta sólo puede evitar la expansión de las pérdidas si se asegura la rentabilidad.
Análisis de riesgos
La estrategia también tiene los siguientes riesgos:
- Riesgo de la retirada
Seguir una tendencia en el comercio conlleva un cierto riesgo de retroceso y la presión psicológica de sufrir pérdidas continuas.
- Riesgo de una conmoción
Cuando el corredor de la banda de Brin es más ancho, significa que el mercado puede entrar en una convulsión, en este momento la estrategia no funciona bien y se necesita suspender la negociación para esperar que la tendencia se vuelva a formar.
- El riesgo de que se desencadene el stop loss
Los paros porcentuales fijos pueden ser demasiado radicales y necesitan ser ajustados a paros más moderados como el parón ATR.
Dirección de optimización
La estrategia puede ser optimizada en los siguientes aspectos:
- Optimización de los parámetros de las bandas de Bryn
Se pueden probar diferentes parámetros de la media y el múltiplo de la diferencia estándar para encontrar la combinación de parámetros de la banda de Bryn más adecuada para diferentes mercados.
- En combinación con otros indicadores
Se puede utilizar para filtrar indicadores como MACD, KD, etc., basados en señales de la banda de Bryn, lo que reduce la volatilidad de los mercados.
- Optimización de las estrategias de stop loss
Se pueden probar diferentes formas de detener el movimiento, o optimizar el punto de parada en función de indicadores como la amplitud y el ATR.
- Optimización de la gestión de fondos
Optimizar la gestión de posiciones en cada operación y probar diferentes estrategias de reposición.
Resumir
Esta estrategia integra las ventajas de los indicadores de doble banda de Brin, en función de la amplitud de los canales de Brin para juzgar el grado de tendencia, para realizar operaciones de seguimiento de baja absorción y alto lanzamiento durante la tendencia. Al mismo tiempo, se establece un mecanismo científico de parada de pérdidas para controlar el riesgo. La estrategia puede mejorar aún más la estabilidad mediante la optimización de parámetros y la combinación de filtros de otros indicadores.
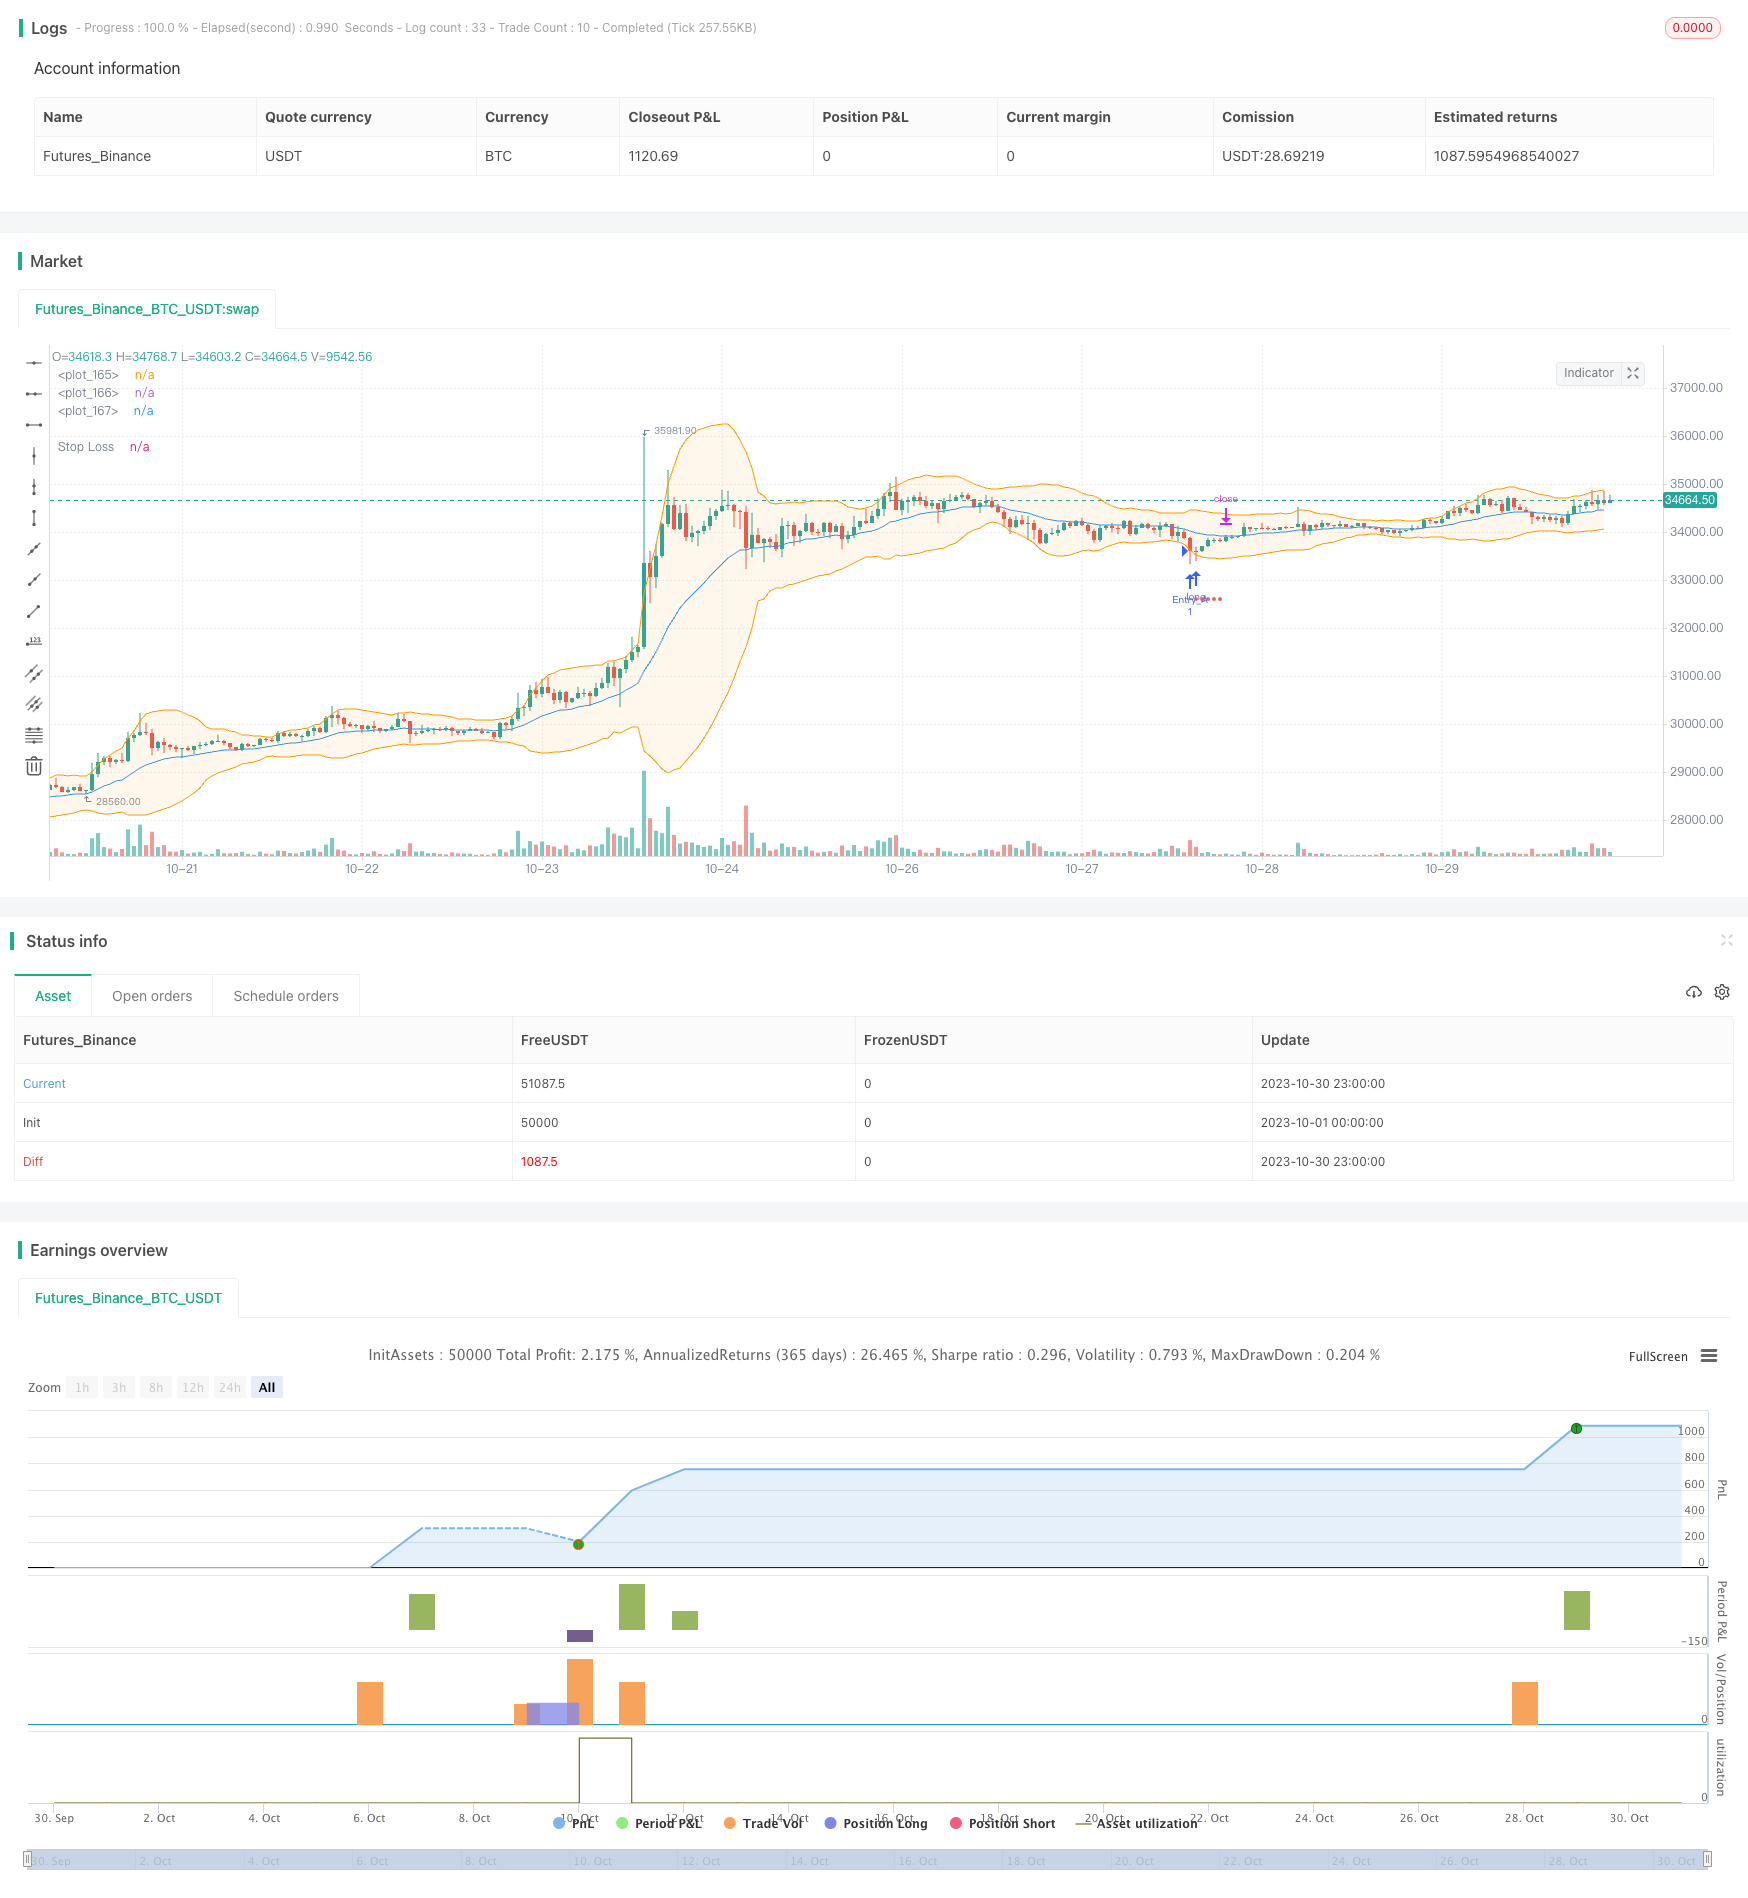
/*backtest
start: 2023-10-01 00:00:00
end: 2023-10-31 00:00:00
period: 1h
basePeriod: 15m
exchanges: [{"eid":"Futures_Binance","currency":"BTC_USDT"}]
*/

// This source code is subject to the terms of the Mozilla Public License 2.0 at https://mozilla.org/MPL/2.0/
// © JCGMarkets

//@version=4
strategy("B.Bands | Augmented | Intra-range | Long-Only", shorttitle = "BB|A|IR|L", initial_capital=5000, commission_value=0.075, slippage = 1, overlay = true)

//Technical Indicators Data
show_simp   = input(false, title="Trade on Simple Bollinger Bands ", type= input.bool, group="Select Strategy System")
show_augm   = input(true, title="Trade on Augmented Bollinger Bands", type= input.bool, group="Select Strategy System")
periods     = input(20, title="Periods for Moving Average", type =input.integer, minval = 2, step = 1, group="Technical Inputs")
std         = input(2, title="Std", type = input.float, minval=0.1 , step = 0.1, group="Technical Inputs")

// Strategy data
max_spread_bb   = input(20000.0, title="Max Spread Tolerance Beetween Bands", type=input.float, step=0.1, group="Strategy Inputs")
entry_source    = input(close, title="Entry data source", type=input.source, group="Strategy Inputs")
exit_source     = input(high, title="Exit data source", type=input.source, group="Strategy Inputs")
take_profit     = input("middle", title = "Profit to band:", options = ["middle", "opposite"], group="Strategy Inputs")
stop_loss       = input(3.00, title="Stop Loss %", type=input.float, step=0.05, group="Strategy Inputs")
trailing        = input(false, title="Activate trailing stop?", type = input.bool, group="Strategy Inputs")
stop_perc       = input(6.00, title="Trailing %", type=input.float, step=0.125, group="Strategy Inputs") * 0.01
sell_profit     = input(false, title="Only sell in profit (Stop Loss still active) ", type= input.bool, group="Strategy Inputs")


var SL = 0.0
var SLT= 0.0


//Simple BB Calculation -> adapt if needed with different std for upper-lower, sma-ema, etc
middle_sim = sma(close, periods)

//Augmented BB Calculation -> adapt if needed with different std for upper lower, etc
middle_augm  = ema(close, periods)
middle_upp = ema(high, periods)
middle_low = ema(low, periods)

//Multiplier
dev      = stdev(close, periods) * std

//Upper & Lower Bands
upper = (middle_sim + dev)
lower = (middle_sim - dev)

//Augmented Bands
upper_augm = (middle_upp + dev)
lower_augm = (middle_low - dev)

//Bands Spread
spread   = upper - lower
spread_augm   = upper_augm - lower_augm

//From date
filter_from    =   input(  true,    title="===> From", group="Date Control")
from_y         =   input(  2010,    title = "from year", group="Date Control")
from_m         =   input(     1,    title = "from month", minval =1, maxval=12, group="Date Control")
from_d         =   input(     1,    title = "from day",  minval=1, maxval=31, group="Date Control")

//To date
filter_to   =    input( true,   title="===> To", group="Date Control")
to_y        =    input( 2030,   title = "To year", group="Date Control")
to_m        =    input(    1,   title = "To month", minval =1, maxval=12, group="Date Control")
to_d        =    input(    1,  title = "To day",  minval=1, maxval=31, group="Date Control")

// Date Condition
In_date() =>  true

in_position = strategy.position_size > 0

// Trailing stop
SLT := if in_position and In_date()
    stop_inicial = entry_source * (1 - stop_perc)
    max(stop_inicial, SLT[1])
else
    0

slts = (low <= SLT) and (trailing == true)


//Essential Trade logics
entry_long = (entry_source <= lower) and (spread < max_spread_bb)
entry_long_augm = (entry_source <= lower_augm) and (spread_augm < max_spread_bb)

// Simple Bollinger Conditions

if (not in_position and show_simp and In_date())
    if entry_long
        // Trigger buy order
        position_size = round( strategy.equity / close ) // All available equity for this strategy example
        strategy.entry("Entry", strategy.long, qty = position_size )
        SL := close * (1 - (stop_loss / 100)) // You could determine wether or not implement stop loss with bool input and if condition here.


if in_position and show_simp and not sell_profit and In_date()
    //Exits if not sell in profit
    if take_profit == "middle"
        strategy.exit("Target", "Entry", limit = middle_sim, stop = SL, comment="Exit")
    if take_profit == "opposite"
        strategy.exit("Target", "Entry", limit = upper, stop = SL, comment="Exit")

if in_position and show_simp and sell_profit and In_date()
    //Exits if sell in profit
    if take_profit == "middle"
        strategy.exit("Target", "Entry", limit = (strategy.openprofit > 0 ? middle_sim: na), stop = SL, comment="Exit")
    if take_profit == "opposite"
        strategy.exit("Target", "Entry", limit = (strategy.openprofit > 0 ? upper: na), stop = SL, comment="Exit")


if in_position and show_simp and slts and In_date()
    //Trailing activation
    strategy.close("Entry", comment="SLT")

if not In_date()
    //Exit due out of date range
    strategy.close("Entry", comment="Out of date range")


// Augmented Bollinger Conditions

if (not in_position and show_augm and In_date())
    if entry_long_augm
        // Trigger buy order
        position_size = round( strategy.equity / close )
        strategy.entry("Entry_A", strategy.long, qty = position_size )
        SL := close * (1 - (stop_loss / 100) )

if in_position and show_augm and not sell_profit and In_date()
    //Exits and not sell in profit
    if take_profit == "middle"
        strategy.exit("Target", "Entry_A", limit = middle_augm, stop = SL, comment="Exit")
    if take_profit == "opposite"
        strategy.exit("Target", "Entry_A", limit = upper_augm, stop = SL, comment="Exit")


if in_position and show_augm and sell_profit and In_date()
    //Exit only in profit
    if take_profit == "middle"
        strategy.exit("Target", "Entry_A", limit = (strategy.openprofit > 0 ? middle_augm:na), stop = SL, comment="Exit")
    if take_profit == "opposite"
        strategy.exit("Target", "Entry_A", limit = (strategy.openprofit > 0 ? upper_augm: na) , stop = SL, comment="Exit")


if in_position  and show_augm and slts and In_date()
    //Trigger trailing
    strategy.close("Entry_A", comment="SLT")

if not In_date()
    //Out of date trigger
    strategy.close("Entry_A", comment= "Out of date range")


// Plotting

plot(in_position ? SL > 0 ? SL : na : na , style = plot.style_circles, color = color.red, title = "Stop Loss")
plot(in_position ? trailing ? SLT > 0 ? SLT : na : na : na , style = plot.style_circles, color = color.blue, title = "Trailing Stop" )

s = plot(show_simp ? upper : na , color = color.aqua)
plot(show_simp ? middle_sim : na , color=color.red)
i = plot(show_simp ? lower : na , color = color.aqua)
fill(s,i, color=color.new(color.aqua,90))


plot(show_augm ? middle_augm : na , color=color.blue)
s_a = plot( show_augm ? upper_augm : na, color=color.orange)
i_a = plot( show_augm ? lower_augm : na, color= color.orange)
fill(s_a,i_a, color=color.new(color.orange, 90))