
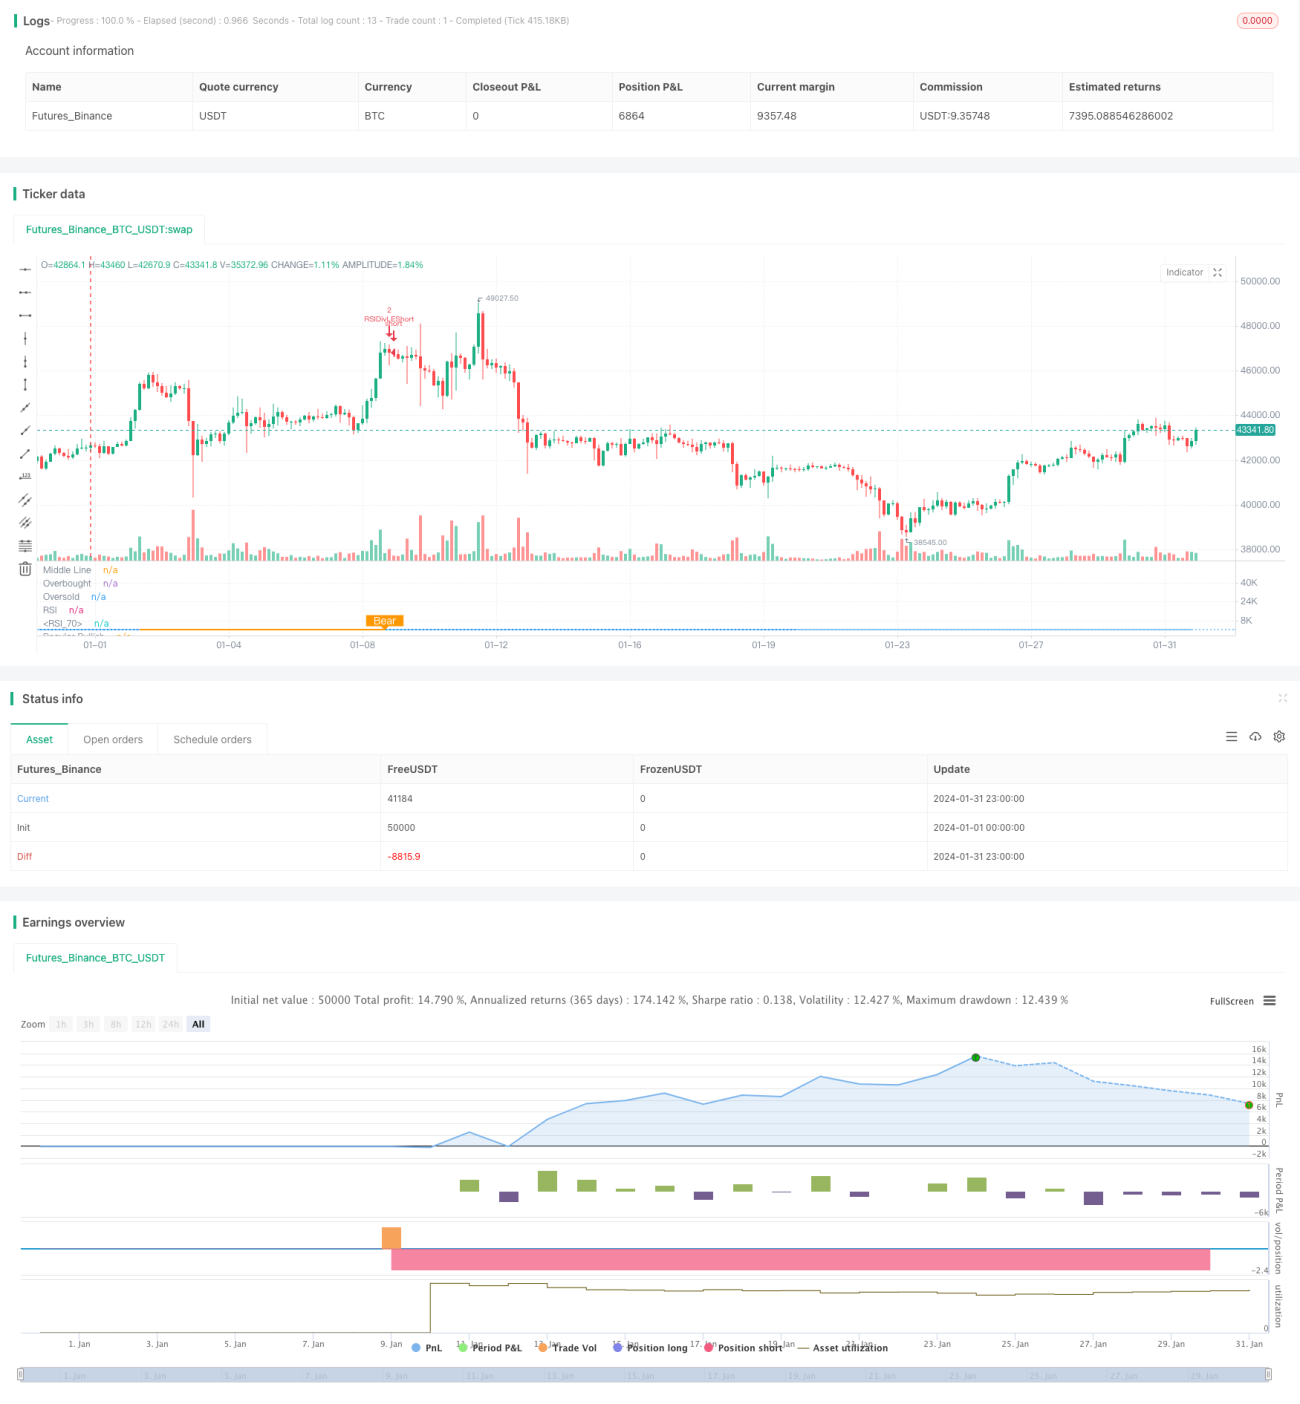
La estrategia utiliza el indicador RSI para identificar el fenómeno de la separación de los vacíos y tomar decisiones comerciales en función de ello. Su idea central es que cuando el precio tiene una nueva baja pero el indicador RSI tiene una nueva alta, se forma una señal de separación de los vacíos, lo que indica que se ha formado el fondo, hacer más; cuando el precio tiene una nueva alta pero el indicador RSI tiene una nueva baja, se forma una señal de separación de los vacíos, lo que indica que se ha formado la cima, hacer vacío.
La estrategia utiliza principalmente el indicador RSI para identificar el fenómeno de separación múltiple entre el precio y el RSI. Los métodos específicos son los siguientes:
Al identificar la separación entre el precio y el RSI, se puede capturar el punto de inflexión en el movimiento de los precios con anticipación y tomar decisiones comerciales en función de ello.
La estrategia tiene las siguientes ventajas:
La estrategia también tiene ciertos riesgos:
Un desvío en el RSI no necesariamente indica una reversión inmediata del precio, y puede haber un diferencial de tiempo, lo que lleva al riesgo de que el stop se active. La solución es relajar adecuadamente el stop y dar al precio suficiente tiempo para confirmar la señal de separación.
El riesgo también aumenta si la separación persiste por un tiempo prolongado. La solución es combinar un indicador RSI de línea diaria o de circunferencia a más largo plazo como condición de filtración.
La separación es demasiado pequeña para confirmar un cambio de tendencia y se necesita un aumento apropiado del intervalo de retroceso para buscar una separación RSI más evidente.
La estrategia también puede ser optimizada en las siguientes direcciones:
Optimización de los parámetros RSI para encontrar la mejor combinación de parámetros
Intentar otros indicadores técnicos como MACD, KD, etc. para identificar el fenómeno de la separación por vacío
Aumentar las condiciones de filtración adecuadas para los períodos de crisis y evitar el aumento de las transacciones erróneas durante los períodos de crisis
Busca la mejor combinación de señales con el RSI en más períodos de tiempo
La estrategia de negociación de separación múltiple de espacios RSI identifica el fenómeno de separación múltiple entre el indicador RSI y el precio, juzga el punto de inflexión de la evolución del precio y establece una señal de negociación. La estrategia es sencilla y práctica, puede mejorar aún más la probabilidad de ganancias mediante la optimización de la configuración de los parámetros y el aumento de las condiciones de filtración. En general, la estrategia de separación múltiple de espacios RSI es una estrategia de negociación cuantitativa muy efectiva.
/*backtest
start: 2024-01-01 00:00:00
end: 2024-01-31 23:59:59
period: 3h
basePeriod: 15m
exchanges: [{"eid":"Futures_Binance","currency":"BTC_USDT"}]
*/
// This source code is subject to the terms of the Mozilla Public License 2.0 at https://mozilla.org/MPL/2.0/
// © Nextep
//@version=4
strategy(title="RSI top&bottom destroy ", overlay=false, pyramiding=4, default_qty_value=2, default_qty_type=strategy.fixed, initial_capital=10000, currency=currency.USD)
// INPUT Settings --------------------------------------------------------------------------------------------------------------------------------------------------
len = input(title="RSI Period", minval=1, defval=13)
src = input(title="RSI Source", defval=close)
// defining the lookback range for shorts
lbRshort = input(title="Short Lookback Right", defval=1)
lbLshort = input(title="Short Lookback Left", defval=47)
// defining the lookback range for longs
lbRlong = input(title="Long Lookback Right", defval=2)
lbLlong = input(title="Long Lookback Left", defval=14)
rangeUpper = input(title="Max of Lookback Range", defval=400)
rangeLower = input(title="Min of Lookback Range", defval=1)
// take profit levels
takeProfitLongRSILevel = input(title="Take Profit at RSI Level", minval=0, defval=75)
takeProfitShortRSILevel = input(title="Take Profit for Short at RSI Level", minval=0, defval=25)
// Stop loss settings
longStopLossType = input("PERC", title="Long Stop Loss Type", options=['ATR','PERC', 'FIB', 'NONE'])
shortStopLossType = input("PERC", title="Short Stop Loss Type", options=['ATR','PERC', 'FIB', 'NONE'])
longStopLossValue = input(title="Long Stop Loss Value", defval=14, minval=0)
shortStopLossValue = input(title="Short Stop Loss Value", defval=5, minval=-10)
// PLOTTING THE CHARTS --------------------------------------------------------------------------------------------------------------------------------------------------
// Plotting the Divergence
plotBull = input(title="Plot Bullish", defval=true)
plotBear = input(title="Plot Bearish", defval=true)
bearColor = color.orange
bullColor = color.green
textColor = color.white
noneColor = color.new(color.white, 100)
// Adding the RSI oscillator
osc = rsi(src, len)
ma_len = 14 // Length for the moving average
rsi_ma = sma(osc, ma_len) // Calculate the moving average of RSI
plot(osc, title="RSI", linewidth=1, color=color.purple)
plot(rsi_ma, color=color.blue, title="RSI MA") // Plot the RSI MA
// Adding the lines of the RSI oscillator
plot(osc, title="RSI", linewidth=1, color=color.purple)
hline(50, title="Middle Line", linestyle=hline.style_dotted)
obLevel = hline(75, title="Overbought", linestyle=hline.style_dotted)
osLevel = hline(25, title="Oversold", linestyle=hline.style_dotted)
fill(obLevel, osLevel, title="Background", color=color.purple, transp=80)
atrLength = input(14, title="ATR Length (for Trailing stop loss)")
atrMultiplier = input(3.5, title="ATR Multiplier (for Trailing stop loss)")
// RSI PIVOTS --------------------------------------------------------------------------------------------------------------------------------------------------
// Define a condition for RSI pivot low
isFirstPivotLowlong = not na(pivotlow(osc, lbLlong, lbRlong))
// Define a condition for RSI pivot high
isFirstPivotHighlong = not na(pivothigh(osc, lbLlong, lbRlong))
// Define a condition for the first RSI value
firstPivotRSIValuelong = isFirstPivotLowlong ? osc[lbRlong] : na
// Define a condition for the second RSI value
secondPivotRSIValuelong = isFirstPivotLowlong ? valuewhen(isFirstPivotLowlong, osc[lbRlong], 1) : na
// Define a condition for RSI pivot low
isFirstPivotLowshort = not na(pivotlow(osc, lbLshort, lbRshort))
// Define a condition for RSI pivot high
isFirstPivotHighshort = not na(pivothigh(osc, lbLshort, lbRshort))
// Define a condition for the first RSI value
firstPivotRSIValueshort = isFirstPivotLowshort ? osc[lbRshort] : na
// Define a condition for the second RSI value
secondPivotRSIValueshort = isFirstPivotLowshort ? valuewhen(isFirstPivotLowshort, osc[lbRshort], 1) : na
_inRange(cond) =>
bars = barssince(cond == true)
rangeLower <= bars and bars <= rangeUpper
// ADDITIONAL ENTRY CRITERIA --------------------------------------------------------------------------------------------------------------------------------------------------
// RSI crosses RSI MA up by more than 2 points and subsequently down
rsiUpCross = crossover(osc, rsi_ma + 1)
rsiDownCross = crossunder(osc, rsi_ma - 1)
// Calculate the daily RSI
rsiDaily = security(syminfo.ticker, "D", rsi(src, 14))
// BULLISH CONDITIONS --------------------------------------------------------------------------------------------------------------------------------------------------
// LOWER LOW PRICE & HIGHER LOW OSC
// Price: Lower Low
priceLL = na(isFirstPivotLowlong[1]) ? false : (low[lbRlong] < valuewhen(isFirstPivotLowlong, low[lbRlong], 1))
// Osc: Higher Low
oscHL = na(isFirstPivotLowlong[1]) ? false : (osc[lbRlong] > valuewhen(isFirstPivotLowlong, osc[lbRlong], 1) and _inRange(isFirstPivotLowlong[1]))
// BULLISH PLOT
bullCond = plotBull and priceLL and oscHL and isFirstPivotLowlong
plot(
isFirstPivotLowlong ? osc[lbRlong] : na,
offset=-lbRlong,
title="Regular Bullish",
linewidth=2,
color=(bullCond ? bullColor : noneColor),
transp=0
)
plotshape(
bullCond ? osc[lbRlong] : na,
offset=-lbRlong,
title="Regular Bullish Label",
text=" Bull ",
style=shape.labelup,
location=location.absolute,
color=bullColor,
textcolor=textColor,
transp=0
)
// BEARISH CONDITIONS --------------------------------------------------------------------------------------------------------------------------------------------------
// HIGHER HIGH PRICE & LOWER LOW OSC
// Osc: Lower High
oscLH = na(isFirstPivotHighshort[1]) ? false : (osc[lbRshort] < valuewhen(isFirstPivotHighshort, osc[lbRshort], 1) and _inRange(isFirstPivotHighshort[1]))
// Price: Higher High
priceHH = na(isFirstPivotHighshort[1]) ? false : (high[lbRshort] > valuewhen(isFirstPivotHighshort, high[lbRshort], 1))
// BEARISH PLOT
bearCond = plotBear and priceHH and oscLH and isFirstPivotHighshort
plot(
isFirstPivotHighshort ? osc[lbRshort] : na,
offset=-lbRshort,
title="Regular Bearish",
linewidth=2,
color=(bearCond ? bearColor : noneColor),
transp=0
)
plotshape(
bearCond ? osc[lbRshort] : na,
offset=-lbRshort,
title="Regular Bearish Label",
text=" Bear ",
style=shape.labeldown,
location=location.absolute,
color=bearColor,
textcolor=textColor,
transp=0
)
// ENTRY CONDITIONS --------------------------------------------------------------------------------------------------------------------------------------------------
longCondition = false
shortCondition = false
// Entry Conditions
longCondition := bullCond
shortCondition := bearCond
// Conditions to prevent entering trades based on daily RSI
longCondition := longCondition and rsiDaily >= 23
shortCondition := shortCondition and rsiDaily <= 80
// STOPLOSS CONDITIONS --------------------------------------------------------------------------------------------------------------------------------------------------
// Stoploss Conditions
long_sl_val =
longStopLossType == "ATR" ? longStopLossValue * atr(atrLength)
: longStopLossType == "PERC" ? close * longStopLossValue / 100 : 0.00
long_trailing_sl = 0.0
long_trailing_sl := strategy.position_size >= 1 ? max(low - long_sl_val, nz(long_trailing_sl[1])) : na
// Calculate Trailing Stop Loss for Short Entries
short_sl_val =
shortStopLossType == "ATR" ? 1 - shortStopLossValue * atr(atrLength)
: shortStopLossType == "PERC" ? close * (shortStopLossValue / 100) : 0.00 //PERC = shortstoplossvalue = -21300 * 5 / 100 = -1065
short_trailing_sl = 0.0
short_trailing_sl := strategy.position_size <= -1 ? max(high + short_sl_val, nz(short_trailing_sl[1])) : na
// RSI STOP CONDITION
rsiStopShort = (strategy.position_avg_price != 0.0 and close <= strategy.position_avg_price * 0.90) or (strategy.position_avg_price != 0.0 and rsi(src, 14) >= 75)
rsiStopLong = (strategy.position_avg_price != 0.0 and close >= strategy.position_avg_price * 1.10) or (strategy.position_avg_price != 0.0 and rsi(src, 14) <= 25)
// LONG CONDITIONS --------------------------------------------------------------------------------------------------------------------------------------------------
strategy.entry(id="RSIDivLELong", long=true, when=longCondition)
strategy.entry(id="RSIDivLEShort", long=false, when=shortCondition)
// Close Conditions
shortCloseCondition = bullCond // or cross(osc, takeProfitShortRSILevel)
strategy.close(id="RSIDivLEShort", comment="Close All="+tostring(-close + strategy.position_avg_price, "####.##"), when=abs(strategy.position_size) <= -1 and shortStopLossType == "NONE" and shortCloseCondition )
strategy.close(id="RSIDivLEShort", comment="TSL="+tostring(-close + strategy.position_avg_price, "####.##"), when=abs(strategy.position_size) >= -1 and ((shortStopLossType == "PERC" or shortStopLossType == "ATR") and cross(short_trailing_sl,high))) // or rsiStopShort)// or rsiStopShort)
longCloseCondition = bearCond
strategy.close(id="RSIDivLELong", comment="Close All="+tostring(close - strategy.position_avg_price, "####.##"), when=abs(strategy.position_size) >= 1 and longStopLossType == "NONE" and longCloseCondition)
strategy.close(id="RSIDivLELong", comment="TSL="+tostring(close - strategy.position_avg_price, "####.##"), when=abs(strategy.position_size) >= 1 and ((longStopLossType == "PERC" or longStopLossType == "ATR") and cross(long_trailing_sl,low))) //or rsiStopLong