Modèles d'altitude et de baisse et de bougies
Auteur:ChaoZhang est là., Date: 2022-05-07 21h12h40Les étiquettes:haussièrebaissier
Ce script étiquette les hauts et les bas de swing ainsi que le modèle de bougie qui s'est produit à ce point précis. Le script peut détecter les 6 modèles de bougie suivants: marteau, marteau inverse, engulfement haussier, homme pendu, étoile filante et engulfement baissier.
Les notations HH, HL, LH et LL que vous pouvez voir sur les étiquettes sont définies comme suit:
Plus haut, plus haut. HL: plus bas. LH: bas élevé LL: bas bas
Réglage
Longueur: Sensibilité de la détection de l'oscillation haute/basse, les valeurs inférieures renvoyant le maximum/minimum des variations de prix à court terme.
Utilisation et détails
Il peut être intéressant de voir si un haut ou un bas est associé à un motif de bougie spécifique, cela nous permet d'étudier le potentiel d'un tel motif pour indiquer un renversement.
Veuillez noter que les étiquettes sont décalées et apparaîtront plus tard en temps réel, de sorte que cet indicateur n'est pas destiné à détecter les sommets/fond en temps réel.
Des valeurs de longueur plus élevées peuvent renvoyer des erreurs.
test de retour
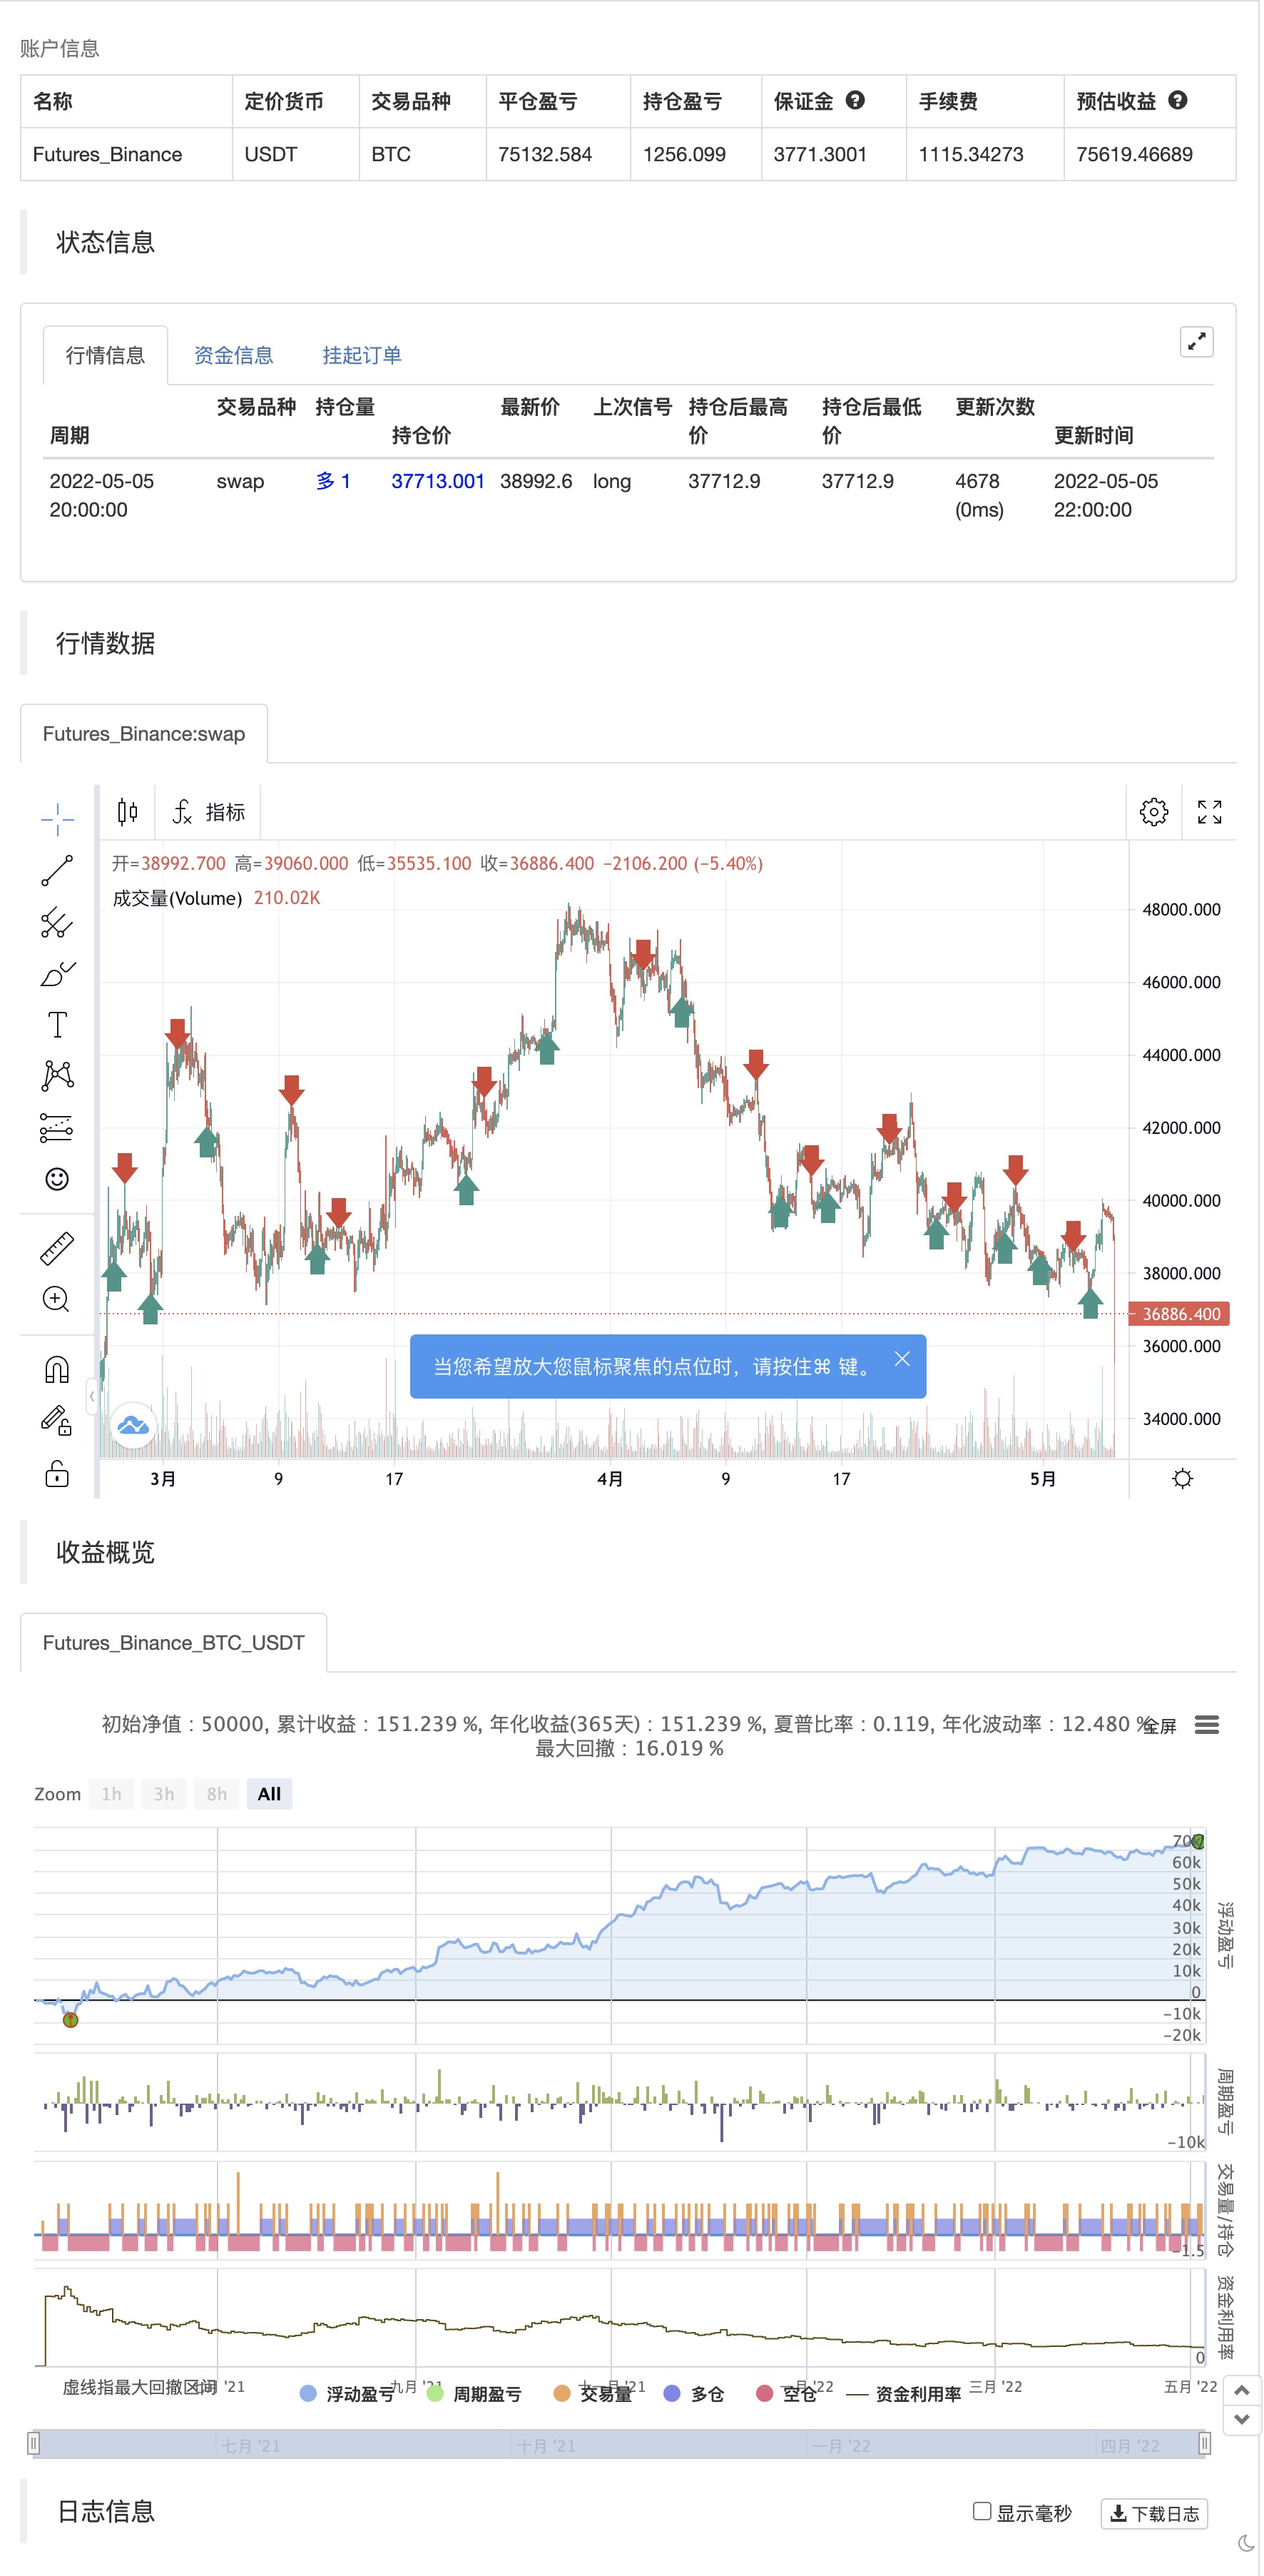
/*backtest
start: 2021-05-06 00:00:00
end: 2022-05-05 23:59:00
period: 2h
basePeriod: 15m
exchanges: [{"eid":"Futures_Binance","currency":"BTC_USDT"}]
*/

// This work is licensed under a Attribution-NonCommercial-ShareAlike 4.0 International (CC BY-NC-SA 4.0) https://creativecommons.org/licenses/by-nc-sa/4.0/
// © LuxAlgo

//@version=4
study("Swing Highs/Lows & Candle Patterns",overlay=true)
length = input(21)
//------------------------------------------------------------------------------
o = open[length],h = high[length]
l = low[length],c = close[length]
//------------------------------------------------------------------------------
ph = pivothigh(close,length,length)
pl = pivotlow(open,length,length)
valH = valuewhen(ph,c,0)
valL = valuewhen(pl,c,0)
valpH = valuewhen(ph,c,1)
valpL = valuewhen(pl,c,1)
//------------------------------------------------------------------------------
d = abs(c - o)
hammer = pl and min(o,c) - l > d and h - max(c,o) < d
ihammer = pl and h - max(c,o) > d and min(c,o) - l < d
bulleng = c > o and c[1] < o[1] and c > o[1] and o < c[1]
hanging = ph and min(c,o) - l > d and h - max(o,c) < d
shooting = ph and h - max(o,c) > d and min(c,o) - l < d
beareng = c > o and c[1] < o[1] and c > o[1] and o < c[1]
//------------------------------------------------------------------------------
//Descriptions
//------------------------------------------------------------------------------
hammer_ = "The hammer candlestick pattern is formed of a short body with a long lower wick, and is found at the bottom of a downward trend."
  + "\n" + "\n A hammer shows that although there were selling pressures during the day, ultimately a strong buying pressure drove the price back up."
ihammer_ = "The inverted hammer is a similar pattern than the hammer pattern. The only difference being that the upper wick is long, while the lower wick is short."
  + "\n" + "\n It indicates a buying pressure, followed by a selling pressure that was not strong enough to drive the market price down. The inverse hammer suggests that buyers will soon have control of the market."
bulleng_ = "The bullish engulfing pattern is formed of two candlesticks. The first candle is a short red body that is completely engulfed by a larger green candle"
  + "\n" + "\n Though the second day opens lower than the first, the bullish market pushes the price up, culminating in an obvious win for buyers"
hanging_ = "The hanging man is the bearish equivalent of a hammer; it has the same shape but forms at the end of an uptrend."
  + "\n" + "It indicates that there was a significant sell-off during the day, but that buyers were able to push the price up again. The large sell-off is often seen as an indication that the bulls are losing control of the market."
shotting_ = "The shooting star is the same shape as the inverted hammer, but is formed in an uptrend: it has a small lower body, and a long upper wick."
  + "\n" + "Usually, the market will gap slightly higher on opening and rally to an intra-day high before closing at a price just above the open – like a star falling to the ground."
beareng_ = "A bearish engulfing pattern occurs at the end of an uptrend. The first candle has a small green body that is engulfed by a subsequent long red candle."
  + "\n" + "It signifies a peak or slowdown of price movement, and is a sign of an impending market downturn. The lower the second candle goes, the more significant the trend is likely to be."
//------------------------------------------------------------------------------
n = bar_index
label lbl = na
H = valH > valpH ? "HH" : valH < valpH ? "LH" : na
L = valL < valpL ? "LL" : valL > valpL ? "HL" : na
txt = hammer ? "Hammer" : ihammer ? "Inverse Hammer" :
  bulleng ? "Bullish Engulfing" : hanging ? "Hanging Man" :
  shooting ? "Shooting Star" : beareng ? "Bearish Engulfing" : "None"
des = hammer ? hammer_ : ihammer ? ihammer_ :
  bulleng ? bulleng_ : hanging ? hanging_ :
  shooting ? shotting_ : beareng ? beareng_ : ""

//------------------------------------------------------------------------------
if ph
    strategy.entry("Enter Long", strategy.long)
else if pl
    strategy.entry("Enter Short", strategy.short)
- Fractal brisé: le rêve brisé de quelqu'un est votre profit!
- Stratégie de l'appareil photo ZigZag V4.1
- Indicateur de configuration de démarrage
- Des bougies engloutissantes
- Dépassement du support-résistance
- RSI MTF et stratégie STOCH
- jma + dwma par grains multicolores
- Moyenne mobile EMA/SMA couleur
- négociation sur plusieurs délais
- RSI par zdmre
- Le MACD magique
- Z Score avec des signaux
- La stratégie de fluctuation facile de Shinto en version en pin
- 3EMA + Boullinger + PIVOT
- Baguette à base de grains multiples
- La machine à meuler
- Indicateur d'inversion de K I
- Des bougies engloutissantes
- L' empereur est incapable de
- Points de retournement de Demark
- TMA surchargée
- La stratégie MACD + SMA 200
- Système de tir à la fronde CM
- Bollinger + RSI, stratégie double v1.1
- Stratégie des bandes de Bollinger
- Traqueur de tendance optimisé
- Retours mensuels dans les stratégies PineScript
- ADX et DI pour v4
- MacD Indicateur personnalisé - Cadre de temps multiples + Toutes les options disponibles!
- Indicateur: oscillateur de tendance d'onde