AMACD - Divergence de convergence de toutes les moyennes mobiles
Auteur:ChaoZhang est là., Date: 2022-05-10 15h38 et 12hLes étiquettes:Le taux d'intérêtSMA
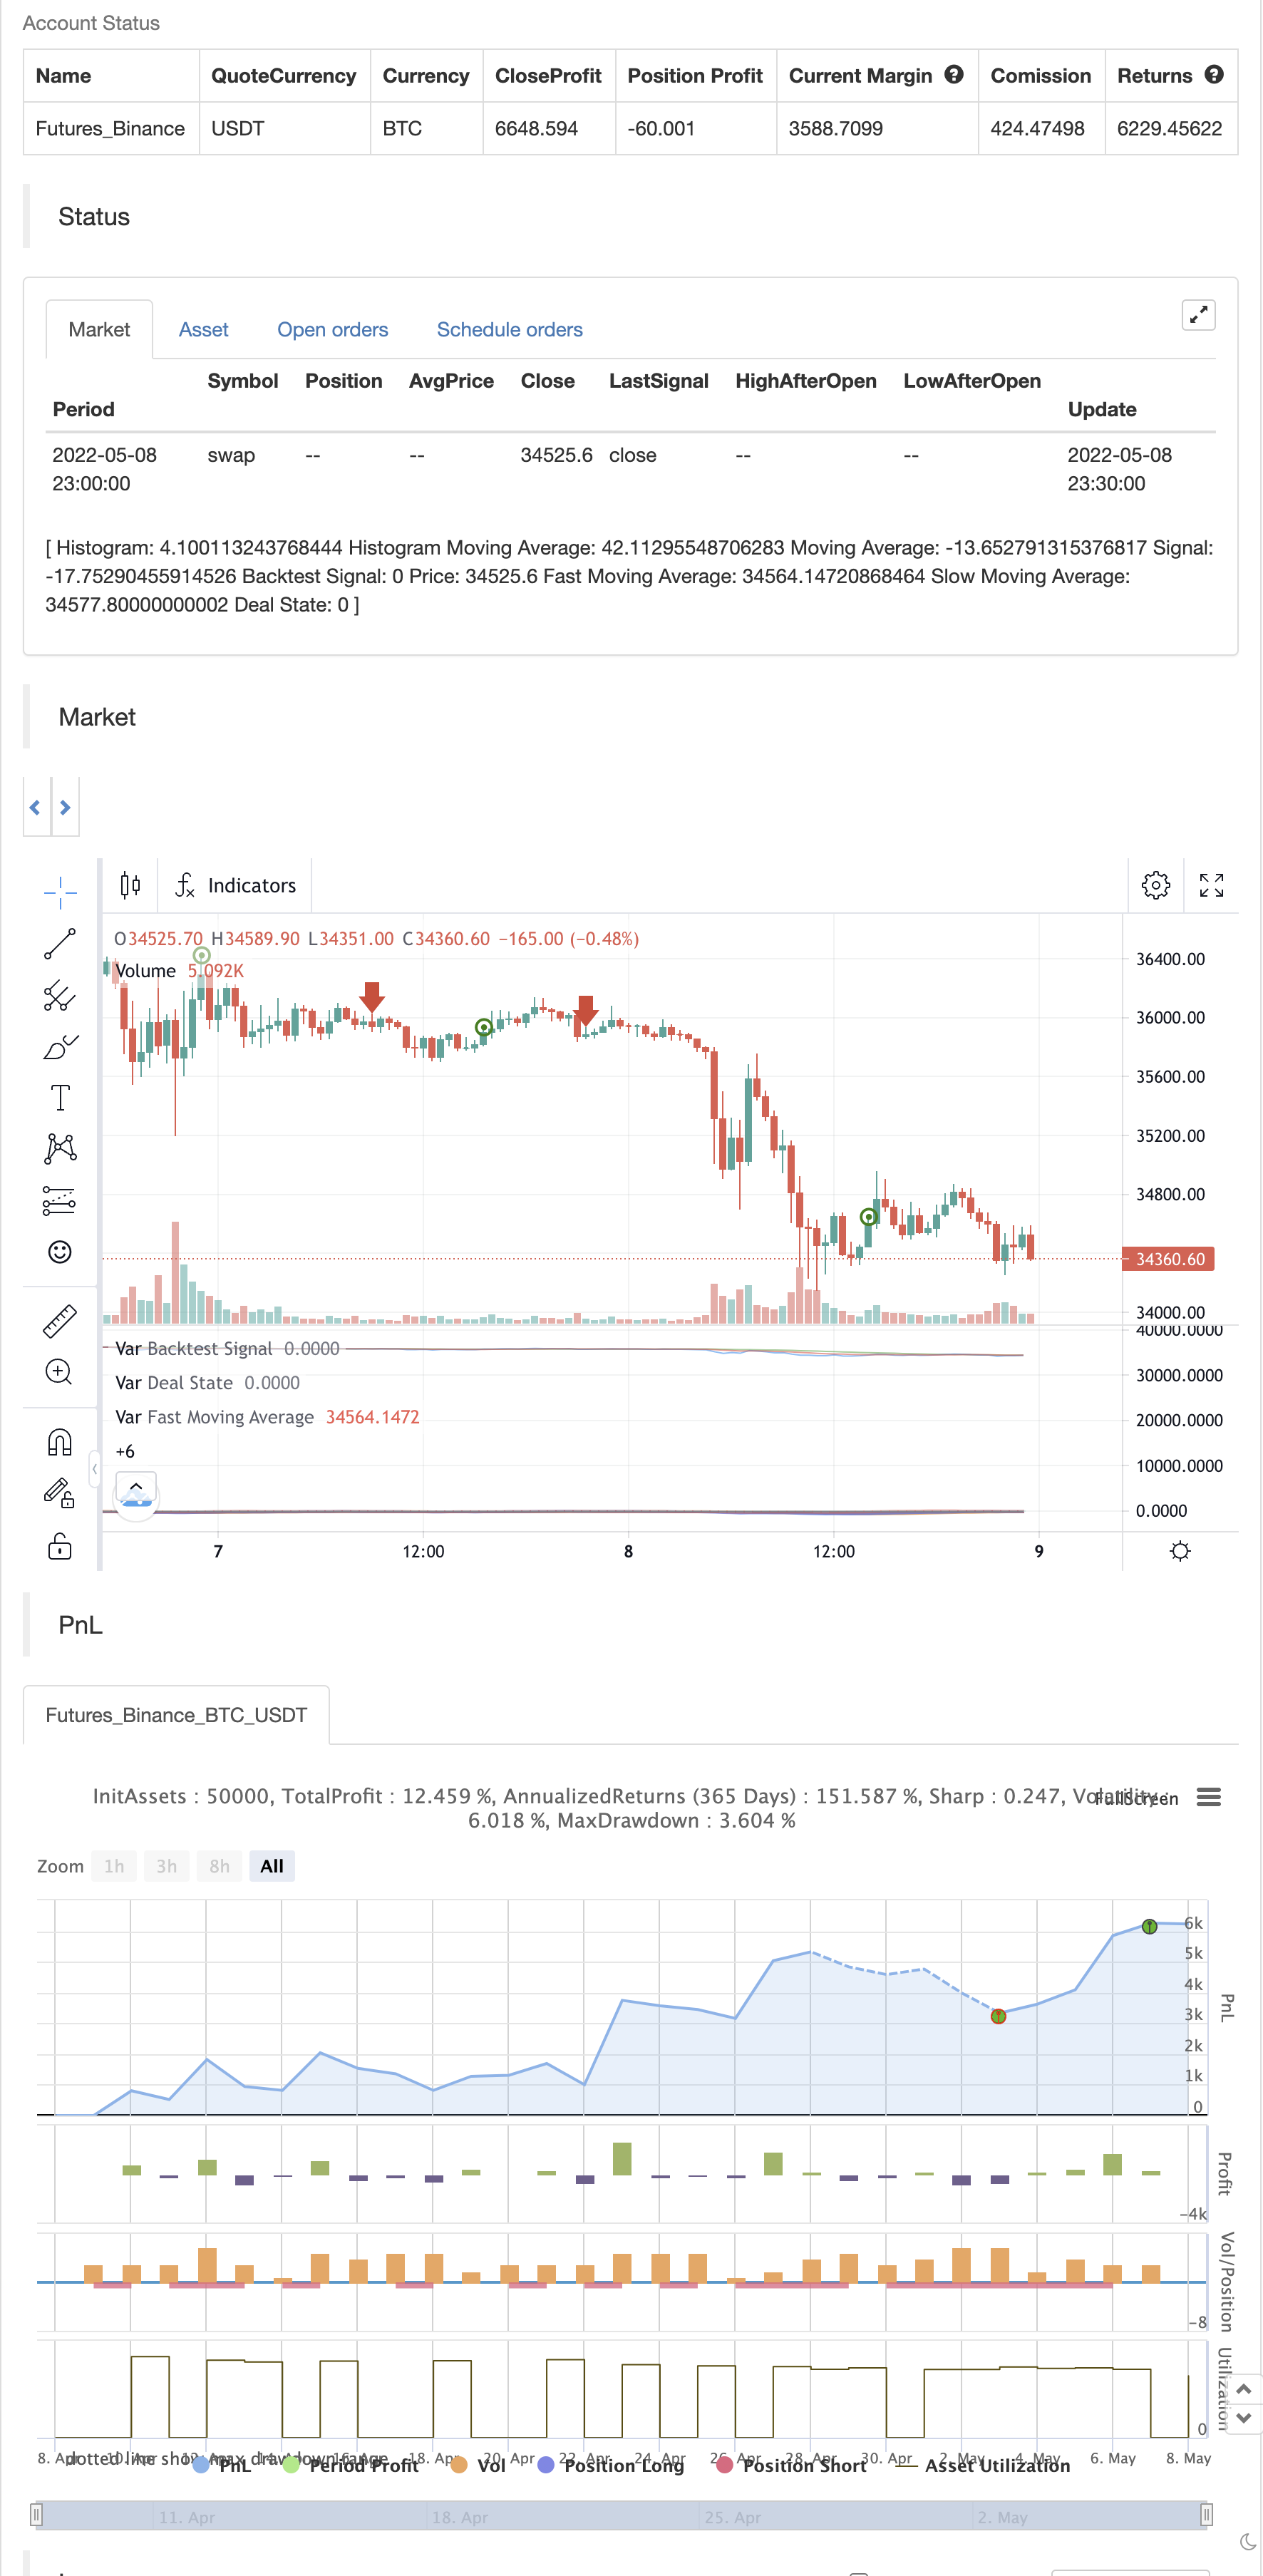
Cet indicateur affiche la convergence et la divergence des moyennes mobiles (MACD) des moyennes mobiles rapides, lentes et signalées configurées individuellement. Les alertes d'achat et de vente peuvent être configurées en fonction des croisements des moyennes mobiles, de la convergence / divergence consécutive des moyennes mobiles et des changements directionnels des moyennes mobiles de l'histogramme.
Les moyennes mobiles rapides, lentes et de signal peuvent être réglées sur: Moyenne mobile exponentielle (MAE) Moyenne mobile pondérée par volume (VWMA) Moyenne mobile simple (MSA) Moyenne mobile pondérée (WMA) Moyenne mobile de la coque (HMA) La moyenne mobile pondérée exponentiellement (RMA) (SMMA) Moyenne mobile pondérée symétriquement (SWMA) Moyenne mobile Arnaud Legoux (ALMA) Double EMA (DEMA) Le taux de change de l'indice de change est le même. Double WMA (DWMA) RMA double (DRMA) EMA triple (TEMA) Le montant de l'épargne annuelle Le nombre d'heures de travail est déterminé en fonction de l'activité. RMA triple (TRMA) Courbe de régression linéaire Moyenne mobile (LSMA) Moyenne dynamique de l' indice variable (VIDYA) Moyenne mobile adaptative fractale (FRAMA)
Si vous avez une stratégie qui peut acheter basé sur des indicateurs externes utiliser
test de retour
/*backtest
start: 2022-04-09 00:00:00
end: 2022-05-08 23:59:00
period: 30m
basePeriod: 15m
exchanges: [{"eid":"Futures_Binance","currency":"BTC_USDT"}]
*/

// This source code is subject to the terms of the Mozilla Public License 2.0 at https://mozilla.org/MPL/2.0/
// © EltAlt

//@version=5

//  -----------------------------------------------------------------------------
//
//  Authors:  @EltAlt
//  Revision: v3.00
//  Date:     09-May-2022
//
//  Description
//  =============================================================================
//  This indicator displays the Moving Average Convergane and Divergence (MACD) of individually configured Fast, Slow and Signal Moving
//  Averages. Buy and sell alerts can be set based on moving average crossovers, consecutive convergence/divergence of the moving averages,
//  and directional changes in the histogram moving averages.
//
//  The Fast, Slow and Signal Moving Averages can be set to:
//  Simple Moving Average (SMA)
//  Exponential Moving Average (EMA)
//  Weighted Moving Average (WMA)
//  Volume-Weighted Moving Average (VWMA)
//  Hull Moving Average (HMA)
//  Exponentially Weighted Moving Average (RMA) (SMMA)
//  Linear regression curve Moving Average (LSMA)
//  Double EMA (DEMA)
//  Double SMA (DSMA)
//  Double WMA (DWMA)
//  Double RMA (DRMA)
//  Triple EMA (TEMA)
//  Triple SMA (TSMA)
//  Triple WMA (TWMA)
//  Triple RMA (TRMA)
//  Symmetrically Weighted Moving Average (SWMA) ** length does not apply **
//  Arnaud Legoux Moving Average (ALMA)
//  Variable Index Dynamic Average (VIDYA)
//  Fractal Adaptive Moving Average (FRAMA)
//
//  If you have a strategy that can buy based on External Indicators you can use the 'Backtest Signal' which plots the values set in
//  the 'Long / Short Signals' section.
//  'Backtest Signal' is plotted to display.none, so change the Style Settings for the chart if you need to see it for testing.
//
//  =============================================================================
//
//  I would gladly accept any suggestions to improve the script.
//  If you encounter any problems please share them with me.
//
//  Thanks to Smartcryptotrade for "MACD Alert [All MA in one] [Smart Crypto Trade (SCT)]" which gave me the initial starting point.
//
//  Changlog
//  =============================================================================
//
//  2.01 • Added separate sources for the fast and slow moving averages.
//       • Added SWMA, because it's "All" moving averages. Interesting that SWMA doesn't take a length, so length will not apply.
//       • Consolidated MA functions for doubles and triples in to the calcMA function.
//       • Neatened up the inputs.
//  2.02 • Renamed to "AMACD - All Moving Average Convergence Divergence".
//       • Added ta.rising and ta.falling, which simplified things a lot, why didn't you tell me about these functions! :)
//       • Added a price plot with display=display.none for testing, color is green when above moving averages, red below and blue when
//         interacting.
//       • First Public release.
//  2.03 • Added a case for no signal smoothing, when signal length = 1.
//       • Re-wrote calcMA as a switch, much more pleasing on the eye.
//       • Removed all the security fluff which I'd never even read, "terms of the Mozilla Public License 2.0" is more comprehensive anyway.
//       • Added check boxes to quickly disable some of the default plots.
//  3.00 • Added options to generate open and close for both long and short positions. So if you are in a long position and your criteria
//         for a negative signal is met it will close your long, if another negative signal is generated it will open a short. If you're
//         just trading the crossover this will keep you permanently trading short or long, as it's only when there are two or more
//         consecutive signals are generated that will move you from longs to shorts.
//       • Plots a Green Triangle for Open Long, a Green Square for Close Long, a Red Triangle for Open Short and a Red Square for
//         Close Short.
//       • To do this I needed to track the sate of open deals. Could have done this with variables but thought plotting it may help,
//         so "Deal State" plots a 1 if it's in a long, 0 if no deals are open and -1 if it's in a short, to display.none. Enable it
//         in Stlye Settings if you need it for testing.
//       • If you'd prefer that it just worked as it did before with simple Buy / Sell signals, which makes sense if you're just trading
//         the crossover, disable the 'Generate Close Signals for Long / Short Positions' setting.
//       • Now that it can generate Open Long, Close Long, Open Short and Close Short signals I added a 'Long / Short Signals' section in
//         settings, where you can specify what signals your backtester is expecting for each state.
//       • Moving averages are now plotted to display.none as well in case you want to see the price and the moving averages for testing.
//         You're much better off running my other script 'Any Ribbon' on the top pane to show the moving averages ribbon, but these
//         options enable you to show them here if you want to.
//       • Added the option to buy / sell based on the moving average crossing zero, thanks Bu Bader!
//
//
// ▒▒▒▒▒▒▒▒▒▒▒▒▒▒▒▒▒▒▒▒▒▒▒▒▒▒▒▒▒▒▒▒▒▒▒▒▒▒▒▒▒▒▒▒▒▒▒▒▒▒▒▒▒▒▒▒▒▒▒▒▒▒▒▒▒▒▒▒▒▒▒▒▒▒▒▒▒▒▒▒▒▒▒▒▒▒▒▒▒▒▒▒▒▒▒▒▒▒▒▒▒▒▒▒▒▒▒▒▒▒▒▒▒▒
//
//
// ============ "AMACD - All Moving Average Convergence Divergence"

indicator(title='AMACD - All Moving Average Convergence Divergence',
          shorttitle='AMACD',
          overlay = false,
          timeframe='',
          timeframe_gaps=true)


// ▒▒▒▒▒▒▒▒▒▒▒▒▒▒▒▒▒▒▒▒▒▒▒▒▒▒▒▒▒▒▒▒▒▒▒▒▒▒▒▒▒▒▒▒▒▒▒▒▒▒▒▒▒▒▒▒▒▒▒▒▒▒▒▒▒▒▒▒▒▒▒▒▒▒▒▒▒▒▒▒▒▒▒▒▒▒▒▒▒▒▒▒▒▒▒▒▒▒▒▒▒▒▒▒▒▒▒▒▒▒▒▒▒▒
// ============ Inputs

FastType =   input.string('EMA', title='Fast Moving Average Type',   group='Moving Averages', options=['EMA', 'SMA', 'WMA', 'VWMA', 'HMA', 'RMA', 'LSMA', 'Double EMA', 'Double SMA', 'Double WMA', 'Double RMA', 'Triple EMA', 'Triple SMA', 'Triple WMA', 'Triple RMA', 'SWMA', 'ALMA', 'VIDYA', 'FRAMA'])
FastSource = input       (close, title='Fast Source', inline='Fast', group='Moving Averages')
FastLength = input.int   (12,    title='Fast Length', inline='Fast', group='Moving Averages', minval=2, maxval=1000)

SlowType   = input.string ('SMA', title='Slow Moving Average Type',   group='Moving Averages', options=['EMA', 'SMA', 'WMA', 'VWMA', 'HMA', 'RMA', 'LSMA', 'Double EMA', 'Double SMA', 'Double WMA', 'Double RMA', 'Triple EMA', 'Triple SMA', 'Triple WMA', 'Triple RMA', 'SWMA', 'ALMA', 'VIDYA', 'FRAMA'])
SlowSource = input        (close, title='Slow Source', inline='Slow', group='Moving Averages')
SlowLength = input.int    (26,    title='Slow Length', inline='Slow', group='Moving Averages', minval=2, maxval=1000)

SignalType   = input.string('SMA', title='Signal Moving Average Type',         inline='Signal', group='Moving Averages', options=['EMA', 'SMA', 'WMA', 'VWMA', 'HMA', 'RMA', 'LSMA', 'Double EMA', 'Double SMA', 'Double WMA', 'Double RMA', 'Triple EMA', 'Triple SMA', 'Triple WMA', 'Triple RMA', 'SWMA', 'ALMA', 'VIDYA', 'FRAMA'])
SignalLength = input.int   (9,     title='Signal Length', minval=1, maxval=1000, inline='Signal', group='Moving Averages')

offset_alma = input       (0.85, title='ALMA Offset', inline='1', group='Alma')
sigma_alma  = input.float (6,    title='ALMA Sigma',  inline='1', group='Alma')

FC = input.int(1,   minval=1, title='FRAMA lower shift limit (FC)', inline='1', group='Frama')
SC = input.int(198, minval=1, title='FRAMA upper shift limit (SC)', inline='1', group='Frama')

backtestBuyCrossover    = input.bool (true,  inline='1', group='Buy / Sell Moving Averages', title='Buy Moving Average Crossover')
backtestSellCrossover   = input.bool (true,  inline='1', group='Buy / Sell Moving Averages', title='Sell Moving Average Crossover')
backtestMACrossUpZero   = input.bool (false, inline='2', group='Buy / Sell Moving Averages', title='Buy Moving Average Crossing Zero')
backtestMACrossDownZero = input.bool (false, inline='2', group='Buy / Sell Moving Averages', title='Sell Moving Average Crossing Zero')

backtestBuyHistMA  = input.bool  (false,       inline='1', group='Buy / Sell Histogram Moving Averages', title='Buy Histogram MA Positive')
backtestSellHistMA = input.bool  (false,       inline='1', group='Buy / Sell Histogram Moving Averages', title='Sell Histogram MA Negative')
MAHistLength       = input.int   (5, minval=2, inline='2', group='Buy / Sell Histogram Moving Averages', title='Histogram MA Length')
MAHistType         = input.string('EMA',       inline='2', group='Buy / Sell Histogram Moving Averages', title='Histogram MA Type', options=['EMA', 'VWMA', 'SMA', 'WMA', 'HMA', 'RMA', 'ALMA', 'Double EMA', 'Double SMA', 'Double WMA', 'Double RMA', 'Triple EMA', 'Triple SMA', 'Triple WMA', 'Triple RMA', 'LSMA', 'VIDYA', 'FRAMA'])

backtestBuyRisingHist        = input.bool (false,       title='Buy MA Histogram Rising',                inline='1', group='Buy / Sell Histogram Rising / Falling')
backtestBuyRisingHistBelow   = input.bool (false,       title='Buy Histogram Rising Only Below Zero',   inline='1', group='Buy / Sell Histogram Rising / Falling')
risingHistLength             = input.int  (1, minval=1, title='Consecutive Rising Bars to Trigger Buy',             group='Buy / Sell Histogram Rising / Falling')
backtestSellFallingHist      = input.bool (false,       title='Sell MA Histogram Falling',              inline='2', group='Buy / Sell Histogram Rising / Falling')
backtestSellFallingHistAbove = input.bool (false,       title='Sell Histogram Falling Only Above Zero', inline='2', group='Buy / Sell Histogram Rising / Falling')
fallingHistLength            = input.int  (1, minval=1, title='Consecutive Falling Bars to Trigger Sell',           group='Buy / Sell Histogram Rising / Falling')

// Signal options
generateClose    = input.bool (true, inline='0', group='Long / Short Signals', title='Generate Close Signals for Long / Short Positions')
longOpenSignal   = input.int  (1,    inline='1', group='Long / Short Signals', title='Open Long = ')
longCloseSignal  = input.int  (2,    inline='1', group='Long / Short Signals', title='Close Long = ')
shortOpenSignal  = input.int  (-1,   inline='2', group='Long / Short Signals', title='Open Short = ')
shortCloseSignal = input.int  (-2,   inline='2', group='Long / Short Signals', title='Close Short = ')

// Plot options
plotAlerts = input.bool(true, title='Plot Alerts',                   inline='1', group='Plot Options')
plotMA     = input.bool(true, title='Plot Moving Average',           inline='1', group='Plot Options')
plotSig    = input.bool(true, title='Plot Signal',                   inline='1', group='Plot Options')
plotH      = input.bool(true, title='Plot Histogram',                inline='2', group='Plot Options')
plotHMA    = input.bool(true, title='Plot Histogram Moving Average', inline='2', group='Plot Options')

col_macd       = input(#2962FF, 'MACD Line  ',           group='Color Settings', inline='MACD')
col_signal     = input(#FF6D00, ' Signal Line  ',        group='Color Settings', inline='MACD')
col_grow_above = input(#26A69A, 'Histogram Above  Grow', group='Color Settings', inline='Above')
col_fall_above = input(#B2DFDB, 'Fall',                  group='Color Settings', inline='Above')
col_grow_below = input(#FFCDD2, 'Histogram Below  Grow', group='Color Settings', inline='Below')
col_fall_below = input(#FF5252, 'Fall',                  group='Color Settings', inline='Below')

var int dealstate = 0

// ▒▒▒▒▒▒▒▒▒▒▒▒▒▒▒▒▒▒▒▒▒▒▒▒▒▒▒▒▒▒▒▒▒▒▒▒▒▒▒▒▒▒▒▒▒▒▒▒▒▒▒▒▒▒▒▒▒▒▒▒▒▒▒▒▒▒▒▒▒▒▒▒▒▒▒▒▒▒▒▒▒▒▒▒▒▒▒▒▒▒▒▒▒▒▒▒▒▒▒▒▒▒▒▒▒▒▒▒▒▒▒▒▒▒
// ============ Functions

getCMO(src, length) =>
    mom     = ta.change(src)
    upSum   = math.sum(math.max(mom, 0), length)
    downSum = math.sum(-math.min(mom, 0), length)
    out     = (upSum - downSum) / (upSum + downSum)
    out

vidya(src, length) =>
    alpha  = 2 / (length + 1)
    cmo    = math.abs(getCMO(src, length))
    vidya  = 0.0
    vidya := src * alpha * cmo + nz(vidya[1]) * (1 - alpha * cmo)
    vidya

frama(x, y, z, v) =>
    // x = source , y = length , z = FC , v = SC
    HL        = (ta.highest(high, y) - ta.lowest(low, y)) / y
    HL1       = (ta.highest(high, y / 2) - ta.lowest(low, y / 2)) / (y / 2)
    HL2       = (ta.highest(high, y / 2)[y / 2] - ta.lowest(low, y / 2)[y / 2]) / (y / 2)
    D         = (math.log(HL1 + HL2) - math.log(HL)) / math.log(2)
    dim       = HL1 > 0 and HL2 > 0 and HL > 0 ? D : nz(D[1])
    w         = math.log(2 / (v + 1))
    alpha     = math.exp(w * (dim - 1))
    alpha1    = alpha > 1 ? 1 : alpha < 0.01 ? 0.01 : alpha
    oldN      = (2 - alpha1) / alpha1
    newN      = (v - z) * (oldN - 1) / (v - 1) + z
    newalpha  = 2 / (newN + 1)
    newalpha1 = newalpha < 2 / (v + 1) ? 2 / (v + 1) : newalpha > 1 ? 1 : newalpha
    frama     = 0.0
    frama    := (1 - newalpha1) * nz(frama[1]) + newalpha1 * x
    frama

calcMA(_type, _src, _length) =>
    switch _type
        'EMA'        => ta.ema(_src, _length)
        'SMA'        => ta.sma(_src, _length)
        'WMA'        => ta.wma(_src, _length)
        'VWMA'       => ta.vwma(_src, _length)
        'HMA'        => ta.hma(_src, _length)
        'RMA'        => ta.rma(_src, _length)
        'LSMA'       => ta.linreg(_src, _length, 0)
        'Double EMA' => 2 * ta.ema(_src, _length) - ta.ema(ta.ema(_src, _length), _length)
        'Double SMA' => 2 * ta.sma(_src, _length) - ta.sma(ta.sma(_src, _length), _length)
        'Double WMA' => 2 * ta.wma(_src, _length) - ta.wma(ta.wma(_src, _length), _length)
        'Double RMA' => 2 * ta.rma(_src, _length) - ta.rma(ta.rma(_src, _length), _length)
        'Triple EMA' => 3 * (ta.ema(_src, _length) - ta.ema(ta.ema(_src, _length), _length)) + ta.ema(ta.ema(ta.ema(_src, _length), _length), _length)
        'Triple SMA' => 3 * (ta.sma(_src, _length) - ta.sma(ta.sma(_src, _length), _length)) + ta.sma(ta.sma(ta.sma(_src, _length), _length), _length)
        'Triple WMA' => 3 * (ta.wma(_src, _length) - ta.wma(ta.wma(_src, _length), _length)) + ta.wma(ta.wma(ta.wma(_src, _length), _length), _length)
        'Triple RMA' => 3 * (ta.rma(_src, _length) - ta.rma(ta.rma(_src, _length), _length)) + ta.rma(ta.rma(ta.rma(_src, _length), _length), _length)
        'SWMA'       => ta.swma(_src)        // No Length for SWMA
        'ALMA'       => ta.alma(_src, _length, offset_alma, sigma_alma)
        'VIDYA'      => vidya(_src, _length)
        'FRAMA'      => frama(_src, _length, FC, SC)


// ▒▒▒▒▒▒▒▒▒▒▒▒▒▒▒▒▒▒▒▒▒▒▒▒▒▒▒▒▒▒▒▒▒▒▒▒▒▒▒▒▒▒▒▒▒▒▒▒▒▒▒▒▒▒▒▒▒▒▒▒▒▒▒▒▒▒▒▒▒▒▒▒▒▒▒▒▒▒▒▒▒▒▒▒▒▒▒▒▒▒▒▒▒▒▒▒▒▒▒▒▒▒▒▒▒▒▒▒▒▒▒▒▒▒
// ============ Calculations

MA_fast = calcMA(FastType, FastSource, FastLength)
MA_slow = calcMA(SlowType, SlowSource, SlowLength)

macd   = MA_fast - MA_slow
signal = SignalLength > 1 ? calcMA(SignalType, macd, SignalLength) : 0
hist   = macd - signal
histMA = calcMA(MAHistType, hist, MAHistLength)


// ▒▒▒▒▒▒▒▒▒▒▒▒▒▒▒▒▒▒▒▒▒▒▒▒▒▒▒▒▒▒▒▒▒▒▒▒▒▒▒▒▒▒▒▒▒▒▒▒▒▒▒▒▒▒▒▒▒▒▒▒▒▒▒▒▒▒▒▒▒▒▒▒▒▒▒▒▒▒▒▒▒▒▒▒▒▒▒▒▒▒▒▒▒▒▒▒▒▒▒▒▒▒▒▒▒▒▒▒▒▒▒▒▒▒
// ============ Logic

longSignal  = ta.crossover(hist, 0)
shortSignal = ta.crossunder(hist, 0)

MACrossUpZero   = ta.crossover(macd, 0)
MACrossDownZero = ta.crossover(macd, 0)

longHistMA  = histMA > histMA[1]
shortHistMA = histMA < histMA[1]

risingHist  = ta.rising  (hist, risingHistLength)  and (hist < 0 or not backtestBuyRisingHistBelow)
fallingHist = ta.falling (hist, fallingHistLength) and (hist > 0 or not backtestSellFallingHistAbove)

bool openLong   = false
bool closeLong  = false
bool openShort  = false
bool closeShort = false

if ((backtestBuyCrossover      and longSignal)
     or (backtestBuyHistMA     and longHistMA and not longHistMA[1])
     or (backtestBuyRisingHist and risingHist and not risingHist[1])
     or (backtestMACrossUpZero and MACrossUpZero))
    if (dealstate[1] == -1) and generateClose
        closeShort := true
        dealstate := 0
    else
        openLong := true
        dealstate := 1

if ((backtestSellCrossover       and shortSignal)
     or (backtestSellHistMA      and shortHistMA and not shortHistMA[1])
     or (backtestSellFallingHist and fallingHist and not fallingHist[1])
     or (backtestMACrossDownZero and MACrossDownZero))
    if (dealstate[1] == 1) and generateClose
        closeLong := true
        dealstate := 0
    else
        openShort := true
        dealstate := -1


// ▒▒▒▒▒▒▒▒▒▒▒▒▒▒▒▒▒▒▒▒▒▒▒▒▒▒▒▒▒▒▒▒▒▒▒▒▒▒▒▒▒▒▒▒▒▒▒▒▒▒▒▒▒▒▒▒▒▒▒▒▒▒▒▒▒▒▒▒▒▒▒▒▒▒▒▒▒▒▒▒▒▒▒▒▒▒▒▒▒▒▒▒▒▒▒▒▒▒▒▒▒▒▒▒▒▒▒▒▒▒▒▒▒▒
// ============ Plot
plot(plotH   ? hist   : na, title='Histogram', style=plot.style_columns, color=hist >= 0 ? hist[1] < hist ? col_grow_above : col_fall_above : hist[1] < hist ? col_grow_below : col_fall_below, linewidth=2)
plot(plotHMA ? histMA : na, title='Histogram Moving Average', color=histMA > histMA[1] ? col_grow_above : col_fall_below, linewidth=2)
plot(plotMA  ? macd   : na, title='Moving Average', color=col_macd, linewidth=2)
plot(plotSig ? signal : na, title='Signal', color=col_signal, linewidth=2)

plot(openLong ? longOpenSignal : closeLong ? longCloseSignal : openShort ? shortOpenSignal : closeShort ? shortCloseSignal : 0, 'Backtest Signal', color=openLong or closeShort ? color.lime : openShort or closeLong? color.red : color.gray, display=display.none)

plot(close, title='Price', display=display.none, color = (low > MA_fast and low > MA_slow ? true : false) ? color.lime : (high < MA_fast and high < MA_slow ? true : false) ? color.red : color.blue)
plot(MA_fast, title= 'Fast Moving Average', display=display.none, color = color.red)
plot(MA_slow, title= 'Slow Moving Average', display=display.none, color = color.green)
plot(dealstate, title='Deal State', display=display.none, color = (dealstate > 0 ? color.lime : dealstate < 0 ? color.red : color.gray))

// ▒▒▒▒▒▒▒▒▒▒▒▒▒▒▒▒▒▒▒▒▒▒▒▒▒▒▒▒▒▒▒▒▒▒▒▒▒▒▒▒▒▒▒▒▒▒▒▒▒▒▒▒▒▒▒▒▒▒▒▒▒▒▒▒▒▒▒▒▒▒▒▒▒▒▒▒▒▒▒▒▒▒▒▒▒▒▒▒▒▒▒▒▒▒▒▒▒▒▒▒▒▒▒▒▒▒▒▒▒▒▒▒▒▒
// ============ Alerts

alertcondition (openLong,   title='AMACD Open Long!',   message='Buy signal, put your JSON here to open deals or start bots.')
alertcondition (openShort,  title='AMACD Open Short!',  message='Sell signal, put your JSON here to close deals or stop bots.')
alertcondition (closeShort, title='AMACD Close Short!', message='Buy signal, put your JSON here to open deals or start bots.')
alertcondition (closeLong,  title='AMACD Close Long!',  message='Sell signal, put your JSON here to close deals or stop bots.')

//plotshape (plotAlerts ? openLong and longOpenSignal     : na, style=shape.triangleup,   color=color.lime, location=location.bottom, size=size.tiny, title='Open Long')
//plotshape (plotAlerts ? closeLong and longCloseSignal   : na, style=shape.square,       color=color.lime, location=location.bottom, size=size.tiny, title='Close Long')
//plotshape (plotAlerts ? openShort and shortOpenSignal   : na, style=shape.triangledown, color=color.red,  location=location.bottom, size=size.tiny, title='Open Short')
//plotshape (plotAlerts ? closeShort and shortCloseSignal : na, style=shape.square,       color=color.red,  location=location.bottom, size=size.tiny, title='Close Short')

if openLong and longOpenSignal
    strategy.entry("Enter Long", strategy.long)
else if openShort and shortOpenSignal
    strategy.entry("Enter Short", strategy.short)

strategy.close("Enter Long",when=(closeLong and longCloseSignal),comment="Long_OK")
strategy.close("Enter Short",when=(closeShort and shortCloseSignal),comment="Short_OK")
- Le canal SSL
- Indicateur: oscillateur de tendance d'onde
- Échange ABC
- Hull-4ema
- Bollinger Awesome Alerte R1 Pour les produits de base
- HALFTREND + HEMA + SMA (stratégie du faux signal)
- Alerte croisée moyenne mobile (MTF) sur plusieurs délais
- QQE MOD + SSL hybride + Waddah Attar explosion
- Modèle d'alerte ML
- Stratégie de négociation quantitative basée sur les moyennes mobiles et les bandes de Bollinger
- Groupe MAHL
- 3 Supertrend ajouter dans ce seul script
- Indicateur de basse/haute oscillation avec confirmation du MACD et de l'EMA
- Le taux d'intérêt est le plus bas
- Jouer au cross
- Fractals plus petits (+ Transparence)
- Point d'entrée BB-RSI-ADX
- Hull-4ema
- Indicateur de ligne d'attaque d'angle
- La ligne KijunSen avec la croix
- MA HYBRID par RAJ
- Tendance au diamant
- Nik Stoch est là.
- le stock est supérieur à 200 ma
- RSI MTF et stratégie STOCH
- EMA + AROON + ASH
- Le momentum 2.0
- Stratégie de la gamme EHMA
- Moyenne mobile d'achat-vente
- Midas Mk. II - Le dernier Crypto Swing