Échange ABC
Auteur:ChaoZhang est là., Date: le 23 mai 2022 à 16h33:08Les étiquettes:SMALe taux d'intérêt
Bonjour les commerçants,
Depuis quelques mois, je reçois des demandes de mes abonnés sur le modèle ABC et finalement j'ai décidé de faire cet indicateur.
Comment ça marche?
- Il crée le nuage de tendance en utilisant des moyennes mobiles simples et exponentielles avec les longueurs 50, 100, 150, 200, 20, 40 par défaut et vérifie la tendance. vous pouvez changer les longueurs que vous souhaitez
- Il crée également ZigZag en utilisant la période ZigZag dans les options.
- En utilisant les 2 dernières ondes en zigzag, il vérifie s'il existe un motif ABC approprié selon la tendance, les niveaux Min/Max Fibonacci et le taux d'erreur
- Ensuite, il vérifie si le prix rebondit après ce modèle ABC
- Et si toutes ces conditions sont remplies alors il trace triangle
- S'il y a plusieurs rebonds alors vous pouvez voir plusieurs triangles
Vous pouvez modifier / régler;
- Période du zigzag
- Niveau maximal de Fibonacci
- Le niveau de Fibonacci
- Taux d'erreur
- Les longueurs utilisées pour les moyennes mobiles
- Conservation des anciennes lignes/étiquettes de l'alphabet
- Affichage des niveaux de Fibonacci en zigzag et en min/max
- Afficher le nuage de tendance
- et les couleurs
test de retour
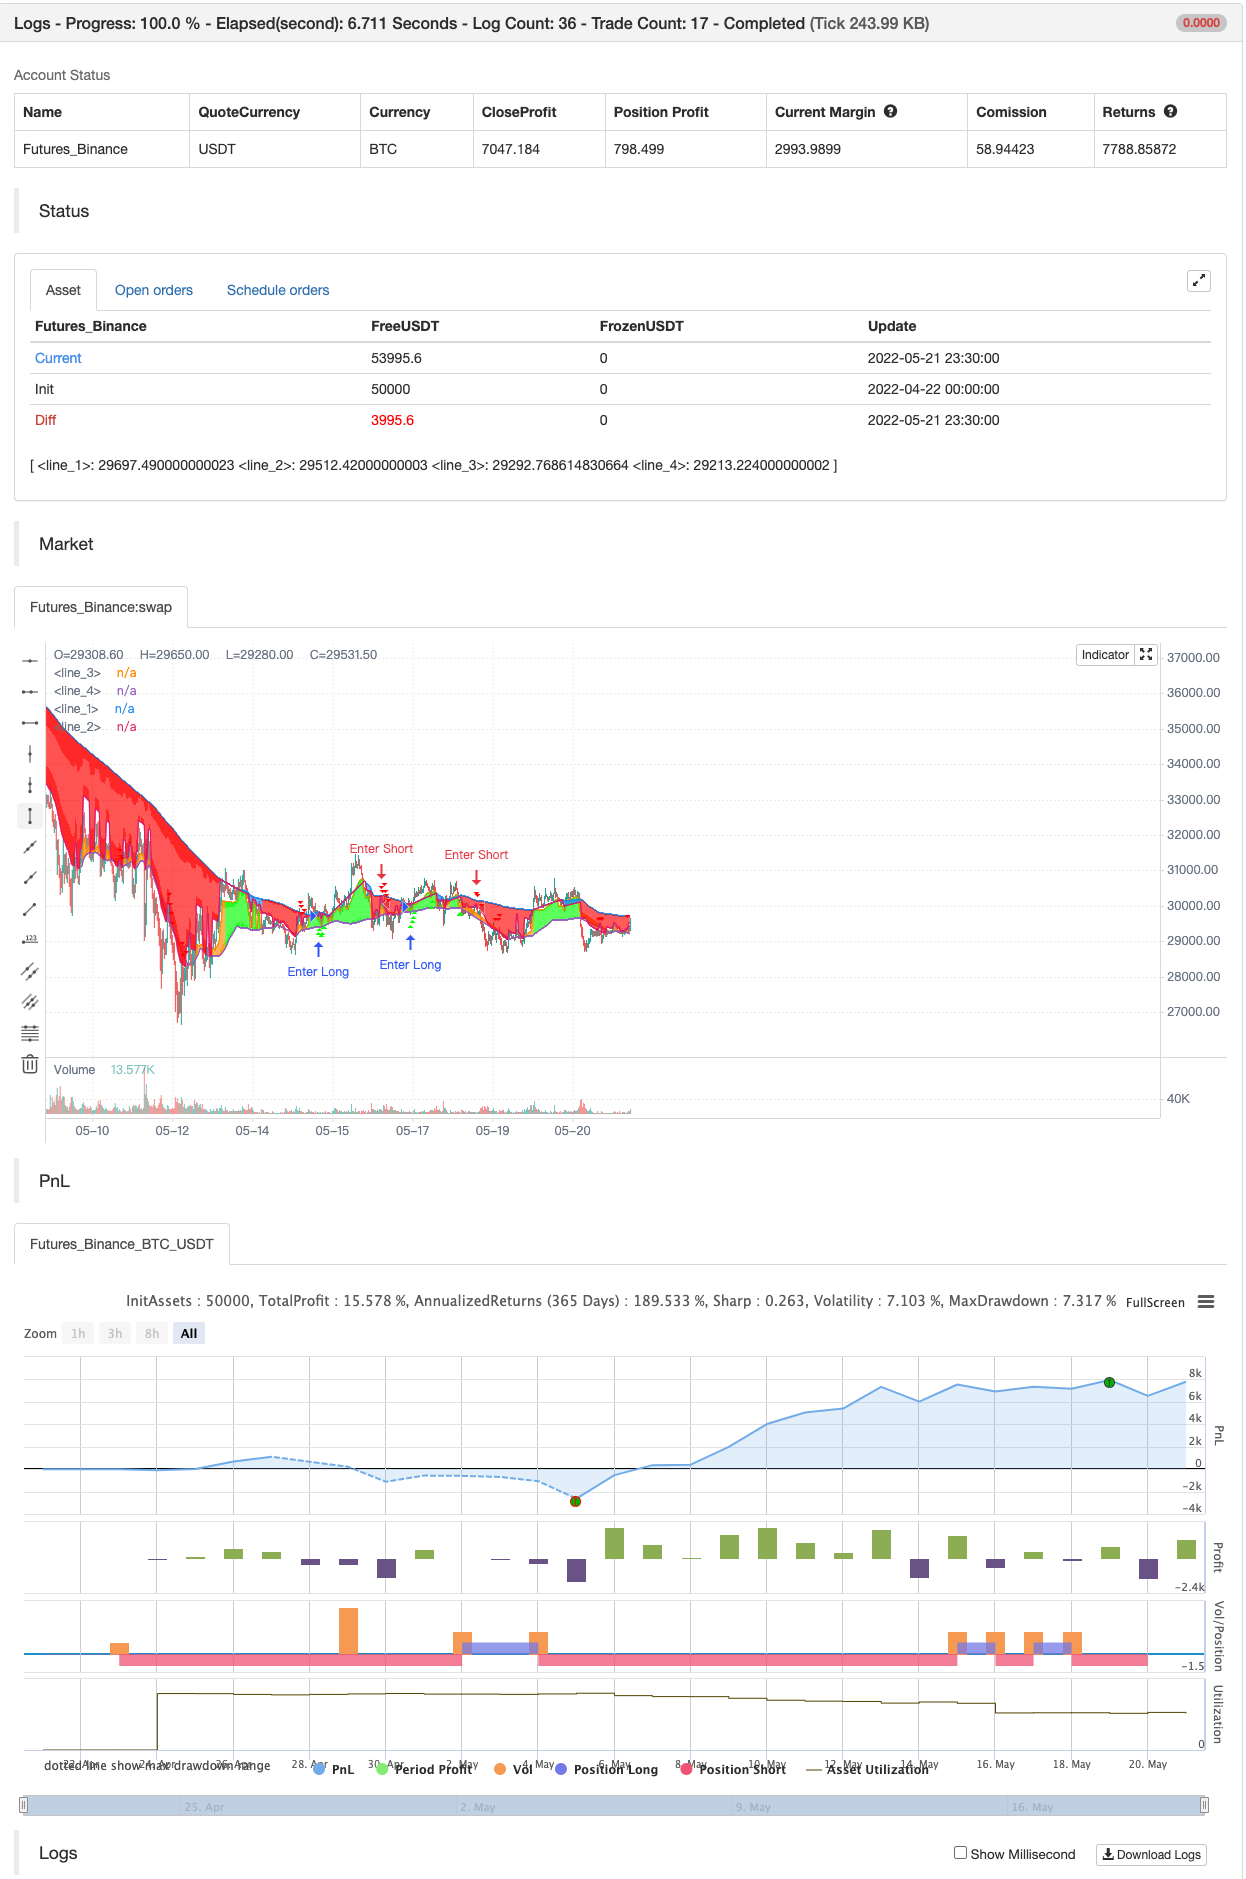
/*backtest
start: 2022-04-22 00:00:00
end: 2022-05-21 23:59:00
period: 30m
basePeriod: 15m
exchanges: [{"eid":"Futures_Binance","currency":"BTC_USDT"}]
*/

// This source code is subject to the terms of the Mozilla Public License 2.0 at https://mozilla.org/MPL/2.0/
// © LonesomeTheBlue

//@version=4
study("Trading ABC", overlay = true, max_bars_back = 500, max_lines_count = 500, max_labels_count = 500)
prd = input(defval = 8, title="ZigZag Period", minval = 2, maxval = 50, group = "Setup")
fiboup = input(defval = 0.618, title = "Fibonacci Max", group = "Setup")
fibodn = input(defval = 0.382, title = "Fibonacci Min", group = "Setup")
errorrate = input(defval = 5.0, title = "Error Rate", minval = 0, maxval = 30, group = "Setup") / 100
showabc = input(defval = true, title = "Show ABC", group = "Extras")
keepabc = input(defval = true, title = "Keep Old ABCs", group = "Extras")
showcloud = input(defval = true, title = "Show Cloud", group = "Extras", inline = "cloud")
c_upcol = input(defval = color.new(color.lime, 75), title = "", group = "Extras", inline = "cloud")
c_dncol = input(defval = color.new(color.red, 75), title = "", group = "Extras", inline = "cloud")
showzigzag = input(defval = true, title = "Show Zig Zag & Fibo", group = "Extras", inline = "zigzag")
upcol = input(defval = color.lime, title = "", group = "Extras", inline = "zigzag")
dncol = input(defval = color.red, title = "", group = "Extras", inline = "zigzag")
srcma = input(defval = close, title = "Source for Moving Averages", group = "Trend Cloud")
malen1 = input(defval = 50, title = "SMA 1 Length", minval = 1, group = "Trend Cloud")
malen2 = input(defval = 100, title = "SMA 2 Length", minval = 1, group = "Trend Cloud")
malen3 = input(defval = 150, title = "SMA 3 Length", minval = 1, group = "Trend Cloud")
malen4 = input(defval = 200, title = "SMA 4 Length", minval = 1, group = "Trend Cloud")
malen5 = input(defval = 20, title = "EMA 1 Length", minval = 1, group = "Trend Cloud")
malen6 = input(defval = 40, title = "EMA 2 Length", minval = 1, group = "Trend Cloud")

ma_array = array.new_float(6)
array.set(ma_array, 0, sma(srcma, malen1))
array.set(ma_array, 1, sma(srcma, malen2))
array.set(ma_array, 2, sma(srcma, malen3))
array.set(ma_array, 3, sma(srcma, malen4))
array.set(ma_array, 4, ema(srcma, malen5))
array.set(ma_array, 5, ema(srcma, malen6))

float umax = na
float umin = na
float lmax = na
float lmin = na
int upper = 0
int lower = 0
for x = 1 to 6
    ma = array.get(ma_array, x -1)
    if ma >= max(open, close)
        upper := upper + 1
        if na(umax)
            umax := ma
            umin := ma
        else
            umax := max(umax, ma)
            umin := min(umin, ma)
    else if ma <= min(open, close)
        lower := lower + 1
        if na(lmax)
            lmax := ma
            lmin := ma
        else
            lmax := max(lmax, ma)
            lmin := min(lmin, ma)

var int trend = 0
trend := lower > 0 and upper == 0 and lower[1] > 0 and upper[1] == 0 ? 1 :
         lower == 0 and upper > 0 and lower[1] == 0 and upper[1] > 0 ? -1 :
         trend

tucolor = trend ==  1 ? c_upcol: na
tdcolor = trend == -1 ? c_dncol : na
fill(plot(umax, color = na), plot(umin, color = na), color = showcloud ? tdcolor : na)
fill(plot(lmax, color = na), plot(lmin, color = na), color = showcloud ? tucolor : na)

//===================================================================

// zigzag part
get_ph_pl_dir(len)=>
    float ph = highestbars(high, len) == 0 ? high : na
    float pl = lowestbars(low, len) == 0 ? low : na
    var dir = 0
    dir := iff(ph and na(pl), 1, iff(pl and na(ph), -1, dir))
    [ph, pl, dir]

[ph, pl, dir] = get_ph_pl_dir(prd)

var max_array_size = 10
var zigzag = array.new_float(0)

add_to_zigzag(value, bindex)=>
    array.unshift(zigzag, bindex)
    array.unshift(zigzag, value)
    if array.size(zigzag) > max_array_size
        array.pop(zigzag)
        array.pop(zigzag)

update_zigzag(value, bindex)=>
    if array.size(zigzag) == 0
        add_to_zigzag(value, bindex)
    else
        if (dir == 1 and value > array.get(zigzag, 0)) or (dir == -1 and value < array.get(zigzag, 0))
            array.set(zigzag, 0, value)
            array.set(zigzag, 1, bindex)
        0.

dir_changed = change(dir)
if ph or pl
    if dir_changed
        add_to_zigzag(dir == 1 ? ph : pl, bar_index)
    else
        update_zigzag(dir == 1 ? ph : pl, bar_index)

// if showzigzag and array.size(zigzag) > 5
    // var line zzline1 = na
    // var line zzline2 = na
    //line.delete(zzline1)
    //line.delete(zzline2)
   // zzline1 := line.new(x1 = round(array.get(zigzag, 1)) , y1 = array.get(zigzag, 0), x2 = round(array.get(zigzag, 3)), y2 = array.get(zigzag, 2), color = dir == 1 ? upcol : dncol, width = 2, style = line.style_dashed)
    //zzline2 := line.new(x1 = round(array.get(zigzag, 3)) , y1 = array.get(zigzag, 2), x2 = round(array.get(zigzag, 5)), y2 = array.get(zigzag, 4), color = dir == -1 ? upcol : dncol, width = 2, style = line.style_dashed)
    // min/max fibo levels
    // zzlen = abs(array.get(zigzag, 2) - array.get(zigzag, 4))
    // fmin = dir == 1 ? array.get(zigzag, 2) + zzlen * (fibodn - errorrate) : array.get(zigzag, 4) + zzlen * ((1 - fibodn) + errorrate)
    // fmax = dir == 1 ? array.get(zigzag, 2) + zzlen * (fiboup + errorrate) : array.get(zigzag, 4) + zzlen * ((1 - fiboup) - errorrate)
    // var line fibo1 = na
    // var line fibo2 = na
    // line.delete(fibo1)
    // line.delete(fibo2)
    // fibo1 := line.new(x1 = round(array.get(zigzag, 3)), y1 = fmin, x2 = round(array.get(zigzag, 3)) + 1, y2 = fmin, color = color.blue, style = line.style_dashed, extend = extend.right)
    // fibo2 := line.new(x1 = round(array.get(zigzag, 3)), y1 = fmax, x2 = round(array.get(zigzag, 3)) + 1, y2 = fmax, color = color.blue, style = line.style_dashed, extend = extend.right)

zchange = array.size(zigzag) > 0 ? array.get(zigzag, 0) :  0.0
abc = array.new_float(0)
if change(zchange) and array.size(zigzag) > 5 and ((pl and trend == 1  and dir == -1 and low < array.max(ma_array)) or (ph and trend == -1 and dir == 1 and high > array.min(ma_array)))
    a = array.get(zigzag, 0)
    b = array.get(zigzag, 2)
    b_loc = array.get(zigzag, 3)
    c = array.get(zigzag, 4)
    c_loc = array.get(zigzag, 5)
    rate = (a - b) / (c - b)
    if rate >= (fibodn - fibodn * errorrate) and rate <= (fiboup + fiboup * errorrate)
        array.push(abc, b)
        array.push(abc, b_loc)
        array.push(abc, c)
        array.push(abc, c_loc)

// draw_line(dir, x1_,y1_, x2_, y2_, x3_, y3_)=>
//     l1 = line.new(x1 = x1_, y1 = y1_, x2 = x2_, y2 = y2_, color = dir == 1 ? upcol : dncol, width = 2)
//     l2 = line.new(x1 = x2_, y1 = y2_, x2 = x3_, y2 = y3_, color = dir == 1 ? dncol : upcol, width = 2)
//     [l1, l2]

// draw_label(dir, x1_,y1_, x2_, y2_, x3_, y3_)=>
//     alabel = label.new(  x = x1_,
//                          y = y1_,
//                          text = "C",
//                          style = dir == 1 ? label.style_label_down : label.style_label_up,
//                          color = color.new(color.white, 100),
//                          textcolor = color.blue)
//     blabel = label.new(  x = x2_,
//                          y = y2_,
//                          text = "B",
//                          style = dir == -1 ? label.style_label_down : label.style_label_up,
//                          color = color.new(color.white, 100),
//                          textcolor = color.blue)
//     clabel = label.new(  x = x3_,
//                          y = y3_,
//                          text = "A",
//                          style = dir == 1 ? label.style_label_down : label.style_label_up,
//                          color = color.new(color.white, 100),
//                          textcolor = color.blue)
//     [alabel, blabel, clabel]

// var abclines = array.new_line(2)
// var abclabels = array.new_label(3)

// if showabc and array.size(abc) >= 4
//     if not keepabc
//         line.delete(array.pop(abclines))
//         line.delete(array.pop(abclines))
//         label.delete(array.pop(abclabels))
//         label.delete(array.pop(abclabels))
//         label.delete(array.pop(abclabels))

//     [l1_, l2_] = draw_line(dir, bar_index, array.get(zigzag, 0), round(array.get(abc, 1)),  array.get(abc, 0), round(array.get(abc, 3)), array.get(abc, 2))
//     array.unshift(abclines, l1_)
//     array.unshift(abclines, l2_)

//     [la1_, la2_, la3_] = draw_label(dir, bar_index, array.get(zigzag, 0), round(array.get(abc, 1)),  array.get(abc, 0), round(array.get(abc, 3)), array.get(abc, 2))
//     array.unshift(abclabels, la1_)
//     array.unshift(abclabels, la2_)
//     array.unshift(abclabels, la3_)

// bounce?
lbounced = false
sbounced = false
for i = 0 to 5
    if min(low, low[1]) <= array.get(ma_array, i) and close > array.get(ma_array, i) and close > open
        lbounced := true
    if max(high, high[1]) >= array.get(ma_array, i) and close < array.get(ma_array, i) and close < open
        sbounced := true

// stoch give signal?
sto = sma(stoch(close, high, low, 5), 3)
sto_sig = sma(sto, 3)
lstoch = sto[1] <= sto_sig[1] and sto > sto_sig and sto[1] < 50 //and sto_sig > 20
sstoch = sto[1] >= sto_sig[1] and sto < sto_sig  and sto[1] > 50 //and sto_sig < 80

/// check if conditions met
there_is_abc = array.size(abc) != 0
var float last_zz_point = 0.
last_zz_point := array.size(zigzag) > 2 and there_is_abc ? array.get(zigzag, 0) : last_zz_point
var abc_bar_count = 0
abc_bar_count := there_is_abc ? 0 : abc_bar_count + 1
hhh_ = highest(abc_bar_count + 1)
lll_ = lowest(abc_bar_count + 1)

// long condition
long = trend == 1 and abc_bar_count <= 6 and lbounced and lll_ >= last_zz_point
short = trend == -1 and abc_bar_count <= 6 and sbounced and hhh_ <= last_zz_point

plotshape(long,  style = shape.triangleup, color = upcol, location =  location.belowbar, size = size.small)
plotshape(short,  style = shape.triangledown, color = dncol, location =  location.abovebar, size = size.small)

alertcondition(long, title = "ABC Long", message = "ABC Long")
alertcondition(short, title = "ABC Short", message = "ABC Short")


if long
    strategy.entry("Enter Long", strategy.long)
else if short
    strategy.entry("Enter Short", strategy.short)
Relationnée
- Le canal SSL
- AMACD - Divergence de convergence de toutes les moyennes mobiles
- Indicateur: oscillateur de tendance d'onde
- Hull-4ema
- Bollinger Awesome Alerte R1 Pour les produits de base
- HALFTREND + HEMA + SMA (stratégie du faux signal)
- Alerte croisée moyenne mobile (MTF) sur plusieurs délais
- QQE MOD + SSL hybride + Waddah Attar explosion
- Modèle d'alerte ML
- Stratégie de négociation quantitative basée sur les moyennes mobiles et les bandes de Bollinger
Plus de
- Série de matrice
- Super scalper - 5 minutes 15 minutes
- Indice de force relative - Différences - Libertus
- Régression linéaire ++
- RedK double VADER avec barres d'énergie
- Zones de consolidation - en direct
- Évaluation quantitative et qualitative
- Alerte croisée moyenne mobile (MTF) sur plusieurs délais
- La stratégie de recharge du MACD
- Les moyennes mobiles à tendance supérieure
- 15 minutes BTCUSDTPERP BOT
- L'entropie de Shannon V2
- Supertrend à l'arrière avec arrêt de traînée
- Flux de volume v3
- scalping horaire avec ma & rsi - ogcheckers
- ATR lissé
- Trouveur de blocs de commande
- Les résultats de l'analyse sont publiés dans le rapport annuel annuel annuel.
- Signaux QQE
- Filtre de l'amplitude de grille en U