Maxima et minima de suivi basés sur pivot
Auteur:ChaoZhang est là., Date: 2022-05-25 18h18h49Les étiquettes:Le pivot
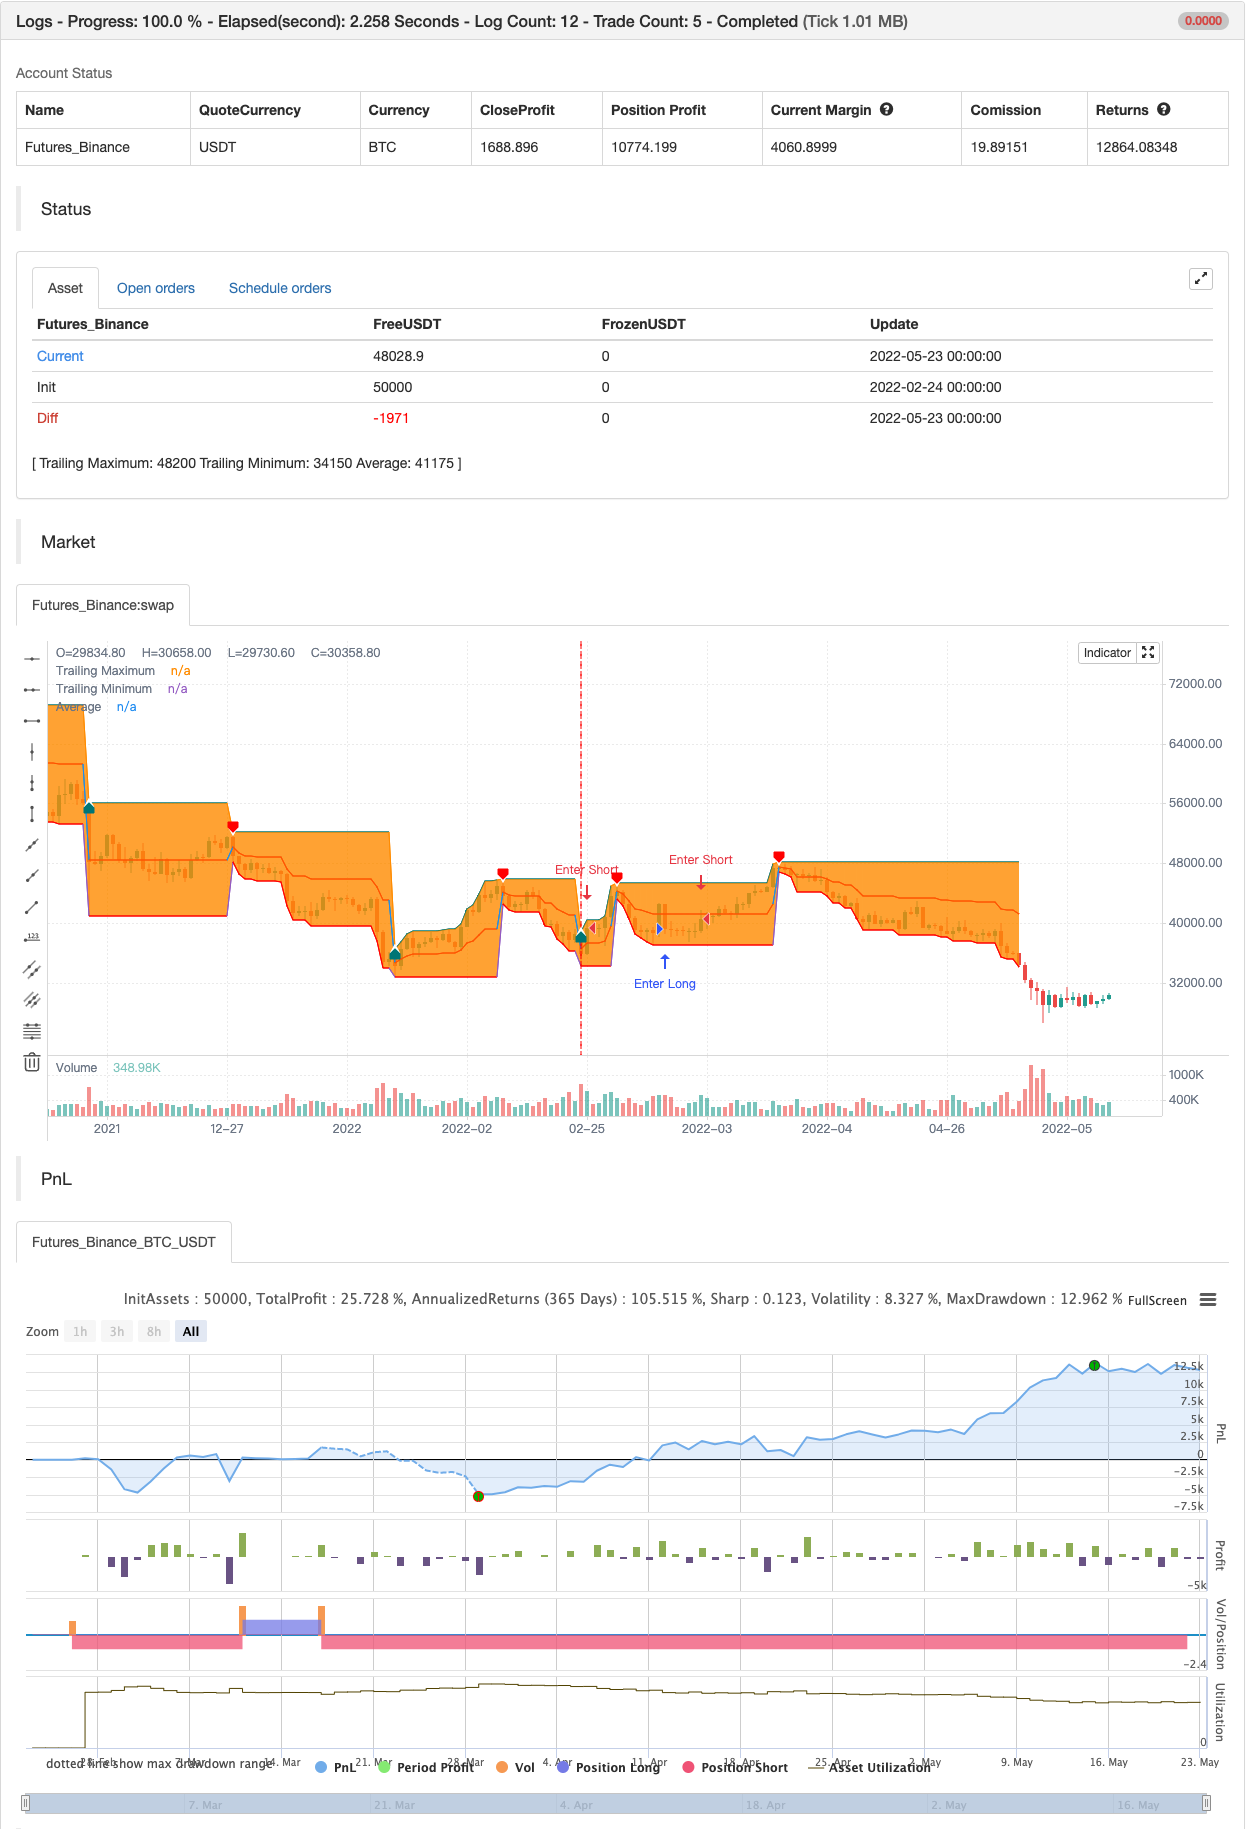
Cet indicateur renvoie les niveaux de soutien et de résistance passés et actuels et leur réinitialisation moyenne à l'occasion d'un point pivot haut/bas.
Paramètres
Longueur: détermine le pivot haut/bas lookback, avec des valeurs plus élevées permettant de détecter des sommets et des fonds à plus long terme.
Utilisation
une capture
L'indicateur peut mettre en évidence les points de support et de résistance - ce sont des points où le prix rebondit de la ligne moyenne. Ces points peuvent éventuellement être utilisés pour tracer des lignes de tendance.
une capture
Le maximum/minimum et leur moyenne s'étendent jusqu'à la barre la plus récente, ce qui permet des applications en temps réel de l'indicateur.
En outre, les utilisateurs peuvent facilement analyser les tendances passées et déterminer leur type en observant le comportement maximum/minimum.
une capture
La fréquence de nouveaux hauts et bas peut également aider à déterminer la tendance haussière et baissière.
test de retour
/*backtest
start: 2022-02-24 00:00:00
end: 2022-05-23 23:59:00
period: 1d
basePeriod: 1h
exchanges: [{"eid":"Futures_Binance","currency":"BTC_USDT"}]
*/

// This work is licensed under a Attribution-NonCommercial-ShareAlike 4.0 International (CC BY-NC-SA 4.0) https://creativecommons.org/licenses/by-nc-sa/4.0/
// © LuxAlgo

//@version=5
indicator("Pivot Based Trailing Maxima & Minima [LUX]",overlay=true,max_bars_back=500,max_lines_count=500)
length = input.int(14,minval=2,maxval=500)

max_color = input.color(color.teal,'Trailing Maximum Color',group='Style')
min_color = input.color(color.red,'Trailing Minimum Color',group='Style')
avg_color = input.color(#ff5d00,'Trailing Maximum Color',group='Style')

bull_fill = input.color(color.new(color.teal,80),'Uptrend Area',group='Style')
bear_fill = input.color(color.new(color.red,80),'Downtrend Area',group='Style')
//----
var max = 0.
var min = 0.

ph = ta.pivothigh(length,length)
pl = ta.pivotlow(length,length)

if ph or pl
    max := high[length]
    min := low[length]

max := math.max(high[length],max)
min := math.min(low[length],min)

avg = math.avg(max,min)

//----
plot1 = plot(max,'Trailing Maximum',ph or pl ? na : max_color,1,plot.style_linebr,offset=-length)
plot2 = plot(min,'Trailing Minimum',ph or pl ? na : min_color,1,plot.style_linebr,offset=-length)

fill_css = fixnan(ph ? bear_fill : pl ? bull_fill : na)
fill(plot1,plot2,ph or pl ? na : fill_css)

plot(avg,'Average',ph or pl ? na : avg_color,1,plot.style_linebr,offset=-length)

plotshape(pl ? pl : na,"Pivot High",shape.labelup,location.absolute,max_color,-length,text="▲",textcolor=color.white,size=size.tiny)
plotshape(ph ? ph : na,"Pivot Low",shape.labeldown,location.absolute,min_color,-length,text="▼",textcolor=color.white,size=size.tiny)

// //----
// n = bar_index

// max_prev = max
// min_prev = min
// avg_prev = avg
// max2 = max
// min2 = min

// if barstate.islast
//     for line_object in line.all
//         line.delete(line_object)

//     for i = 0 to length-1
//         max2 := math.max(high[length-1-i],max_prev)
//         min2 := math.min(low[length-1-i],min_prev)
//         avg2 = math.avg(max2,min2)

//         line1 = line.new(n-(length-i),max_prev,n-(length-1-i),max2,color=max_color)
//         line2 = line.new(n-(length-i),min_prev,n-(length-1-i),min2,color=min_color)
//         linefill.new(line1,line2,color.new(fill_css,80))

//         line.new(n-(length-i),avg_prev,n-(length-1-i),avg2,color=avg_color)

//         max_prev := max2
//         min_prev := min2
//         avg_prev := avg2


if pl
    strategy.entry("Enter Long", strategy.long)
else if ph
    strategy.entry("Enter Short", strategy.short)
- Indicateur de divergence RSI
- Tendance de pivot
- Différence de volume
- Supertendance du point pivot
- Points de pivotement haut bas multi-temps
- Stratégie de super-tendance à pivot dynamique
- Blocs d'ordre pivot
- Retours mensuels dans les stratégies PineScript
- 72s: moyenne mobile de la coque adaptative +
- Scalping EMA ADX RSI avec achat/vente
- Différence de volume
- Super Tendance quotidienne 2.0 BF
- Commerçant de swing moyen en mouvement
- FTSMA - Trend est votre ami
- Filtre de gamme Acheter et vendre
- Le canal SSL
- Stratégie de la suite Hull
- SAR parabolique acheter et vendre
- Nick Rypock à l'envers
- Stratégie de l'appareil photo ZigZag V4.1
- Achat/Vente au cours de la journée
- Fractal brisé: le rêve brisé de quelqu'un est votre profit!
- Maximisateur de bénéfices PMax
- Une stratégie de victoire sans faille
- Stochastique + RSI, stratégie double
- Stratégie Swing Hull/rsi/EMA
- Outil de négociation Swing de scalping R1-4
- Meilleure stratégie d' engloutissement + de rupture