Analyse de la stratégie de trading par régression de canal

[trans]
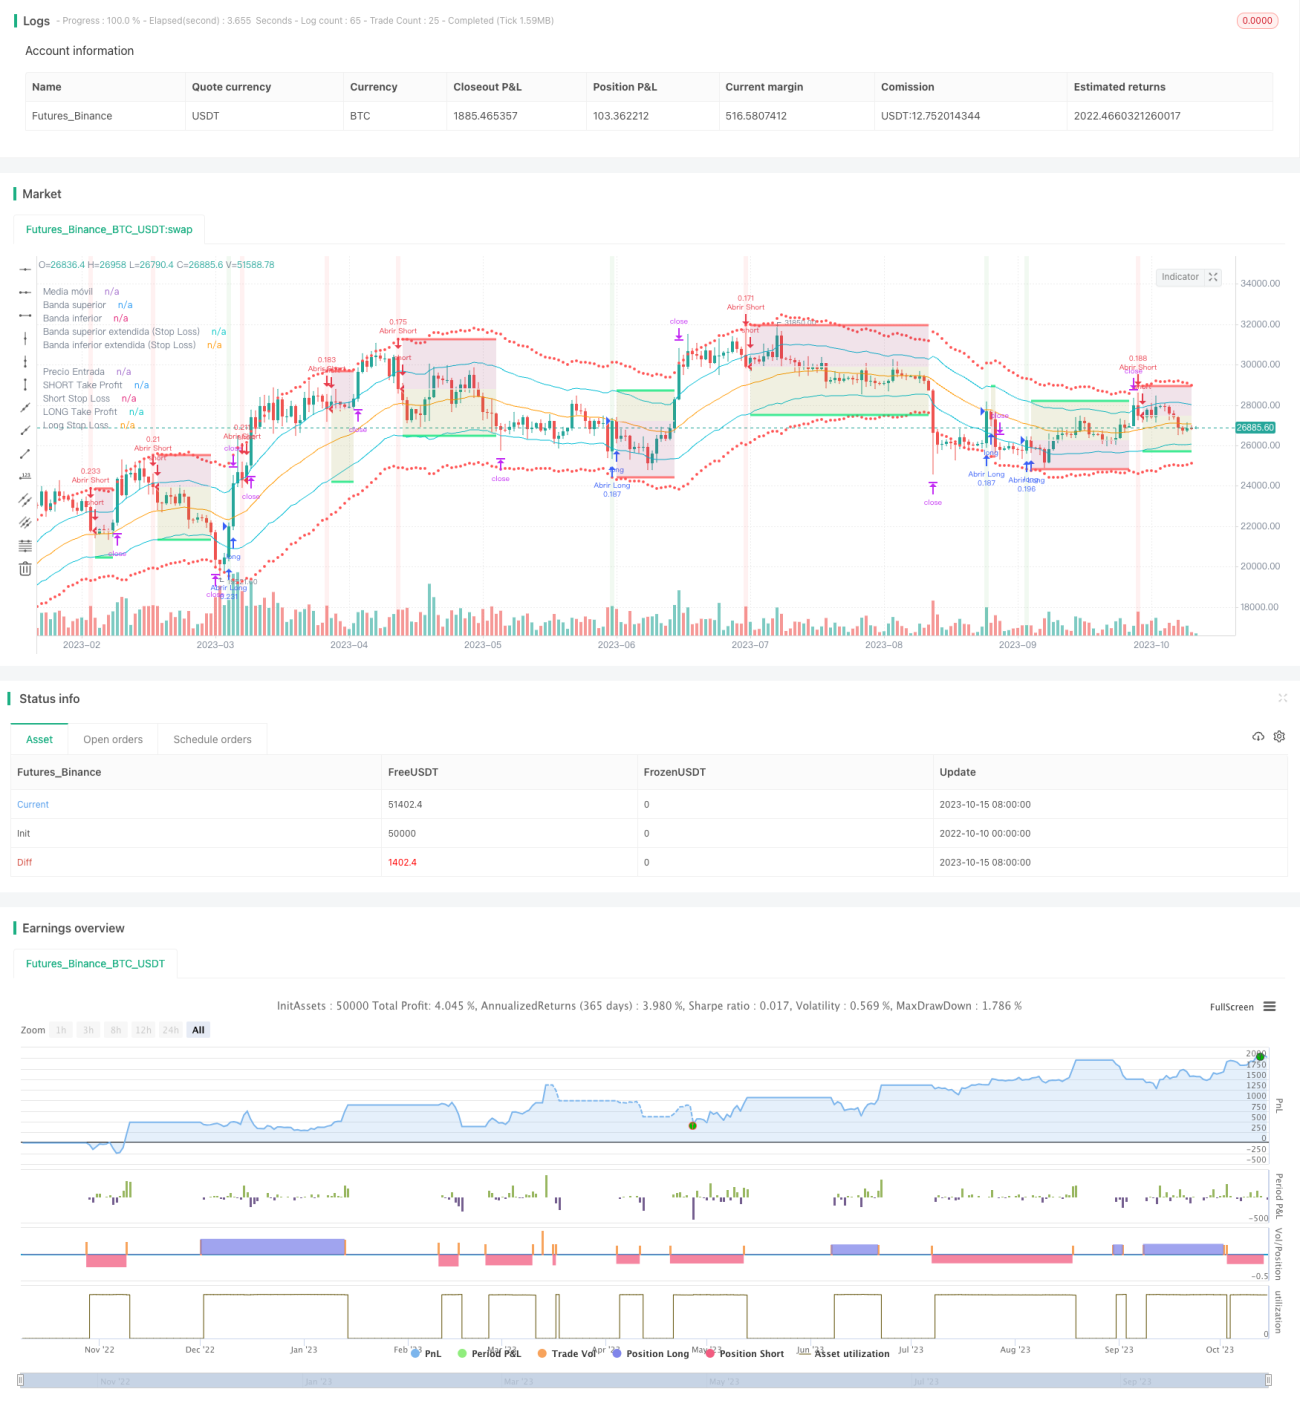
Aperçu
La stratégie est basée sur les canaux Brin Belt et Kentner pour effectuer des transactions de canaux de prix. Elle utilise les caractéristiques d'un retour à l'intérieur d'un canal après que les prix aient franchi la frontière de la chaîne ascendante et descendante pour identifier les opportunités de négociation. La stratégie offre une variété d'options personnalisées qui vous permettent de faire des ajustements en fonction des actifs et des cycles de temps.
Principe de stratégie
La stratégie comprend principalement les éléments clés suivants:
-
Sélection de l'indicateur du canalLa bande de Brin ou la voie de Kentner
-
Conditions d'entrée: prix de rupture de la ligne de limite du canal, et si la clôture de la ligne K inférieure est demandée pour revenir dans le canal
-
Comment arrêter les pertes: ligne de front K, élargissement de la frontière de la voie, arrêt ATR
-
La méthode d'arrêtLes limites des voies latérales, les voies intermédiaires et les arrêts ATR
-
Autres configurationsLe problème est que les gens ne peuvent pas se connecter à Internet et ne peuvent pas se connecter à Internet.
Grâce à cette combinaison, la stratégie permet de déterminer les meilleurs moments d'entrée et de sortie en fonction de la dynamique des conditions du marché.
Analyse des avantages
La stratégie présente les avantages suivants par rapport à la stratégie de stop loss mobile fixe:
-
Les canaux permettent de mieux saisir les points de basculement de la tendance du marché grâce à leur capacité à contenir les fluctuations de prix.
-
La richesse des modes de stop-loss est combinée de manière arbitraire pour une configuration optimale selon les variétés et les cycles.
-
Les opérations de régression de rupture basées sur les indicateurs de passage permettent d'utiliser les secousses de petite portée pour engloutir les fonds de l'adversaire.
-
Le stop-loss calculé par l'ATR s'adapte automatiquement à la volatilité du marché et présente l'avantage d'une grande adaptabilité.
-
Il permet d'ajuster dynamiquement les arrêts pour exploiter pleinement l'espace supplémentaire de fonctionnement possible.
Analyse des risques
La stratégie présente principalement les risques suivants:
-
Dans les marchés à forte tendance, le blocage peut être désactivé, ce qui peut entraîner l'activation d'un stop.
-
Lorsqu'un marché est très volatile, l'ATR est calculé à partir d'une distance d'arrêt et de perte excessive, ce qui peut entraîner une expansion des pertes. Il est possible d'envisager de réduire le coefficient ATR.
-
Dans des conditions de choc, les prix peuvent souvent déclencher des transactions trop fréquentes à la frontière des canaux. L'entrée ne peut être envisagée que si la clôture est franchie.
-
En cas de revers, le blocage de l'ajustement dynamique peut entraîner des pertes. Il est recommandé de se retirer près des points critiques de support / résistance.
Direction d'optimisation
Cette stratégie peut encore être optimisée dans les domaines suivants:
-
Les paramètres de différents cycles de calcul de l'ATR sont testés pour déterminer l'impact du maximum de rétractation sur la stratégie.
-
Le test inclut des indicateurs de tendance et interrompt la négociation si la tendance n'est pas évidente.
-
Testez la règle de négociation JOIN et réduisez vos positions à proximité des zones de pression de soutien importantes.
-
Il est nécessaire d'augmenter les mesures de contrôle des volumes de transactions pour éviter des pertes monétaires excessives.
-
Tests d'optimisation des paramètres pour des variétés spécifiques, à la recherche d'une combinaison optimale de paramètres.
Résumer
Cette stratégie est généralement une stratégie de trading de reprise de rupture basée sur les indicateurs de la voie. Elle offre de nombreuses options de configuration qui peuvent être ajustées en fonction des différentes conditions du marché. L'avantage est de pouvoir saisir le moment où le marché se retourne, avec des caractéristiques de flexibilité.
||
Overview
This strategy is based on price channel trading using Bollinger Bands and Keltner Channels. It identifies trading opportunities by the characteristic of price bouncing back after breaking through the upper or lower channel boundary lines. The strategy provides multiple customizable options to refine it for your asset and timeframe.
Strategy Logic
The key components of this strategy are:
-
Channel Indicator: Bollinger Bands or Keltner Channels
-
Entry Conditions: Price breakout of channel boundary, with option to require reversion back inside on next candle close
-
Stop Loss: Previous candle's wick, extended channel bands, ATR stop loss
-
Take Profit: Opposite channel bands, channel midline, ATR take profit
-
Other Configurations: Long only, short only, dynamic take profit adjustment etc.
With the above combinations, the strategy dynamically determines optimal entry and exit points according to market conditions.
Advantage Analysis
Compared to fixed moving stop/take profit strategies, this strategy has the following advantages:
-
Utilizes the capability of channels to contain price fluctuations, more accurately capturing trend reversal points.
-
Diverse stop loss and take profit options allow best configuration for different assets and timeframes.
-
Breakout and reversion operations based on channel indicators can leverage small range oscillations to absorb opponent's funds.
-
ATR-calculated stop/take profit distances automatically adjust to market volatility.
-
Allowing dynamic take profit adjustment fully exploits potential additional running space.
Risk Analysis
The main risks of this strategy are:
-
In strong trending markets, channel failure may trigger stop loss. Stop loss distance can be loosened.
-
With high volatility, ATR calculated stop/take profit distances may be too wide, enlarging losses. Consider reducing ATR coefficient.
-
In ranging markets, frequent channel boundary touches may cause over-trading. Consider entry on close breakouts only.
-
Severe reversals may hit take profit before stop loss with dynamic adjustment. Exits near key S/R levels recommended.
Optimization Directions
This strategy can be further optimized by:
-
Testing ATR period parameters for impact on max drawdown.
-
Incorporating trend indicators to pause trading when trend is unclear.
-
Testing JOIN reversion techniques to reduce position size near key S/R zones.
-
Adding trading size controls to limit single trade loss.
-
Parameter optimization for specific assets to find optimal parameter combinations.
Summary
In summary, this is a channel breakout and reversion strategy. It provides rich configuration options for various market environments. The advantages are capturing reversal points and flexibility. But beware of stop loss invalidation in strong trends. Future optimizations on trend, risk control etc. will improve practicality.
- 1