Stratégie de trading bidirectionnelle basée sur RSI et SuperTrend
Aperçu
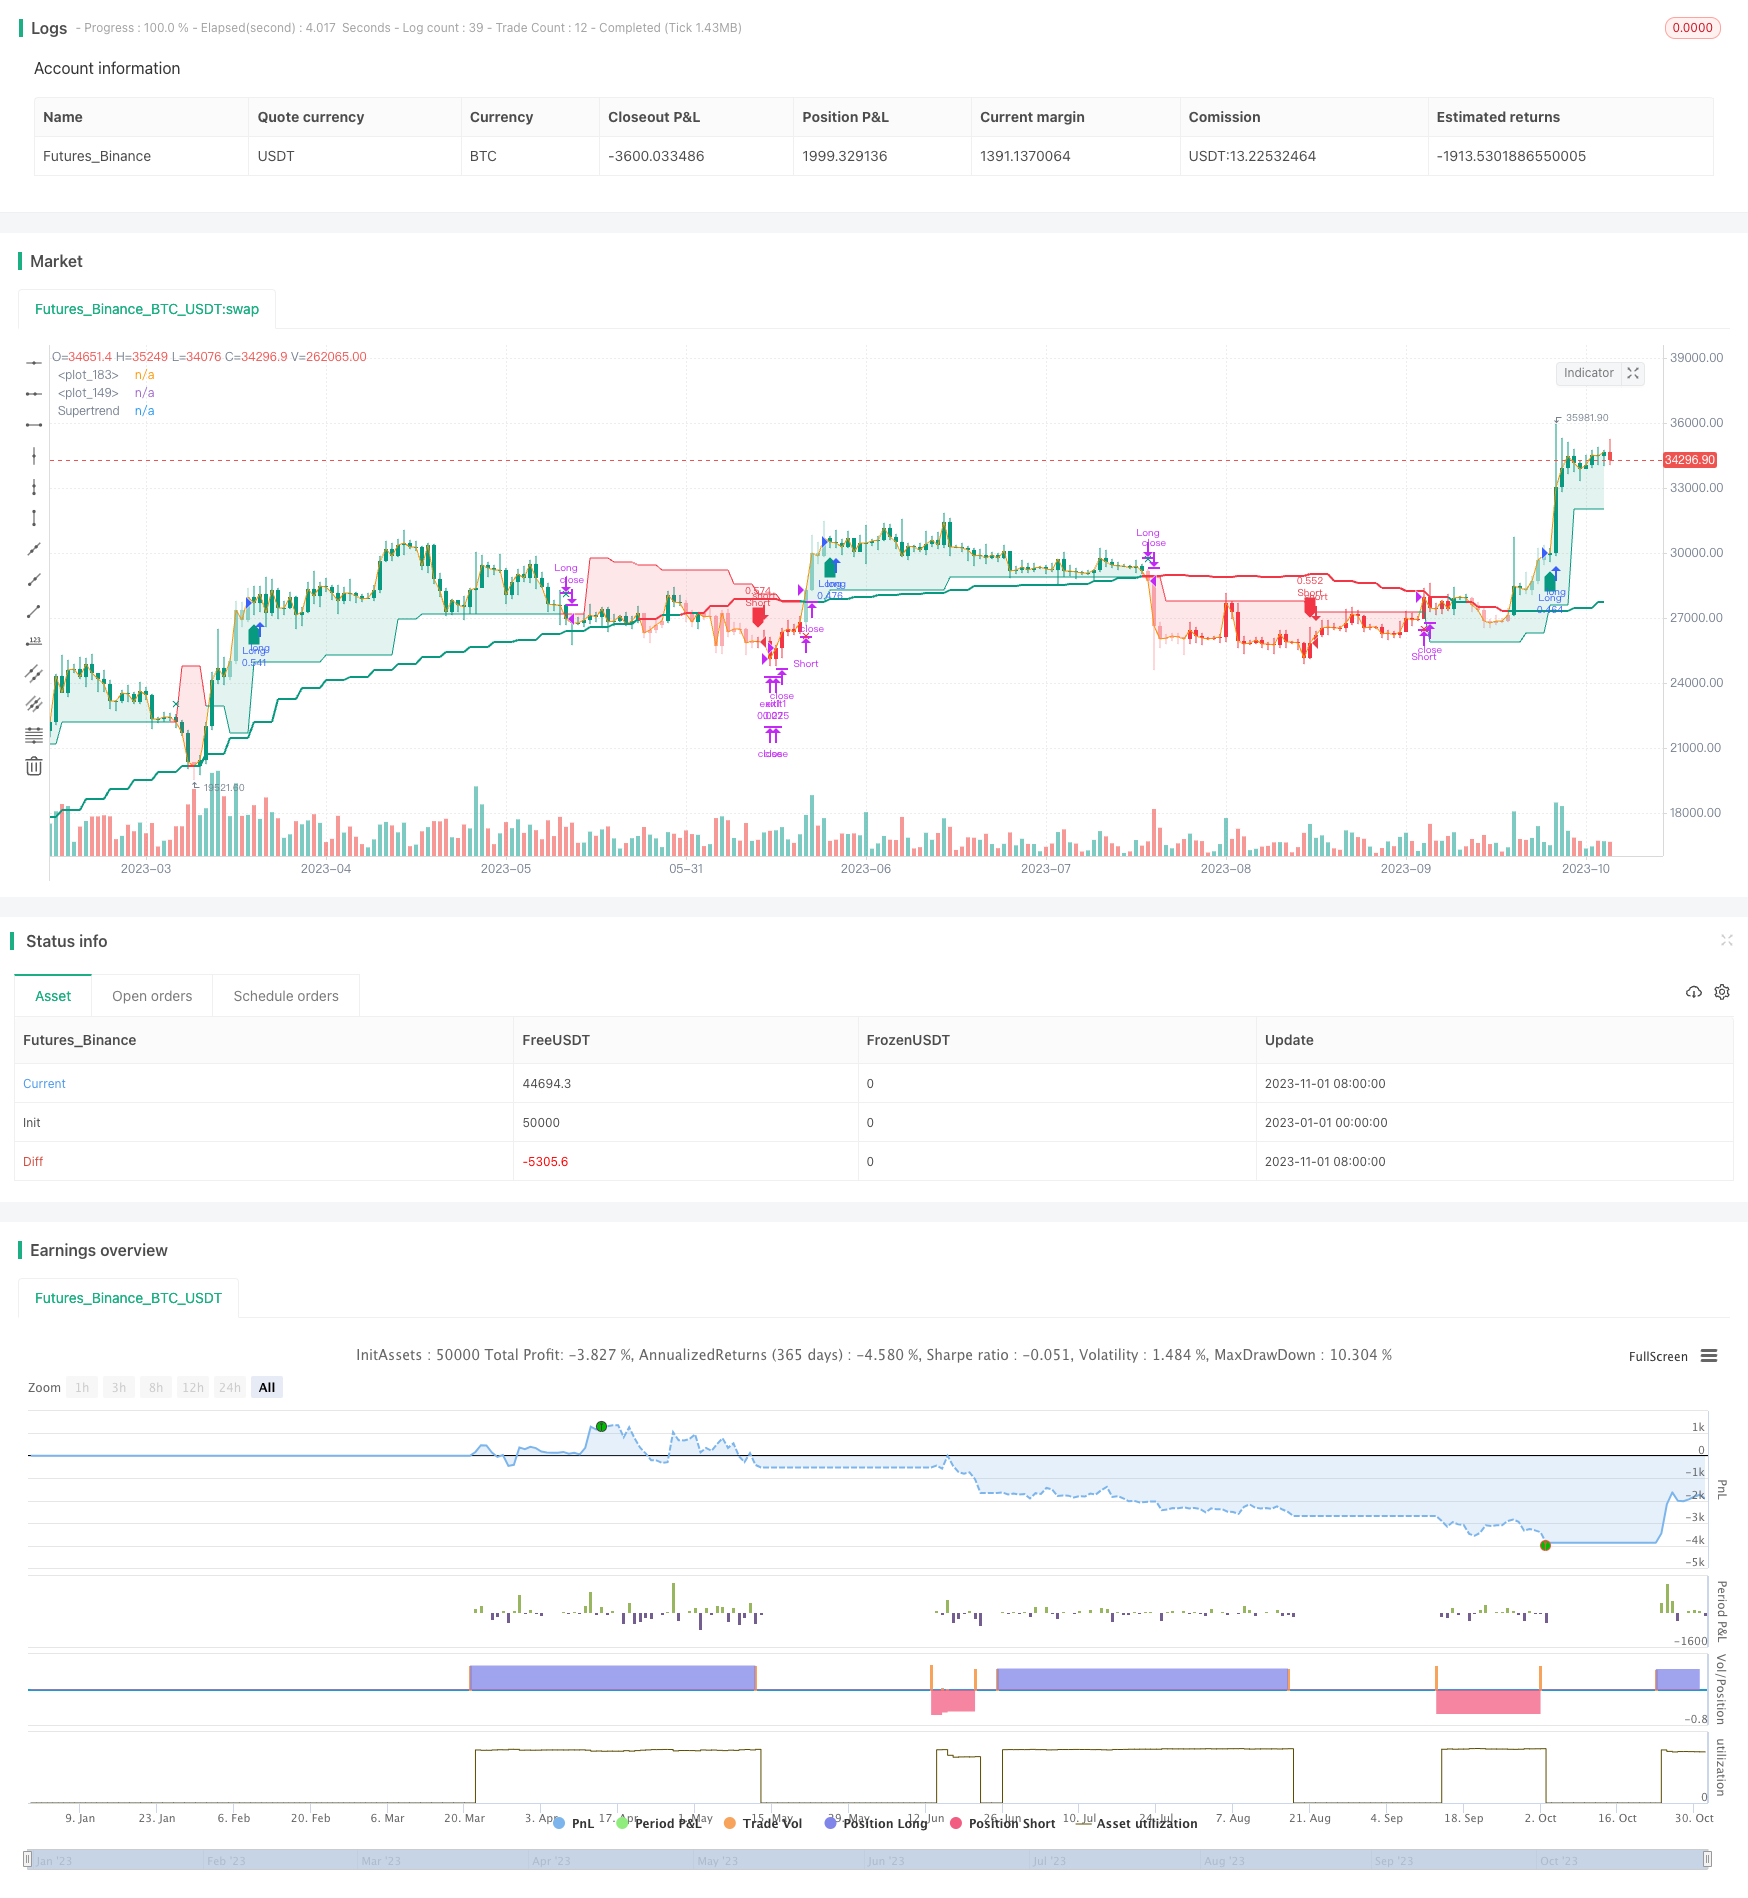
Il s’agit d’une stratégie de trading bidirectionnelle qui utilise l’indicateur RSI et l’indicateur SuperTrend. Cette stratégie vise à identifier les points forts et les points faibles du marché et à changer de position en temps opportun lorsque la direction de la tendance change pour obtenir des gains plus élevés.
Principe de stratégie
La stratégie est basée sur les principes suivants:
L’indicateur RSI est utilisé pour déterminer la force et la faiblesse du marché actuel. Un RSI supérieur à 50 est considéré comme un marché fort et un RSI inférieur à 50 est considéré comme un marché faible.
L’indicateur SuperTrend est utilisé comme filtre de tendance. Un signal de transaction n’est émis que lorsque le prix franchit la SuperTrend.
Lorsque l’indicateur RSI émet un signal fort, si le prix dépasse la trajectoire, faites-en plus; si le prix dépasse la trajectoire, faites-le.
Lorsque l’indicateur RSI émet un signal de faiblesse, le cours est mis en pause si le cours dépasse la trajectoire descendante; le cours est mis en pause si le cours dépasse la trajectoire descendante.
La conversion plurichomique de l’indicateur RSI permet de capturer les points de changement de tendance et d’effectuer des opérations de changement de position en temps opportun.
Mise en œuvre
Le RSI est calculé sur une longueur de 14, avec 50 comme limite de force et de faiblesse.
Calculer l’indicateur SuperTrend, dont la longueur est de 10, multiplié par 2 .
Faire plus lorsque le RSI est supérieur à 50 et que le prix franchit la trajectoire de la SuperTrend. Faire plus lorsque le RSI est inférieur à 50 et que le prix franchit la trajectoire de la SuperTrend.
Une fois que vous avez fait plus, si le RSI s’affaiblit et que le prix tombe en dessous de la trajectoire de la SuperTrend, vous êtes à plat. Une fois que vous avez fait le short, si le RSI s’intensifie et que le prix franchit la trajectoire de la SuperTrend, vous êtes à plat.
Il peut être configuré pour fonctionner uniquement en surcharge ou en surcharge.
Avantages stratégiques
Cette stratégie, qui combine le suivi de la tendance et le jugement de sur-achat et de sur-vente, présente les avantages suivants:
Il est possible de saisir les changements de tendance en temps opportun et de réduire les risques inutiles.
L’indicateur RSI est un bon indicateur pour détecter les zones de sur-achat et de sur-vente et éviter de courir après les hauts et les bas avant que le marché ne se retourne.
SuperTrend est un excellent filtrage du bruit du marché, qui suit les tendances de la ligne médiane et longue.
La combinaison des deux indicateurs RSI et SuperTrend peut améliorer la stabilité de la stratégie.
Les paramètres de la stratégie ont une grande marge d’optimisation et peuvent être ajustés en fonction des variétés et des cycles.
Le support de la fonction “faire plus” ou “faire moins” permet une flexibilité pour différents types de situations.
Risque stratégique
Cette stratégie comporte aussi des risques:
L’indicateur RSI est susceptible de générer de faux signaux et doit être vérifié par la vérification des prix.
Une mauvaise configuration des paramètres de l’indicateur de SuperTrend peut entraîner des points de fuite ou une poursuite de la hausse contre la baisse.
Il existe un risque de dispersion dans les combinaisons de deux indices et il est nécessaire d’ajuster les paramètres pour qu’ils correspondent au mieux.
Si la situation change radicalement, le stop-loss peut être décalé et il est nécessaire d’établir une position de stop-loss raisonnable.
Évitez les dépôts inversés à proximité des zones de résistance importantes.
Optimisation de la stratégie
Cette stratégie peut également être optimisée par:
Ajustez les paramètres RSI pour trouver la longueur optimale afin de filtrer les faux signaux.
Optimiser les paramètres de SuperTrend pour améliorer le suivi des tendances.
Test de combinaisons de paramètres pour différents cycles de différentes variétés pour trouver le paramètre optimal.
L’ajout de filtres pour d’autres indicateurs, tels que MACD, KDJ, etc., améliore la précision du signal.
Ajouter des supports importants comme les points de résistance, les lignes de Brin, les moyennes mobiles, les jugements et les signaux stratégiques qualitatifs.
Optimiser les stratégies d’arrêt des pertes en réduisant le plus possible la probabilité que les pertes d’arrêt soient éliminées, dans la mesure où l’efficacité de l’arrêt des pertes est garantie.
Résumer
La stratégie intègre les avantages des deux indicateurs RSI et SuperTrend, permettant d’identifier efficacement les changements de tendance à moyen terme du marché et de faire des opérations de commutation entre les marchés baissiers et les marchés haussiers. Par l’optimisation des paramètres, elle peut s’adapter à une situation de marché plus large.
/*backtest
start: 2023-01-01 00:00:00
end: 2023-11-02 00:00:00
period: 1d
basePeriod: 1h
exchanges: [{"eid":"Futures_Binance","currency":"BTC_USDT"}]
*/

// This source code is subject to the terms of the Mozilla Public License 2.0 at https://mozilla.org/MPL/2.0/
//@version=5
//Created by @CITIAlgo
// —————————————————————————————————————————————————————————————————————————————————————————————————————————

strategy('CITI Trends A with RSI Candles', shorttitle = "CITI Trends A" , overlay = true ,
         initial_capital   = 10000,
         commission_value  = 0.025,
         default_qty_value = 25,
         slippage          = 1,
         pyramiding        = 0,
         max_lines_count   = 500,
         max_labels_count  = 500,
         currency          = currency.USD,
         default_qty_type  = strategy.percent_of_equity)

bullColor1 =  #089981
bearColor1 =  #f23645
bullColor2 =  #3873e3
bearColor2 =  #630ef5
neutralColor1 = #d5d5d5

//Base Settings
groupBase = "Base Settings ---------------------------------------"
Repaint_type = input.string('Non-Repainting', "Allow Repainting ?", options = ['Non-Repainting', 'Repainting'], inline ='repaint' , group = groupBase , tooltip = 'The default value is Non-Repainting. To learn more visit https://www.tradingview.com/pine-script-docs/en/v5/concepts/Repainting.html')

//Configure trade direction
tradeDirection = input.string("Both", title="Trade Direction", options=["Long", "Short", "Both"] , group=groupBase , inline = 'Type' )

longOK  = tradeDirection == "Long" or tradeDirection == "Both"
shortOK = tradeDirection == "Short" or tradeDirection == "Both"

var bool PlotEntries = input.bool (true, "Show Entries" ,group=groupBase , inline = 'Signals' )
var bool PlotExits = input.bool (true, "Show Exits" , group=groupBase, inline = 'Signals' )

//Display Settings
groupDisplay = "Display Settings ------------------------------------"

MomBars = input.bool( true , title="Apply Bar Colors", inline = 'candles' , group=groupDisplay)

cbullColor = input.color( bullColor1  , 'Candle Colors' ,  inline = 'candles1a',group=groupDisplay)
cbearColor =  input.color( bearColor1  , '' ,  inline = 'candles1a',group=groupDisplay)

//Candle & label Colors
Bullish_Bars    = color.new( cbullColor , 0)
WBullish_Bars   = color.new( cbullColor , 60)
Bearish_Bars    = color.new( cbearColor , 0)
WBearish_Bars   = color.new( cbearColor , 60)

lbullColor = input.color( bullColor1  , 'Long/Short Labels' ,  group=groupDisplay, inline = 'Signals1' )
lbearColor =  input.color( bearColor1 , ''  , group=groupDisplay, inline = 'Signals1' )

st_status = input.bool( true , title="Show Supertrend", inline = 'st' , group=groupDisplay)
st_bullColor = input.color( bullColor1  , '' ,  group=groupDisplay, inline = 'st' )
st_bearColor =  input.color( bearColor1 , ''  , group=groupDisplay, inline = 'st' )

//Build Your Signals Settings
groupEntry = " Trend & Signal Settings---------------------"
Entry1a = input.bool(true, title= "Entry", inline='entry1a', group=groupEntry)
Exit1a  = input.bool(false, title= "Exit | Strong/Weak Momentum", inline='entry1a', group=groupEntry)
Entry1b = input.bool(false,  title=  'Entry'  , inline='entry1b', group=groupEntry)
Exit1b  = input.bool(false, title= 'Exit | Bull/Bear Momentum'  , inline='entry1b', group=groupEntry)

Entry3a = input.bool(false, title= "Filter", inline='entry3a', group=groupEntry)
Exit3a  = input.bool(false, title= "Exit | MA ", inline='entry3a', group=groupEntry)

Entry4a = input.bool(false, title= "Filter | Disable RSI Ranges ", inline='entry4a', group=groupEntry)
Entry4b = input.bool(true, title= "Filter", inline='entry4b', group=groupEntry)
Exit4b  = input.bool(true, title= "Exit | Supertrend ", inline='entry4b', group=groupEntry)
Entry4c = input.bool(true, title= "Filter | Disable Supertrend Ranges ", inline='entry4c', group=groupEntry)
// —————————————————————————————————————MTF FUNCTIONS
// —————————— PineCoders MTF Selection Framework functions
// ————— Converts current "timeframe.multiplier" plus the TF into minutes of type float.
f_resInMinutes() =>
    _resInMinutes = timeframe.multiplier * (timeframe.isseconds ? 1. / 60. : timeframe.isminutes ? 1. : timeframe.isdaily ? 1440. : timeframe.isweekly ? 10080. : timeframe.ismonthly ? 43800. : na)
    _resInMinutes

// Get current resolution in float minutes.
var ResInMinutes = f_resInMinutes()

// ————— Returns resolution of _resolution period in minutes.
f_tfResInMinutes(_res) =>
    // _res: resolution of any TF (in "timeframe.period" string format).
    request.security(syminfo.tickerid, _res, f_resInMinutes())

// ————— Returns a multiple of current resolution as a string in "timeframe.period" format usable with "security()".
f_multipleOfRes(_res, _mult) =>
    // _res:  current resolution in minutes, in the fractional format supplied by f_resInMinutes() companion function.
    // _mult: Multiple of current TF to be calculated.
    // Convert current float TF in minutes to target string TF in "timeframe.period" format.
    _targetResInMin = _res * math.max(_mult, 1)
    // Find best string to express the resolution.
    _targetResInMin <= 0.083 ? '5S' : _targetResInMin <= 0.251 ? '15S' : _targetResInMin <= 0.501 ? '30S' : _targetResInMin <= 1440 ? str.tostring(math.round(_targetResInMin)) : _targetResInMin <= 43800 ? str.tostring(math.round(math.min(_targetResInMin / 1440, 365))) + 'D' : str.tostring(math.round(math.min(_targetResInMin / 43800, 12))) + 'M'

// ————— Converts current resolution
f_resInString(_res) =>
    // _res: resolution of any TF (in "timeframe.period" string format).
      _res  == "1"   ? "1m"  :
      _res  == "3"   ? "3m"  :
      _res  == "5"   ? "5m"  :
      _res  == "15"  ? "15m" :
      _res  == "30"  ? "30m" :
      _res  == "45"  ? "45m" :
      _res  == "60"  ? "1h"  :
      _res  == "120" ? "2h"  :
      _res  == "180" ? "3h"  :
      _res  == "240" ? "4h"  :
      _res  == "1D"  ? "D"   :
      _res  == "1W"  ? "W"   :
      _res  == "1M"  ? "M"   : _res

//Set repaint security function
repaint_sw = Repaint_type == 'Non-Repainting' ? false : true
f_security(_symbol, _res, _src, _repaint) => request.security(_symbol, _res, _src[_repaint ? 0 : barstate.isrealtime ? 1 : 0] , barmerge.gaps_off, barmerge.lookahead_on)[_repaint ? 0 : barstate.isrealtime ? 0 : 1]
f_source(_res , source) => f_security(syminfo.tickerid , _res , source , repaint_sw )

Type1 = 'Auto Multiplied TF'
Type2 = 'Fixed TF'
//---------------------------------------------------------------------------
//RSI Settings // INPUTS
groupRange   = "RSI Settings  ----------------------------------"

TF1type = input.string( Type1, 'TF' ,  options=[Type1,Type2] , inline ='tf1' , group=groupRange)
setHTF1a = input.int( 4 , '' , inline ='tf1', group=groupRange)
setHTF1b = input.timeframe( 'D' , '' , inline ='tf1', group=groupRange)
// Get HTF from user-defined mode.
var TF1 = TF1type == Type1 ? f_multipleOfRes(ResInMinutes, setHTF1a) : setHTF1b

mLength    =  input.int( 14  ,  "RSI Length"  ,inline='lines', group=groupRange)
BullLevel  = input.int( 50 ,  "Bullish Level | Above 50       ",inline='lines1a', group=groupRange)
BearLevel  = input.int( 50 , "Bearish Level | Below 50        ",inline='lines1b', group=groupRange)

ma_length  = input.int( 21  ,  "MA Length"  ,inline='ma', group=groupRange)
ma_status  = input.bool( true ,  "Show MA" ,inline='ma1', group=groupRange)
ma_bullColor = input.color( bullColor1  , '' ,  inline='ma1', group=groupRange)
ma_bearColor =  input.color( bearColor1 , ''  , inline='ma1', group=groupRange)
//--------------------------------------------------------------------------
//Momentum Calculations
f_momTF( _tf ) =>
    _isShow =  f_tfResInMinutes(_tf) >= f_resInMinutes()
    close_ = f_source(_tf , close)
    rsi_ = _isShow ? f_security(syminfo.tickerid , _tf, ta.rsi( close_, mLength) , repaint_sw) : na
    ma = _isShow ? f_security(syminfo.tickerid , _tf, ta.vwma( hlc3 , ma_length ) , repaint_sw) : na
    [rsi_ , ma]

[ rsi , ma ] = f_momTF(TF1)

ma_color = close > ma ? ma_bullColor : ma_bearColor
plot( ma_status ? ma : na , color = ma_color , linewidth = 2 , style = plot.style_line)
//---------------------------------------------------------------------------
//Supertrend Settings // INPUTS
groupST   = "Supertrend Settings  ----------------------------------"

TF2type = input.string( Type1, 'TF' ,  options=[Type1,Type2] , inline ='tf2' , group=groupST)
setHTF2a = input.int( 4 , '' , inline ='tf2', group=groupST)
setHTF2b = input.timeframe( 'D' , '' , inline ='tf2', group=groupST)
// Get HTF from user-defined mode.
var TF2 = TF2type == Type1 ? f_multipleOfRes(ResInMinutes, setHTF2a) : setHTF2b

stLength =  input.int( 10  ,  "Supertrend Length"  ,inline='lines', group=groupST)
stmult =  input.int( 2  ,  "Mult"  ,inline='lines', group=groupST)
stHighlights        = input.bool( true ,  "Highlights",inline='lines1a', group=groupST)

f_st( _tf) =>
    _isShow =  f_tfResInMinutes(_tf) >= f_resInMinutes()
    close_ = f_source(_tf , close)
    atr= f_security(syminfo.tickerid , _tf, ta.atr(stLength) , repaint_sw)
    Up=close_ -(stmult*atr)
    Dn=close_ +(stmult*atr)
    TrendUp = 0.0
    TrendUp := close_[1]>TrendUp[1] ? math.max(Up,TrendUp[1]) : Up
    TrendDown = 0.0
    TrendDown := close_[1]<TrendDown[1]? math.min(Dn,TrendDown[1]) : Dn
    Trend = 0.0
    Trend := close_ > TrendDown[1] ? 1: close_< TrendUp[1]? -1: nz(Trend[1],1)
    stLine = Trend==1? TrendUp: TrendDown
    [Trend, stLine]
[Trend, stLine] = f_st( TF2 )

stTrend = close > stLine ? 1:-1
stplot = plot( st_status? stLine : na , color=  stTrend ==1 ? st_bullColor : st_bearColor , linewidth=1 ,title ="Supertrend")

priceLineP = plot( close , color=  na , linewidth=1 , display = display.none)
fill(priceLineP , stplot , color = stHighlights ? stTrend ==1 ? color.new(st_bullColor , 85) : color.new( st_bearColor , 85 ) : na )

//---------------------------------------------------------------------------
//Momentum BarColors

mom2a = rsi > BullLevel  ? Bullish_Bars : WBullish_Bars
mom2b = rsi < BearLevel  ? Bearish_Bars : WBearish_Bars
mom2_color = close > ma ? mom2a : mom2b

mom_color = MomBars ? mom2_color : na
barcolor(mom_color)
//-------------------------------------------------
//Momentum Strength & Values
momVal2a = rsi > BullLevel  ? 2 : 1
momVal2b = rsi < BearLevel  ? -2 : -1
momVal2 = close > ma   ? momVal2a : momVal2b

momVal = momVal2

///==============================================================================================================
//Long Trend Conditions
Entry1aL = Entry1a ? momVal == 2 : true
Entry1bL = Entry1b ? momVal == 1 or momVal == 2 : true

Entry3aL = Entry3a ? close > ma : true
Entry4aL = Entry4a ? rsi > BullLevel : true
Entry4bL = Entry4b ? close > stLine : true
Entry4cL = Entry4c ? stLine > stLine[1] : true
//------
noEntry = Entry1a == false and Entry1b  == false and Entry3a == false and Entry4a == false and Entry4b == false and Entry4c == false ? false : true
noExit  = Exit1a == false and Exit1b == false and Exit3a == false  and Exit4b == false  ? false : true
//------
EntryL =  noEntry and Entry1aL and Entry1bL and Entry3aL and Entry4aL and Entry4bL and Entry4cL

Exit1aL = Exit1a ? momVal == 1 and momVal[1] == 2 : true
Exit1bL = Exit1b ? momVal == -1  or momVal == -2 : true
Exit3aL = Exit3a ? close < ma : true
Exit4bL = Exit4b ? close < stLine  : true

ExitL = noExit and Exit1aL  and Exit3aL and Exit1bL and Exit4bL

//Short Trend Conditions
Entry1aS = Entry1a ? momVal == -2 : true
Entry1bS = Entry1b ? momVal == -1 or momVal == -2 : true

Entry3aS = Entry3a ? close < ma  : true
Entry4aS = Entry4a ? rsi < BearLevel  : true
Entry4bS = Entry4b ? close < stLine  : true
Entry4cS = Entry4c ? stLine < stLine[1] : true

EntryS =  noEntry and Entry1aS and Entry1bS and Entry3aS  and Entry4aS and Entry4bS and Entry4cS

Exit1aS = Exit1a ? momVal == -1 and momVal[1] == -2 : true
Exit1bS = Exit1b ? momVal == 1 or momVal == 2 : true
Exit3aS = Exit3a ? close > ma : true
Exit4bS = Exit4b ? close > stLine : true

ExitS  = noExit and Exit1aS and Exit3aS and Exit1bS and Exit4bS

///==============================================================================================================
//Entry & exit conditions

isLong = false
isLong := nz(isLong[1], false)
isShort = false
isShort := nz(isShort[1], false)

goLong = not isLong and EntryL and not ExitL and longOK and barstate.isconfirmed
goShort = not isShort and EntryS and not ExitS and shortOK and barstate.isconfirmed
longExit = isLong and ExitL and barstate.isconfirmed
shortExit = isShort and ExitS and barstate.isconfirmed

if (goLong)
    isLong := true
    isShort := false

if (goShort)
    isLong := false
    isShort := true

if (longExit)
    isLong := false
if (shortExit)
    isShort := false

//------------------------------------------------------------------------------
// ——Backtester
grouptime           = 'Step 5 - 📆 Time Filter 📆-------------'
startTime      = input    (group=grouptime, title="Start Timeㅤㅤ", defval=timestamp('UTC 01 Jan 2020 00:00'),  inline="Start")
endTime        = input    (group=grouptime, title="End Time ㅤ ㅤ", defval=timestamp('UTC 31 Dec 2025 23:45'),  inline="End")

dateRange = true
//------------------------------------------------------------------------------
// Risk Managment
grouprisk               = 'Step 6 - Risk Management-------------'

takeprofit = input.bool(true,title = "TP Price %",group=grouprisk, inline="profit")
tppercent = input.float(1, '', group=grouprisk, inline="profit") / 100
q1 = input.int    (5 ,              "Quantity %",group=grouprisk , inline="profit")

stoploss = input.bool(false,title = "SL Price %",group=grouprisk, inline="loss")
stoppercent = input.float(5, '', group=grouprisk, inline="loss") / 100

// Determine where you've entered and in what direction
longtp = strategy.position_avg_price * (1 + tppercent)
longStop = strategy.position_avg_price * (1 - stoppercent)
shorttp = strategy.position_avg_price * (1 - tppercent)
shortStop = strategy.position_avg_price * (1 + stoppercent)

QTYMethod               = input.string ('EQUITY',        'Order Size',    group=grouprisk, inline=' ', options=['NONE', 'EQUITY', 'SIZE', 'CONTRACTS'])
useNetProfit            = input.bool   (true,            'Use Net Profit',     group=grouprisk, inline=' ', tooltip='Use Net Profit- On/Off the use of profit in the following trades. *Only works if the type is EQUITY')
riskPerc                = input.int    (30,              '🇪🇶🇺🇮🇹🇾 %',              group=grouprisk, inline='.', minval=1, maxval=100)
riskSize                = input.int    (10000,            '🇸🇮🇿🇪',                group=grouprisk, inline='.', minval=1)
riskCntr                = input.int    (1,               '🇨🇴🇳🇹🇷🇦🇨🇹🇸',           group=grouprisk, inline='.', minval=1, tooltip='Order Size: \nNone- Use the default position size settings in Tab "Properties". \nEquity% - per trade from the initial capital. \nSize- Fixed size amount of trade. \nContracts- The fixed amount of the deal in contracts. \n')

// —————— Order Size
eqty = switch QTYMethod
    'NONE'      => na
    'EQUITY'    => riskPerc / close
    'SIZE'      => riskSize / close
    'CONTRACTS' => riskCntr
//-----------------------------------------------------------------------------
// —————— Trade variables
entry        = strategy.position_avg_price
sizePos      = strategy.position_size
inLong       = sizePos > 0
inShort      = sizePos < 0
inTrade      = inLong or inShort
inPos        = (inLong and not inShort[1]) or (inShort and not inLong[1])
var ID       = 'TradeID'
var tpPrice  = float(na)
var slPrice  = float(na)

///==============================================================================================================
// ALERTS
groupalerts = 'Step 7 - Alerts & Bot Trading Settings-------------'

broker = input.string('Binance', "Broker", options=['Binance', 'Alpaca', 'Kucoin', '3Commas'], group=groupalerts, tooltip = 'Choose which type you are using to send the correct Json Alert message for entry and exit alerts.')
my_sym = input("FTMM/USDT", "Ticker", group = 'Cloud Function Server', tooltip = 'Only used with Alerts to fix ticker ID in json message. Some exchanges use the forward slash and some do not.')
my_pass = input('Passphrase', "Passphrase" , group = 'Cloud Function Server', tooltip = 'Only enter your Passphrase and nothing else goes here. Only needed when using a Cloud Function Server.')
i_alert_3CID_txt = input('Bot ID', "Bot ID", group =groupalerts, tooltip = 'Only enter your 3Commas Bot ID and nothing else goes here.')
i_alert_3CET_txt = input('Bot Email Token', title = 'Bot Email Token', group =groupalerts , tooltip = 'Only enter your 3Commas Bot Email Token and nothing else goes here.')

Alert='{"passphrase": "'+str.tostring(my_pass)+'","symbol": "'+ str.tostring(my_sym) +'","type":"market", "side":"{{strategy.order.action}}","amount":"{{strategy.order.contracts}}","price": "' + str.tostring(close) + '"}'
//---------------------------------------------------------------------------------
// JSON alert message used for 3Commas Bots
C3_EntryAlert ='{"message_type": "bot",  "bot_id": ' + i_alert_3CID_txt + ',  "email_token": "' + i_alert_3CET_txt + '", "delay_seconds": 0 }'
C3_ExitAlert ='{"action": "close_at_market_price_all",  "message_type": "bot",  "bot_id": ' + i_alert_3CID_txt + ',  "email_token": "' + i_alert_3CET_txt + '", "delay_seconds": 0}'
//---------------------------------------------------------------------------------
// JSON alert message used for setting up a Google Cloud Function Server works when using Alpaca Exchange
Alert_Alpaca = '{"symbol": "{{ticker}}", "quantity": "{{strategy.order.contracts}}", "side": "{{strategy.order.action}}", "order_type": "market", "time_in_force": "gtc", "passphrase": "' + str.tostring(my_pass) + '"}'

entryAlert = broker == 'Binance' ? Alert : broker == 'Alpaca' ? Alert_Alpaca : broker == 'Kucoin' ? Alert : C3_EntryAlert
exitAlert = broker == 'Binance' ? Alert : broker == 'Alpaca' ? Alert_Alpaca : broker == 'Kucoin' ? Alert : C3_ExitAlert
strategy.initial_capital = 50000
// —————— Entry's
goLongEntry = goLong and dateRange and barstate.isconfirmed
goShortEntry = goShort and dateRange and barstate.isconfirmed

eqty(qty) => QTYMethod=='EQUITY' ? qty / 100 * (strategy.initial_capital + (useNetProfit ? strategy.netprofit : 0)) : QTYMethod=='SIZE' ? qty / syminfo.pointvalue : qty
if goLongEntry
    ID := 'Long'
    strategy.entry(ID, strategy.long,  qty=eqty(eqty), comment=ID, alert_message = entryAlert)

if goShortEntry
    ID := 'Short'
    strategy.entry(ID, strategy.short, qty=eqty(eqty), comment=ID, alert_message = entryAlert)

// —————— Exit's
qty(perc) => math.abs(sizePos*perc/100)

if longExit
    strategy.close("Long",comment='X', alert_message= exitAlert)
strategy.exit ("exit1", from_entry="Long", limit=takeprofit ? longtp : na, stop=stoploss ? longStop : na, comment_profit='TP', comment_loss='SL', qty_percent=q1)
strategy.exit ("exit2", from_entry="Long", stop=stoploss ? longStop : na, comment_loss='SL')

if shortExit
    strategy.close("Short",comment='X', alert_message= exitAlert)
strategy.exit ("exit1", from_entry="Short", limit=takeprofit ? shorttp : na, stop=stoploss ? shortStop : na, comment_profit='TP', comment_loss='SL', qty_percent=q1)
strategy.exit ("exit2", from_entry="Short", stop=stoploss ? shortStop : na, comment_loss='SL')

///==============================================================================================================

//Style- Plots on Chart
posH = high + 2 * stLine
posL = low - 2 * stLine

plotshape( goLong and PlotEntries ? posL : na ,'Long Entry Signals' , text= '' , location=location.belowbar, style=shape.labelup , size=size.small ,  color=lbullColor , textcolor = color.white )
plotshape( longExit and PlotExits ? posH : na  ,'Long Exit' , location=location.abovebar, style= shape.xcross  , size=size.small,  color=lbullColor )
plotshape( goShort and PlotEntries ? posH : na ,'Short Entry Signals'  , text= '' , location=location.abovebar, style=shape.labeldown , size=size.small  , color=lbearColor  , textcolor = color.white )
plotshape( shortExit and PlotExits ? posL : na  ,'Short Exit' , location=location.belowbar, style=shape.xcross   , size=size.small ,   color=lbearColor )

///==============================================================================================================
// Alerts
alertcondition( goLong  , 'Long Entry Alerts', 'Long Alerts')
alertcondition( goShort , 'Short Entry Alerts', 'Short Alerts')