Stratégie bipolaire à rendement mensuel

1
Follow
1779
Followers
Résumé
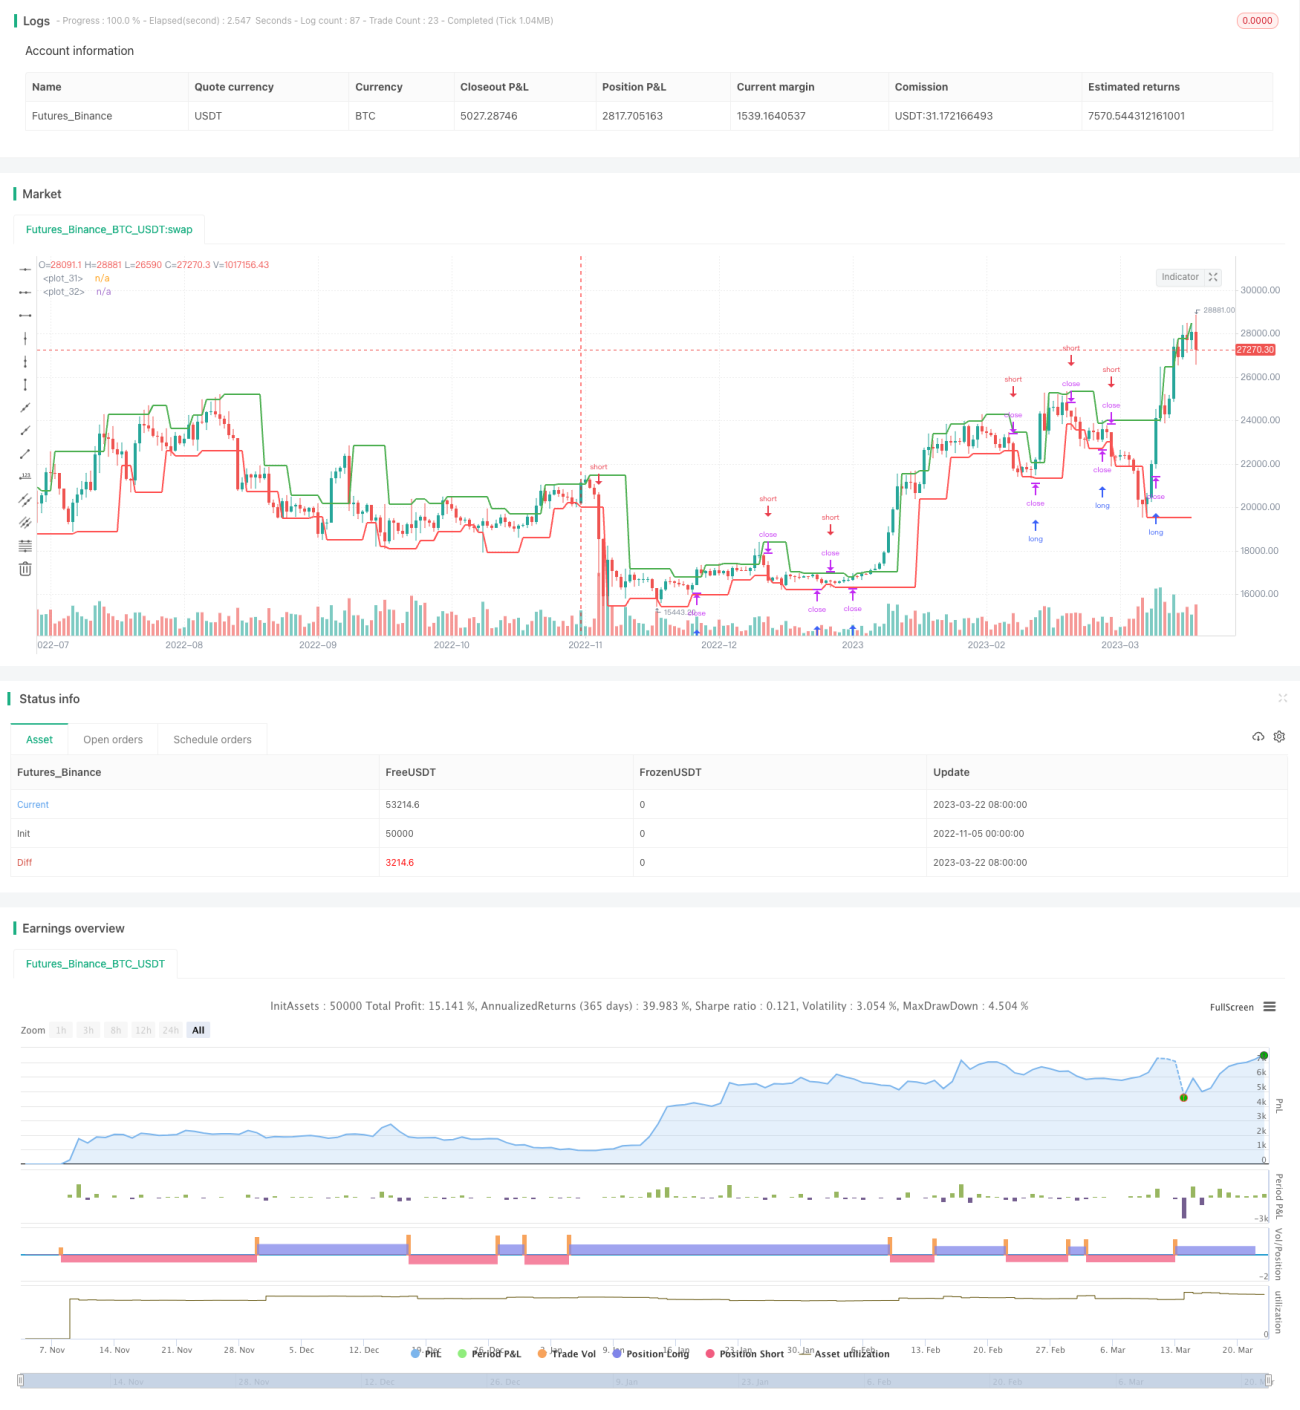
La stratégie utilise les points cardinaux de la ligne K pour déterminer le renversement de tendance et pour signaler des transactions à plusieurs têtes. En cas de gain, la stratégie se bloque sur les gains réalisés ce mois-là pour éviter de causer de plus grandes pertes pendant la période de retrait.
Les principes de la stratégie
- Utilisation
pivothigh()etpivotlow()La fonction calcule le pivot de la ligne K. Le pivot permet de déterminer le renversement de tendance. - Lorsque le prix dépasse le sommet de l'axe supérieur, il est placé en position plus élevée. Lorsque le prix dépasse le sommet de l'axe inférieur, il est placé en position plus basse.
- Au début de chaque mois, le taux de rendement du mois précédent est calculé et sauvegardé dans un tableau.
- Au début de chaque année, le taux de rendement de l'année précédente est calculé et enregistré dans un tableau.
- Vous pouvez également créer un tableau de rendement pour visualiser les rendements mensuels et annuels.
Analyse des avantages
- Les pivots permettent de détecter une inversion de tendance et de filtrer certains signaux de trading bruyants.
- Le verrouillage des bénéfices sur une base mensuelle peut réduire l'impact des mois de pertes et de la polarisation des bénéfices.
- Le tableau des bénéfices est un aperçu des bénéfices mensuels, permettant de voir clairement les hauts et les bas de la stratégie.
Analyse des risques
- Des changements dans les pivots peuvent entraîner une erreur de rétrogradation. Les paramètres peuvent être optimisés ou les conditions de filtrage peuvent être ajoutées.
- En effet, si vous êtes obligé de fermer votre position au début du mois, vous risquez de rater des opportunités de profit pour le reste du mois.
- Les tableaux ne peuvent pas afficher les indicateurs de risque tels que le retrait maximal. Il est possible d'envisager d'ajouter d'autres pour mesurer le risque stratégique.
Optimiser la direction
- Des conditions de filtrage peuvent être ajoutées à proximité des pôles afin d'éviter de fréquentes inversions inefficaces.
- Il est possible de verrouiller une partie de la position plutôt que la totalité, ce qui réduit le risque de manquements.
- Il est possible d'ajouter des indicateurs de risque quantifiables tels que le maximum de rétractation, le Sharpe ratio, etc. dans le tableau.
Résumé
La stratégie utilise des pivots pour déterminer le renversement de la tendance et pour bloquer les gains à la fin de l'année, ce qui permet de contrôler efficacement le risque de retrait. Cependant, certains paramètres et la logique de la stratégie peuvent encore être optimisés pour rendre les signaux de trading plus précis et les contrôles de risque plus stables.
Source
Pine
/*backtest
start: 2022-11-05 00:00:00
end: 2023-03-23 05:20:00
period: 1d
basePeriod: 1h
exchanges: [{"eid":"Futures_Binance","currency":"BTC_USDT"}]
*/

//@version=4
strategy("Monthly Returns in PineScript Strategies", overlay = true, default_qty_type = strategy.percent_of_equity, default_qty_value = 25, calc_on_every_tick = true, commission_type = strategy.commission.percent, commission_value = 0.1)

// Inputs Strategy parameters
Related strategies
Comment
All comments (0)
No data
- 1