Stratégie de suivi de tendance combinant double EMA et RSI
Aperçu
La stratégie utilise une combinaison d’EMA et de RSI pour identifier les tendances de prix et intervenir en temps opportun lors d’un revirement dans la direction de la tendance. Plus précisément, la stratégie utilise les EMA à plus long terme pour déterminer la direction de la tendance majeure, tout en utilisant le RSI pour déterminer le phénomène de survente et de survente à court terme.
Principe de stratégie
Utilisez l’EMA de 200 cycles pour déterminer la direction de la tendance générale. Le passage de la ligne EMA supérieure est un signal haussier et celui de la ligne EMA inférieure est un signal baissier.
L’indicateur RSI est paramétré sur 10 cycles. Un passage au-dessus de 40 est un signal de survente et un passage au-dessous de 60 un signal de survente.
Lorsque la tendance majeure est à la hausse (le prix est supérieur à la ligne EMA), il est préférable de faire une entrée supplémentaire si le signal de survente passe sous le RSI à 40.
Lorsque la tendance majeure est à la baisse (prix en dessous de la ligne EMA), un signal de surachat de 60 sur l’indicateur RSI se produit et le shorting est entré.
Le stop loss est 4 fois supérieur à l’indicateur ATR. Le stop loss est 2 fois supérieur au stop loss, ce qui permet un rapport de risque/rendement de 2:1.
Analyse des avantages
Le plus grand avantage de cette stratégie réside dans la combinaison de la tendance et de l’indicateur de renversement, qui permet d’entrer en jeu en temps opportun lorsque la tendance se rétracte, ce qui permet d’obtenir de meilleures performances. Les avantages spécifiques sont les suivants:
L’utilisation d’un double système EMA pour déterminer la direction des principales tendances permet de suivre efficacement les tendances des prix.
L’indicateur RSI permet d’identifier les situations de sur-achat et de sur-vente à court terme et aide à déterminer le moment d’entrer sur le marché.
Le stop loss est réglé par l’indicateur ATR, qui permet d’ajuster l’amplitude du stop loss en fonction de la volatilité du marché, ce qui est propice à la maîtrise des risques.
En suivant strictement le principe de la tendance, on peut réduire les transactions inutiles et les risques systémiques.
Analyse des risques
La stratégie présente principalement les risques suivants:
Il est possible que des signaux de trading erronés se produisent lorsque la tendance se détériore.
Dans des cas extrêmes, les arrêts définis par l’indicateur ATR peuvent être trop grands ou trop petits et nécessitent un ajustement dynamique. Il est également possible d’envisager de les remplacer par d’autres méthodes d’arrêt.
Les signaux de trading peuvent être générés à une fréquence plus élevée, et il est important de s’assurer qu’ils correspondent à vos préférences de fréquence de trading.
Il est important de s’assurer que les paramètres RSI sont bien définis et d’optimiser les paramètres en temps opportun.
Direction d’optimisation
La stratégie peut être optimisée dans les domaines suivants:
D’autres indicateurs de tendance, tels que le MACD, peuvent être testés pour aider à déterminer la direction de la tendance.
Il est possible de tester d’autres indicateurs de revers, tels que les bandes KDJ et Brin, en combinaison avec le RSI, pour trouver de meilleurs signaux de trading.
Des algorithmes d’apprentissage automatique peuvent être introduits pour réaliser des stop-loss et des stops dynamiques en ajustant les paramètres de manière adaptative.
Il est possible d’ajouter des facteurs tels que l’indicateur d’humeur, la surface de l’information et d’améliorer la stabilité globale du système.
Résumer
Cette stratégie est généralement une stratégie de courte ligne typique qui combine le suivi de la tendance et la conversion des indicateurs. En utilisant le double EMA pour juger de la tendance majeure, tout en utilisant les caractéristiques de conversion de l’indicateur RSI pour saisir les opportunités de Pullback dans la tendance. En principe, cette stratégie combine les avantages des différents indicateurs ensemble, ce qui donne un bon effet de complémentarité.
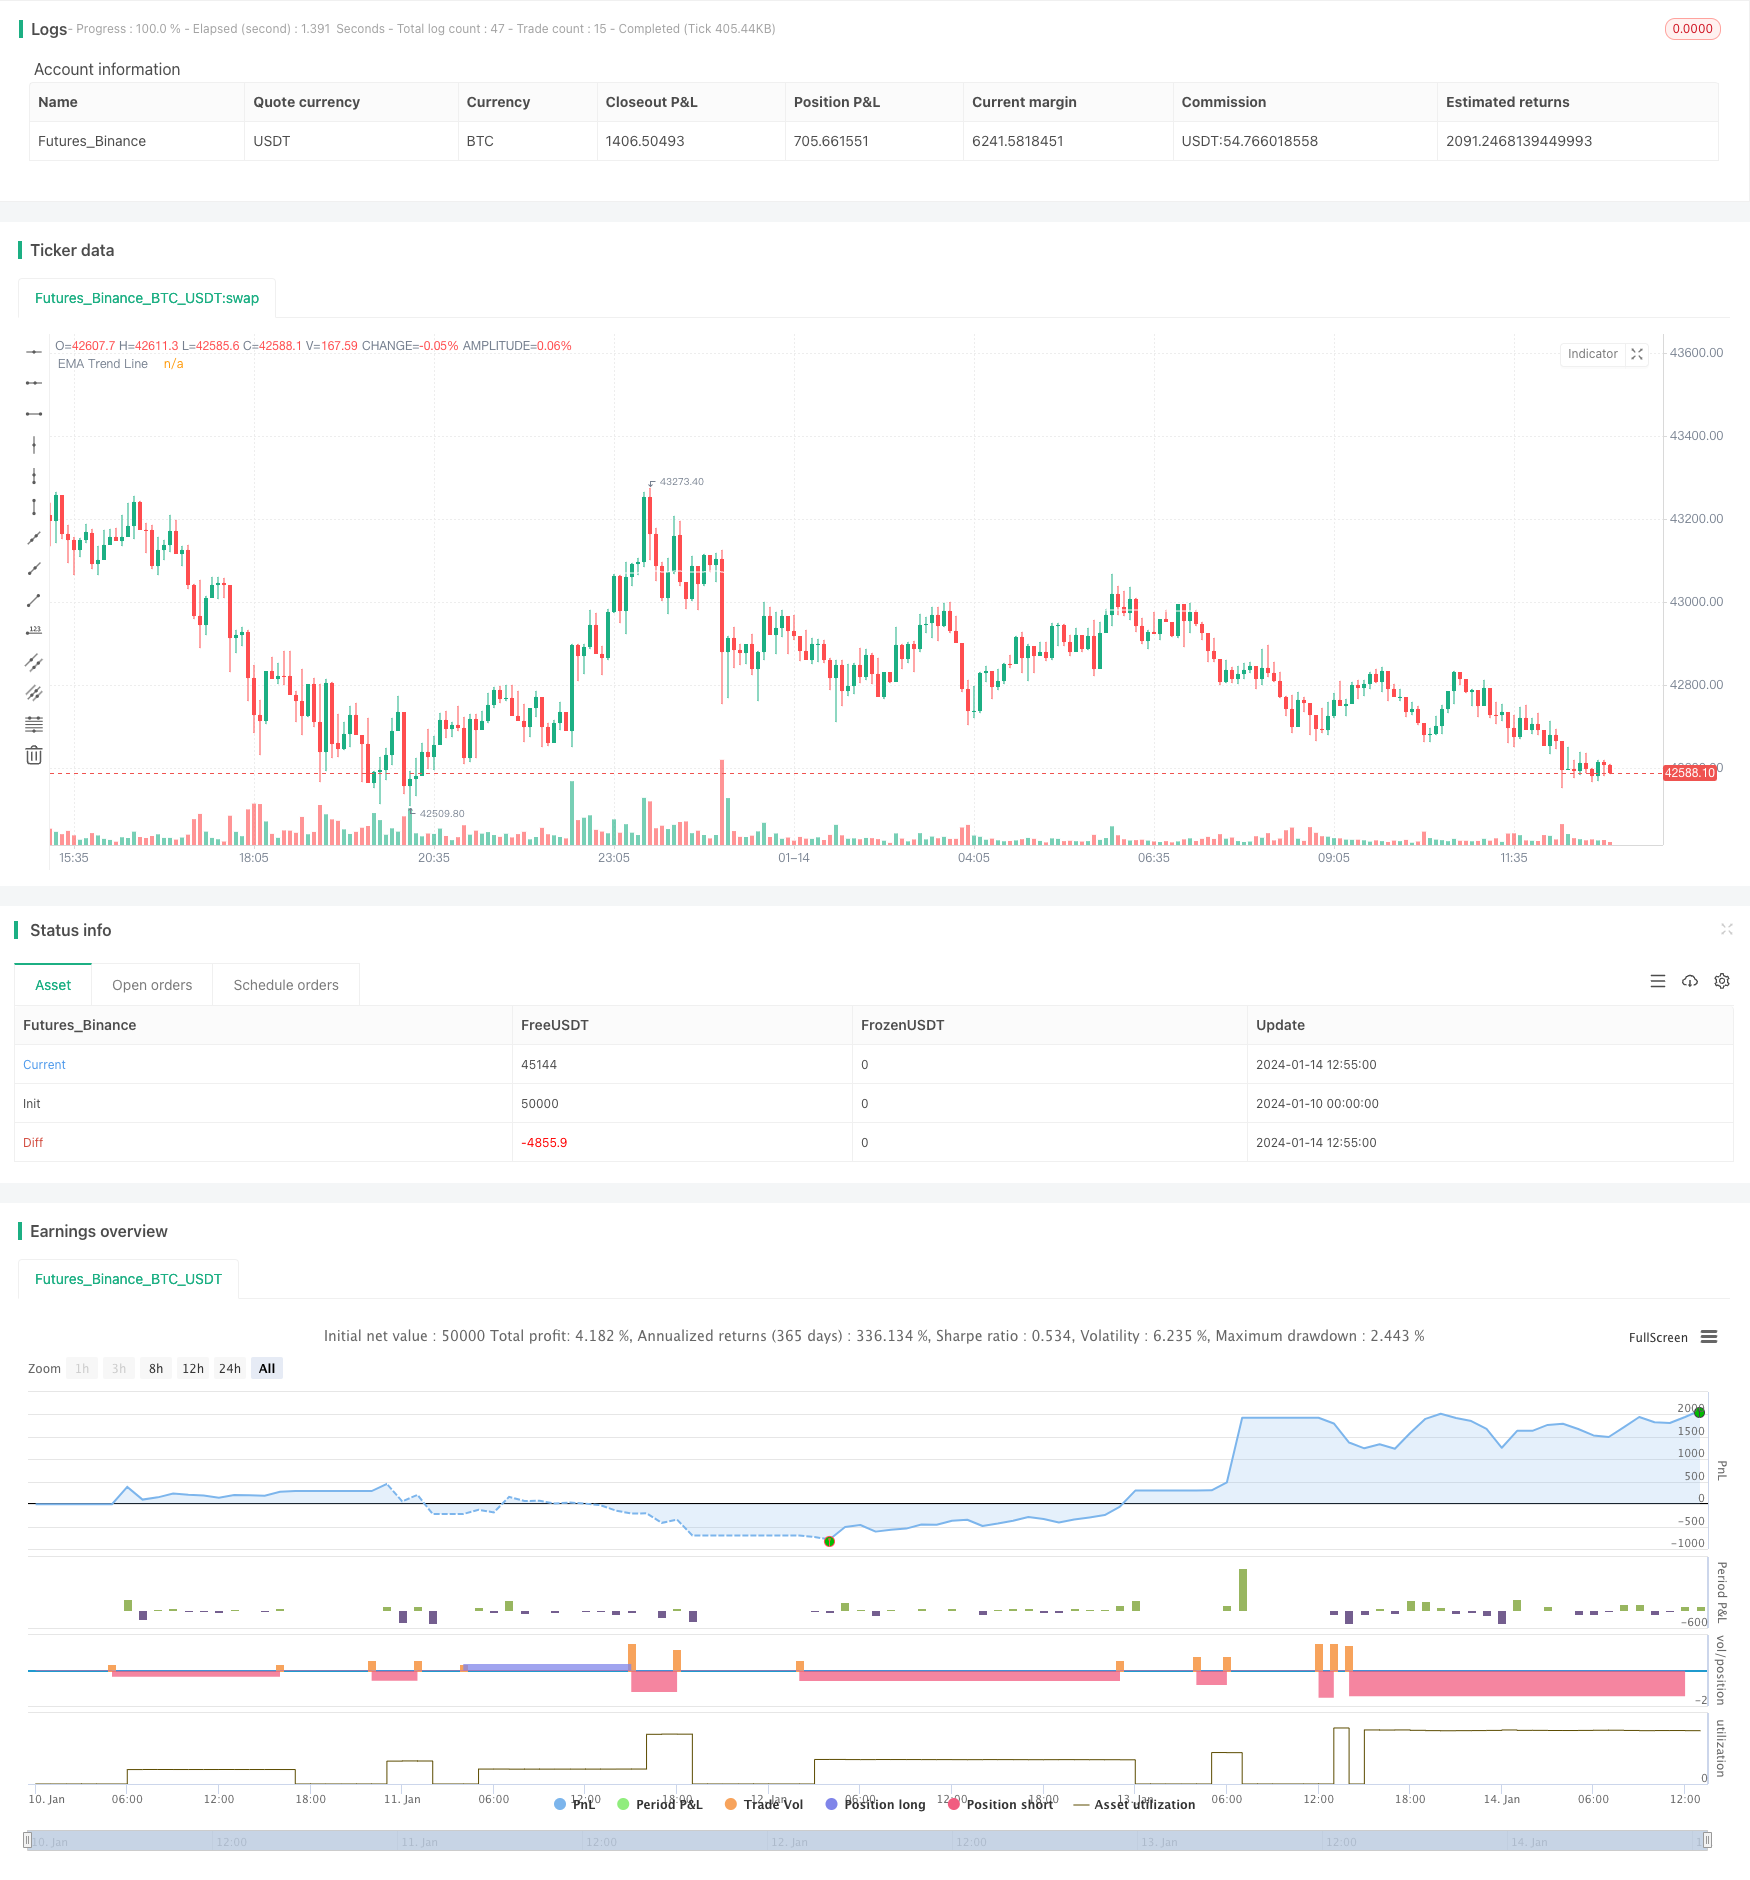
/*backtest
start: 2024-01-10 00:00:00
end: 2024-01-14 13:00:00
period: 5m
basePeriod: 1m
exchanges: [{"eid":"Futures_Binance","currency":"BTC_USDT"}]
*/

// This source code is subject to the terms of the Mozilla Public License 2.0 at https://mozilla.org/MPL/2.0/
// © kevinmck100

// @description
// This strategy is intended to be used as a base template for building new strategies.
//
// It incorporates the following features:
//
//      - Risk management:  Configurable X% loss per stop loss
//                          Configurable R:R ratio
//
//      - Trade entry:      Calculated position size based on risk tolerance
//
//      - Trade exit:       Stop Loss currently configurable ATR multiplier but can be replaced based on strategy
//                          Take Profit calculated from Stop Loss using R:R ratio
//
//      - Backtesting:      Configurable backtesting range by date
//
//      - Trade drawings:   TP/SL boxes drawn for all trades. Can be turned on and off
//                          Trade exit information labels. Can be turned on and off
//                          NOTE: Trade drawings will only be applicable when using overlay strategies
//
//      - Debugging:        Includes section with useful debugging techniques
//
// Strategy conditions:
//
//      - Trade entry:      LONG:   C1: Price is above EMA line
//                                  C2: RSI is crossing out of oversold area
//                          SHORT:  C1: Price is below EMA line
//                                  C2: RSI is crossing out of overbought area
//
//      - Trade exit:       Stop Loss:      Stop Loss ATR multiplier is hit
//                          Take Profit:    R:R multiplier * Stop Loss is hit
//
// The idea is to use RSI to catch pullbacks within the main trend. Note that
// this strategy is intended to be a simple base strategy for building upon.
// It was not designed to be traded in its current form.

//@version=5
INITIAL_CAPITAL = 1000
DEFAULT_COMMISSION = 0.02
MAX_DRAWINGS = 500
IS_OVERLAY = true

strategy("Risk Management Strategy Template", "Strategy Template", overlay = IS_OVERLAY, initial_capital = INITIAL_CAPITAL, currency = currency.NONE, max_labels_count = MAX_DRAWINGS, max_boxes_count = MAX_DRAWINGS, max_lines_count = MAX_DRAWINGS, default_qty_type = strategy.cash, commission_type = strategy.commission.percent, commission_value = DEFAULT_COMMISSION)

// =============================================================================
// INPUTS
// =============================================================================

// ------------------------ Replacable section - Start -------------------------
// ------------------
// Indicator Settings
// ------------------
emaLength           = input.int (200,   "EMA Length          ",             group = "Indicators: Settings",         inline = "IS1", minval = 1,                 tooltip = "EMA line to identify trend direction. Above EMA trend line is bullish. Below EMA trend line is bearish")
rsiLength           = input.int (10,    "RSI Length            ",           group = "Indicators: Settings",         inline = "IS2", minval = 1)

// ----------------------
// Trade Entry Conditions
// ----------------------
rsiOverbought       = input.int (60,    "RSI Overbought        ",           group = "Strategy: Conditions",         inline = "SC1", minval = 50, maxval = 100,  tooltip = "RSI overbought level used to identify pullbacks within the main trend. RSI crossing BELOW this level triggers a SHORT when in a DOWN trend")
rsiOversold         = input.int (40,    "RSI Oversold          ",           group = "Strategy: Conditions",         inline = "SC2", minval = 0,  maxval = 50,   tooltip = "RSI overbought level used to identify pullbacks within the main trend. RSI crossing ABOVE this level triggers a LONG when in an UP trend")

// ---------------------
// Trade Exit Conditions
// ---------------------
atrLength           = input.int  (14,   "Stop Loss ATR Length      ",       group = "Strategy: Exit Conditions",    inline = "EC1", minval = 0,                 tooltip = "Length of ATR used to calculate Stop Loss.")
slAtrMultiplier     = input.float(4,    "Stop Loss ATR Multiplier     ",    group = "Strategy: Exit Conditions",    inline = "EC2", minval = 0, step = 0.1,     tooltip = "Size of StopLoss is determined by multiplication of ATR value. Take Profit is derived from this also by multiplying the StopLoss value by the Risk:Reward multiplier.")
// ------------------------- Replacable section - End --------------------------

// ---------------
// Risk Management
// ---------------
riskReward          = input.float(2,    "Risk : Reward        1 :",         group = "Strategy: Risk Management",    inline = "RM1", minval = 0, step = 0.1,     tooltip = "Previous high or low (long/short dependant) is used to determine TP level. 'Risk : Reward' ratio is then used to calculate SL based of previous high/low level.\n\nIn short, the higher the R:R ratio, the smaller the SL since TP target is fixed by previous high/low price data.")
accountRiskPercent  = input.float(1,    "Portfolio Risk %         ",        group = "Strategy: Risk Management",    inline = "RM1", minval = 0, step = 0.1,     tooltip = "Percentage of portfolio you lose if trade hits SL.\n\nYou then stand to gain\n  Portfolio Risk % * Risk : Reward\nif trade hits TP.")

// ----------
// Date Range
// ----------
startYear           = input.int (2022,  "Start Date       ",                group = 'Strategy: Date Range',         inline = 'DR1', minval    = 1900, maxval = 2100)
startMonth          = input.int (1,     "",                                 group = 'Strategy: Date Range',         inline = 'DR1', options   = [1, 2, 3, 4, 5, 6, 7, 8, 9, 10, 11, 12])
startDate           = input.int (1,     "",                                 group = 'Strategy: Date Range',         inline = 'DR1', options   = [1, 2, 3, 4, 5, 6, 7, 8, 9, 10, 11, 12, 13, 14, 15, 16, 17, 18, 19, 20, 21, 22, 23, 24, 25, 26, 27, 28, 29, 30, 31])
endYear             = input.int (2100,  "End Date      ",                   group = 'Strategy: Date Range',         inline = 'DR2', minval    = 1900, maxval = 2100)
endMonth            = input.int (1,     "",                                 group = 'Strategy: Date Range',         inline = 'DR2', options   = [1, 2, 3, 4, 5, 6, 7, 8, 9, 10, 11, 12])
endDate             = input.int (1,     "",                                 group = 'Strategy: Date Range',         inline = 'DR2', options   = [1, 2, 3, 4, 5, 6, 7, 8, 9, 10, 11, 12, 13, 14, 15, 16, 17, 18, 19, 20, 21, 22, 23, 24, 25, 26, 27, 28, 29, 30, 31])

// ----------------
// Drawing Settings
// ----------------
showTpSlBoxes       = input.bool(false,  "Show TP / SL Boxes",               group = "Strategy: Drawings",           inline = "D1",  tooltip = "Show or hide TP and SL position boxes.\n\nNote: TradingView limits the maximum number of boxes that can be displayed to 500 so they may not appear for all price data under test.")
showLabels          = input.bool(false, "Show Trade Exit Labels",           group = "Strategy: Drawings",           inline = "D2",  tooltip = "Useful labels to identify Profit/Loss and cumulative portfolio capital after each trade closes.\n\nAlso note that TradingView limits the max number of 'boxes' that can be displayed on a chart (max 500). This means when you lookback far enough on the chart you will not see the TP/SL boxes. However you can check this option to identify where trades exited.")

// =============================================================================
// INDICATORS
// =============================================================================

// ------------------------ Replacable section - Start -------------------------
// ---
// EMA
// ---
ema = ta.ema(close, emaLength)
plot(ema, "EMA Trend Line", color.white)

// ---
// RSI
// ---
rsi = ta.rsi(close, rsiLength)
// ------------------------- Replacable section - End --------------------------


// =============================================================================
// STRATEGY LOGIC
// =============================================================================

// ---------
// FUNCTIONS
// ---------

percentAsPoints(pcnt) =>
    math.round(pcnt / 100 * close / syminfo.mintick)

calcStopLossPrice(pointsOffset, isLong) =>
    priceOffset = pointsOffset * syminfo.mintick
    if isLong
        close - priceOffset
    else
        close + priceOffset

calcProfitTrgtPrice(pointsOffset, isLong) =>
    calcStopLossPrice(-pointsOffset, isLong)


printLabel(barIndex, msg) => label.new(barIndex, close, msg)

printTpSlHitBox(left, right, slHit, tpHit, entryPrice, slPrice, tpPrice) =>
    if showTpSlBoxes
        box.new (left = left,   top = entryPrice,   right = right,  bottom = slPrice,   bgcolor = slHit ? color.new(color.red, 60)   : color.new(color.gray, 90), border_width = 0)
        box.new (left = left,   top = entryPrice,   right = right,  bottom = tpPrice,   bgcolor = tpHit ? color.new(color.green, 60) : color.new(color.gray, 90), border_width = 0)
        line.new(x1 = left,     y1 = entryPrice,    x2 = right,     y2 = entryPrice,    color = color.new(color.yellow, 20))
        line.new(x1 = left,     y1 = slPrice,       x2 = right,     y2 = slPrice,       color = color.new(color.red, 20))
        line.new(x1 = left,     y1 = tpPrice,       x2 = right,     y2 = tpPrice,       color = color.new(color.green, 20))

printTpSlNotHitBox(left, right, entryPrice, slPrice, tpPrice) =>
    if showTpSlBoxes
        box.new (left = left,   top = entryPrice,   right = right,  bottom = slPrice,   bgcolor = color.new(color.gray, 90), border_width = 0)
        box.new (left = left,   top = entryPrice,   right = right,  bottom = tpPrice,   bgcolor = color.new(color.gray, 90), border_width = 0)
        line.new(x1 = left,     y1 = entryPrice,    x2 = right,     y2 = entryPrice,    color = color.new(color.yellow, 20))
        line.new(x1 = left,     y1 = slPrice,       x2 = right,     y2 = slPrice,       color = color.new(color.red, 20))
        line.new(x1 = left,     y1 = tpPrice,       x2 = right,     y2 = tpPrice,       color = color.new(color.green, 20))

printTradeExitLabel(x, y, posSize, entryPrice, pnl) =>
    if showLabels
        labelStr = "Position Size: " + str.tostring(math.abs(posSize), "#.##") + "\nPNL: " + str.tostring(pnl, "#.##") + "\nCapital: " + str.tostring(strategy.equity, "#.##") + "\nEntry Price: " + str.tostring(entryPrice, "#.##")
        label.new(x = x, y = y, text = labelStr, color = pnl > 0 ? color.new(color.green, 60) : color.new(color.red, 60), textcolor = color.white, style = label.style_label_down)

// ----------
// CONDITIONS
// ----------

inDateRange         = time >= timestamp(syminfo.timezone, startYear, startMonth, startDate, 0, 0) and time < timestamp(syminfo.timezone, endYear, endMonth, endDate, 0, 0)

// ------------------------ Replacable section - Start -------------------------
// Condition 1: Price above EMA indicates bullish trend, price below EMA indicates bearish trend
bullEma             = close > ema
bearEma             = close < ema

// Condition 2: RSI crossing back from overbought/oversold indicates pullback within trend
bullRsi             = ta.crossover  (rsi, rsiOversold)
bearRsi             = ta.crossunder (rsi, rsiOverbought)

// Combine all entry conditions
goLong              = inDateRange and bullEma and bullRsi
goShort             = inDateRange and bearEma and bearRsi
// ------------------------- Replacable section - End --------------------------

// Trade entry and exit variables
var tradeEntryBar   = bar_index
var profitPoints    = 0.
var lossPoints      = 0.
var slPrice         = 0.
var tpPrice         = 0.
var inLong          = false
var inShort         = false

// Entry decisions
openLong            = (goLong and not inLong)
openShort           = (goShort and not inShort)
flippingSides       = (goLong and inShort) or (goShort and inLong)
enteringTrade       = openLong or openShort
inTrade             = inLong or inShort

// ------------------------ Replacable section - Start -------------------------
// Exit calculations
atr                 = ta.atr(atrLength)
slAmount            = atr * slAtrMultiplier
slPercent           = math.abs((1 - (close - slAmount) / close) * 100)
tpPercent           = slPercent * riskReward
// ------------------------- Replacable section - End --------------------------

// Risk calculations
riskAmt             = strategy.equity * accountRiskPercent / 100
entryQty            = math.abs(riskAmt / slPercent * 100)  / close

if openLong
    if strategy.position_size < 0
        printTpSlNotHitBox(tradeEntryBar + 1, bar_index + 1, strategy.position_avg_price, slPrice, tpPrice)
        printTradeExitLabel(bar_index + 1, math.max(tpPrice, slPrice), strategy.position_size, strategy.position_avg_price, strategy.openprofit)
    strategy.entry("Long", strategy.long, qty = entryQty, alert_message = "Long Entry")
    enteringTrade   := true
    inLong          := true
    inShort         := false

if openShort
    if strategy.position_size > 0
        printTpSlNotHitBox(tradeEntryBar + 1, bar_index + 1, strategy.position_avg_price, slPrice, tpPrice)
        printTradeExitLabel(bar_index + 1, math.max(tpPrice, slPrice), strategy.position_size, strategy.position_avg_price, strategy.openprofit)
    strategy.entry("Short", strategy.short, qty = entryQty, alert_message = "Short Entry")
    enteringTrade   := true
    inShort         := true
    inLong          := false

if enteringTrade
    profitPoints    := percentAsPoints(tpPercent)
    lossPoints      := percentAsPoints(slPercent)
    slPrice         := calcStopLossPrice(lossPoints, openLong)
    tpPrice         := calcProfitTrgtPrice(profitPoints, openLong)
    tradeEntryBar   := bar_index

strategy.exit("TP/SL", profit = profitPoints, loss = lossPoints, comment_profit = "TP Hit", comment_loss = "SL Hit", alert_profit = "TP Hit Alert", alert_loss = "SL Hit Alert")

// =============================================================================
// DRAWINGS
// =============================================================================

// -----------
// TP/SL Boxes
// -----------

slHit           = (inShort and high >= slPrice) or (inLong  and low <= slPrice)
tpHit           = (inLong  and high >= tpPrice) or (inShort and low <= tpPrice)
exitTriggered   = slHit or tpHit
entryPrice      = strategy.closedtrades.entry_price (strategy.closedtrades - 1)
pnl             = strategy.closedtrades.profit      (strategy.closedtrades - 1)
posSize         = strategy.closedtrades.size        (strategy.closedtrades - 1)

// Print boxes for trades closed at profit or loss
if (inTrade and exitTriggered)
    inShort    := false
    inLong     := false
    printTpSlHitBox(tradeEntryBar + 1, bar_index, slHit, tpHit, entryPrice, slPrice, tpPrice)
    printTradeExitLabel(bar_index, math.max(tpPrice, slPrice), posSize, entryPrice, pnl)

// Print TP/SL box for current open trade
if barstate.islastconfirmedhistory and strategy.position_size != 0
    printTpSlNotHitBox(tradeEntryBar + 1, bar_index + 1, strategy.position_avg_price, slPrice, tpPrice)

// =============================================================================
// DEBUGGING
// =============================================================================

// Data window plots
plotchar(slPrice,    "Stop Loss Price",     "")
plotchar(tpPrice,    "Take Profit Price",   "")

// Label plots
plotDebugLabels = false
if plotDebugLabels
    if bar_index == tradeEntryBar
        printLabel(bar_index, "Position size: " + str.tostring(entryQty * close, "#.##"))