Stratégie de trading avec séparation longue et courte de l'indicateur RSI

Aperçu
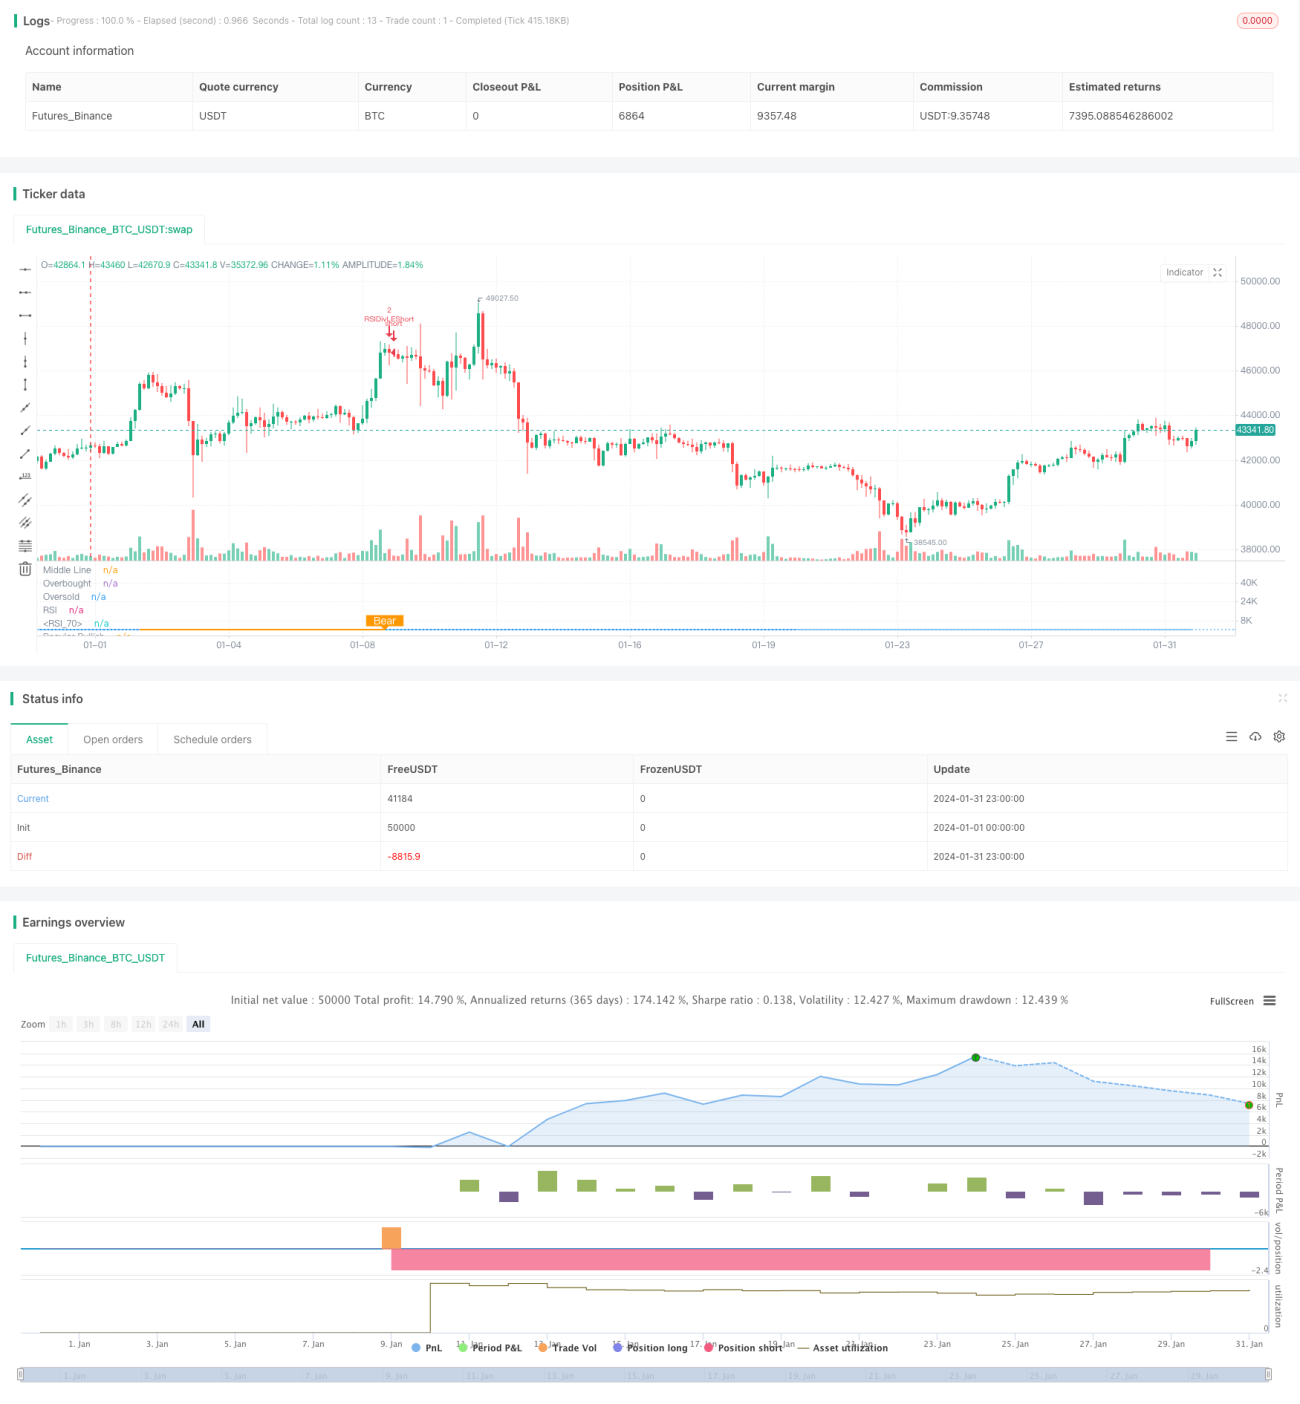
La stratégie consiste à identifier le phénomène de la séparation des hautes sur le RSI et à prendre des décisions de négociation en fonction de celui-ci. Son idée centrale est de former un signal de séparation des hautes sur les hautes lorsque le prix a un nouveau bas mais que le RSI a un nouveau haut, indiquant que le fond est formé, faire plus; et de former un signal de séparation des hautes sur les hautes lorsque le prix a un nouveau haut mais que le RSI a un nouveau bas, indiquant que le sommet est formé, faire vide.
Principe de stratégie
La stratégie utilise principalement l'indicateur RSI pour identifier le phénomène de séparation polygonale entre le prix et le RSI, comme suit:
- Utilisez le paramètre RSI 13 pour le prix de clôture
- La définition d'une dérivation à plusieurs têtes est de 14 jours à gauche et de 2 jours à droite
- Définition d'une portée de rétroaction de 47 jours à gauche et de 1 jour à droite pour la séparation de la tête vide
- Lorsque le prix atteint des bas plus bas, mais que l'indicateur RSI atteint des bas plus élevés, il est possible de satisfaire aux conditions de décalage multiple et de générer un signal de multiplication.
- Lorsque le prix atteint un sommet plus élevé, mais que le RSI atteint un sommet plus bas, la condition de séparation de la tête vide est remplie et un signal de décalage est généré
En identifiant la séparation polygonale entre le prix et l'indicateur RSI, il est possible de saisir à l'avance les points de basculement de la tendance des prix et de prendre des décisions de négociation en conséquence.
Avantages stratégiques
Les principaux avantages de cette stratégie sont les suivants:
- Identifier la déviation entre le prix et l'indicateur RSI, pour déterminer à l'avance les points de basculement de la tendance des prix et saisir les opportunités de trading
- L'analyse des indicateurs est libre de toute émotion subjective
- Utilisation d'un espace de rétrogradation fixe pour identifier les phénomènes de séparation et éviter une référencement fréquent
- Les conditions supplémentaires telles que le RSI du jour peuvent réduire la probabilité d'erreur de transaction.
Les risques et les solutions
Cette stratégie comporte aussi des risques:
-
Un écart du RSI n'indique pas nécessairement une inversion immédiate du prix, il peut y avoir un décalage de temps, ce qui entraîne un risque de déclenchement d'un stop. La solution consiste à assouplir correctement la marge de stop et à donner au prix suffisamment de temps pour confirmer le signal de séparation.
-
La durée prolongée du phénomène de dissociation augmente également le risque. La solution consiste à associer un indice RSI à long terme comme condition de filtrage.
-
Une rupture trop petite ne permet pas non plus de confirmer un renversement de tendance et nécessite une amplification appropriée de la zone de rétrocession pour rechercher une rupture plus marquée du RSI.
Orientation de l'optimisation de la stratégie
Cette stratégie peut également être optimisée dans les directions suivantes:
-
Optimiser les paramètres RSI pour trouver la meilleure combinaison de paramètres
-
Essayez d'autres indicateurs techniques comme le MACD, le KD, etc. pour identifier le phénomène de la séparation polyvalente
-
Ajout de conditions de filtrage appropriées pour les périodes de crise afin d'éviter une augmentation du nombre de transactions erronées en période de crise
-
Trouvez le meilleur signal combiné avec le RSI sur plus de périodes
Résumer
La stratégie de trading RSI de séparation de l'espace permet d'identifier le phénomène de séparation de l'espace entre l'indicateur RSI et le prix, de juger des points de basculement de la tendance des prix et de créer un signal de trading. La stratégie est simple à utiliser et permet d'améliorer encore la probabilité de profit en optimisant les paramètres de configuration et en augmentant les conditions de filtrage.
- 1