स्विंग हाई/लो & कैंडल पैटर्न
लेखक:चाओझांग, दिनांकः 2022-05-07 21:12:40टैगःउछालमंदी
यह स्क्रिप्ट स्विंग उच्च और स्विंग निम्न के साथ-साथ उस सटीक बिंदु पर हुई मोमबत्ती पैटर्न को लेबल करती है। स्क्रिप्ट निम्नलिखित 6 मोमबत्ती पैटर्न का पता लगा सकती हैः हथौड़ा, उल्टा हथौड़ा, तेजी से निगलना, लटकने वाला आदमी, शूटिंग स्टार, और मंदी निगलना।
HH, HL, LH, और LL के संकेतन जो आप लेबल पर देख सकते हैं, निम्नानुसार परिभाषित हैं:
उच्च उच्च HL: उच्च निम्न LH: निम्न उच्च LL: निम्न निम्न
सेटिंग
लम्बाईः स्विंग उच्च/निम्न का पता लगाने की संवेदनशीलता, कम मूल्यों के साथ अल्पकालिक मूल्य परिवर्तनों का अधिकतम/न्यूनतम लौटाता है।
उपयोग और विवरण
यह देखना दिलचस्प हो सकता है कि क्या एक शीर्ष या नीचे एक विशिष्ट मोमबत्ती पैटर्न से जुड़ा हुआ है, यह हमें एक उलट को इंगित करने के लिए इस तरह के एक पैटर्न की क्षमता का अध्ययन करने की अनुमति देता है। आप इसके बारे में अधिक विवरण देखने के लिए एक विशिष्ट पैटर्न के साथ एक लेबल पर होवर कर सकते हैं।
ध्यान दें कि लेबल ऑफसेट हैं, और बाद में वास्तविक समय में दिखाई देंगे, इस प्रकार इस संकेतक का उद्देश्य वास्तविक समय में शीर्ष/नीचे का पता लगाना नहीं है।
लंबाई के उच्च मान त्रुटियों को वापस कर सकते हैं.
बैकटेस्ट
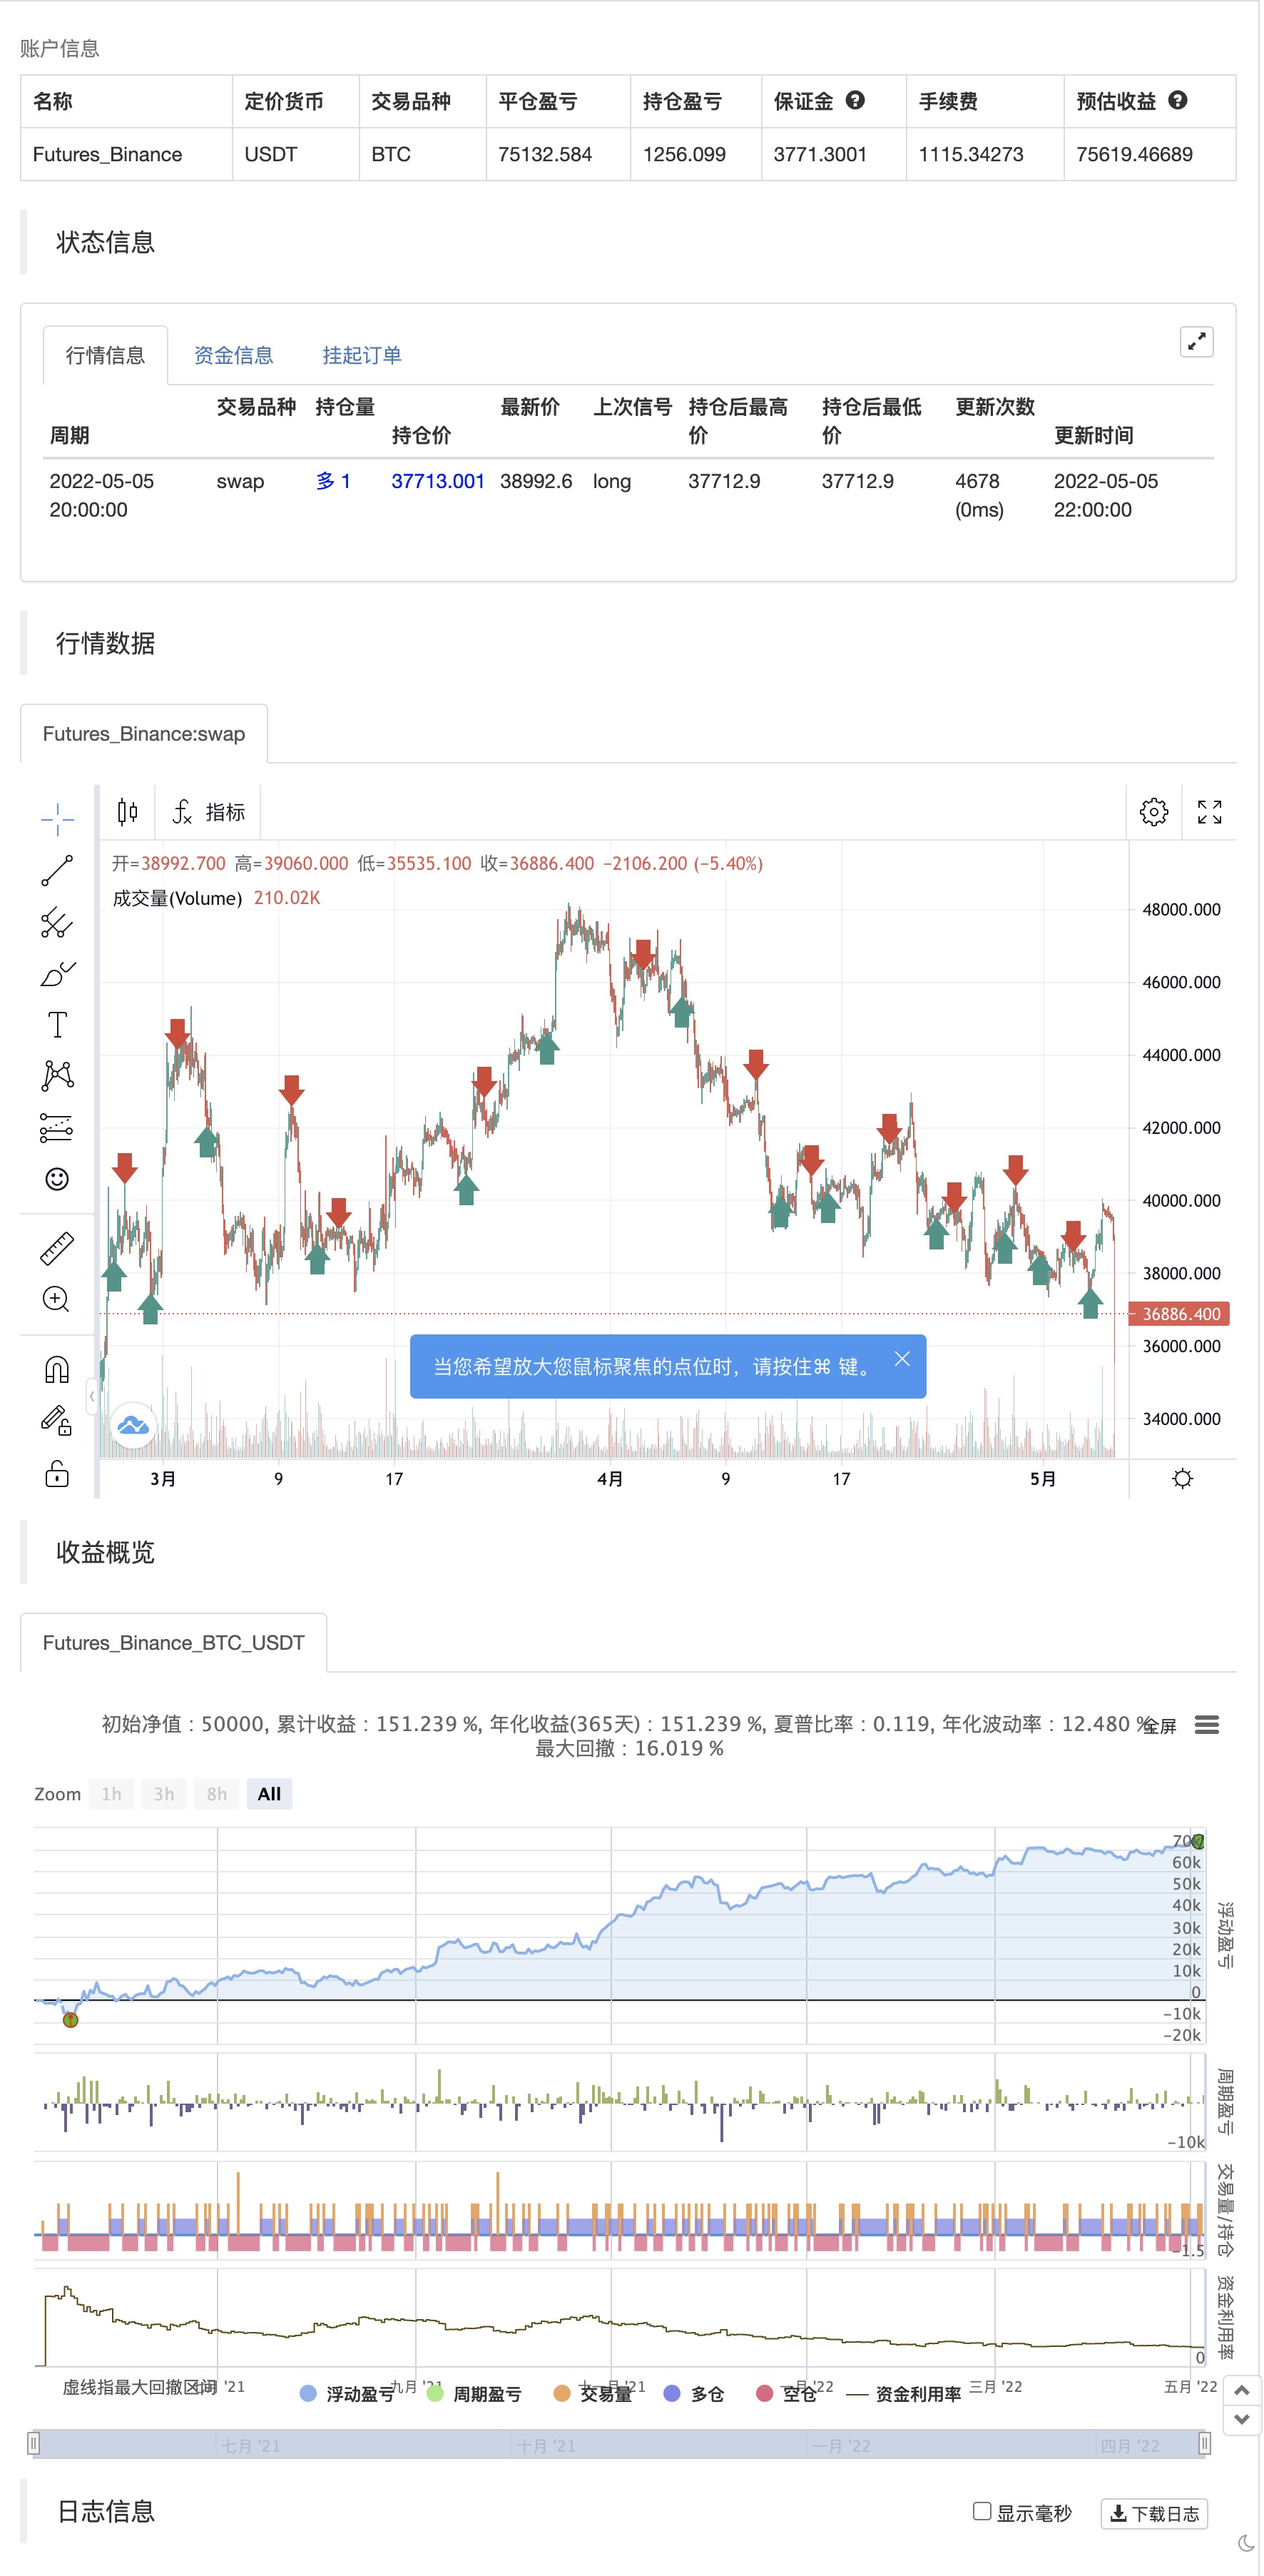
/*backtest
start: 2021-05-06 00:00:00
end: 2022-05-05 23:59:00
period: 2h
basePeriod: 15m
exchanges: [{"eid":"Futures_Binance","currency":"BTC_USDT"}]
*/

// This work is licensed under a Attribution-NonCommercial-ShareAlike 4.0 International (CC BY-NC-SA 4.0) https://creativecommons.org/licenses/by-nc-sa/4.0/
// © LuxAlgo

//@version=4
study("Swing Highs/Lows & Candle Patterns",overlay=true)
length = input(21)
//------------------------------------------------------------------------------
o = open[length],h = high[length]
l = low[length],c = close[length]
//------------------------------------------------------------------------------
ph = pivothigh(close,length,length)
pl = pivotlow(open,length,length)
valH = valuewhen(ph,c,0)
valL = valuewhen(pl,c,0)
valpH = valuewhen(ph,c,1)
valpL = valuewhen(pl,c,1)
//------------------------------------------------------------------------------
d = abs(c - o)
hammer = pl and min(o,c) - l > d and h - max(c,o) < d
ihammer = pl and h - max(c,o) > d and min(c,o) - l < d
bulleng = c > o and c[1] < o[1] and c > o[1] and o < c[1]
hanging = ph and min(c,o) - l > d and h - max(o,c) < d
shooting = ph and h - max(o,c) > d and min(c,o) - l < d
beareng = c > o and c[1] < o[1] and c > o[1] and o < c[1]
//------------------------------------------------------------------------------
//Descriptions
//------------------------------------------------------------------------------
hammer_ = "The hammer candlestick pattern is formed of a short body with a long lower wick, and is found at the bottom of a downward trend."
  + "\n" + "\n A hammer shows that although there were selling pressures during the day, ultimately a strong buying pressure drove the price back up."
ihammer_ = "The inverted hammer is a similar pattern than the hammer pattern. The only difference being that the upper wick is long, while the lower wick is short."
  + "\n" + "\n It indicates a buying pressure, followed by a selling pressure that was not strong enough to drive the market price down. The inverse hammer suggests that buyers will soon have control of the market."
bulleng_ = "The bullish engulfing pattern is formed of two candlesticks. The first candle is a short red body that is completely engulfed by a larger green candle"
  + "\n" + "\n Though the second day opens lower than the first, the bullish market pushes the price up, culminating in an obvious win for buyers"
hanging_ = "The hanging man is the bearish equivalent of a hammer; it has the same shape but forms at the end of an uptrend."
  + "\n" + "It indicates that there was a significant sell-off during the day, but that buyers were able to push the price up again. The large sell-off is often seen as an indication that the bulls are losing control of the market."
shotting_ = "The shooting star is the same shape as the inverted hammer, but is formed in an uptrend: it has a small lower body, and a long upper wick."
  + "\n" + "Usually, the market will gap slightly higher on opening and rally to an intra-day high before closing at a price just above the open – like a star falling to the ground."
beareng_ = "A bearish engulfing pattern occurs at the end of an uptrend. The first candle has a small green body that is engulfed by a subsequent long red candle."
  + "\n" + "It signifies a peak or slowdown of price movement, and is a sign of an impending market downturn. The lower the second candle goes, the more significant the trend is likely to be."
//------------------------------------------------------------------------------
n = bar_index
label lbl = na
H = valH > valpH ? "HH" : valH < valpH ? "LH" : na
L = valL < valpL ? "LL" : valL > valpL ? "HL" : na
txt = hammer ? "Hammer" : ihammer ? "Inverse Hammer" :
  bulleng ? "Bullish Engulfing" : hanging ? "Hanging Man" :
  shooting ? "Shooting Star" : beareng ? "Bearish Engulfing" : "None"
des = hammer ? hammer_ : ihammer ? ihammer_ :
  bulleng ? bulleng_ : hanging ? hanging_ :
  shooting ? shotting_ : beareng ? beareng_ : ""

//------------------------------------------------------------------------------
if ph
    strategy.entry("Enter Long", strategy.long)
else if pl
    strategy.entry("Enter Short", strategy.short)
- टूटा हुआ फ्रैक्टल: किसी के टूटे हुए सपने से आपका लाभ होता है!
- ज़िगज़ैग पीए रणनीति V4.1
- डिमार्क सेटअप सूचक
- घेर लेने वाली मोमबत्तियाँ
- समर्थन-प्रतिरोध ब्रेकआउट
- एमटीएफ आरएसआई और स्टोच रणनीति
- jma + dwma मल्टीग्रेन द्वारा
- चलती औसत रंगीन ईएमए/एसएमए
- बहु-समय-सीमा व्यापार
- zdmre द्वारा आरएसआई
- मैजिक एमएसीडी
- संकेतों के साथ Z स्कोर
- पाइन भाषा संस्करण
- 3EMA + बोलिंगर + PIVOT
- मल्टीग्रेन द्वारा बैगेट
- मिलमशीन
- K का रिवर्स इंडिकेटर I
- घेर लेने वाली मोमबत्तियाँ
- एम.ए. सम्राट इनसिलिकोनॉट
- डेमार्क रिवर्स पॉइंट्स
- टीएमए ओवरले
- एमएसीडी + एसएमए 200 रणनीति
- सीएम स्लिंग शॉट सिस्टम
- बोलिंगर + आरएसआई, डबल रणनीति v1.1
- बोलिंगर बैंड्स रणनीति
- अनुकूलित रुझान ट्रैकर
- पाइनस्क्रिप्ट रणनीतियों में मासिक रिटर्न
- v4 के लिए ADX और DI
- मैकडी कस्टम संकेतक-अनेक समय सीमा+सभी उपलब्ध विकल्प!
- संकेतकः वेवट्रेंड ऑसिलेटर