Brahmastra
Penulis:ChaoZhang, Tanggal: 2022-05-13 14:39:00Tag:WMA
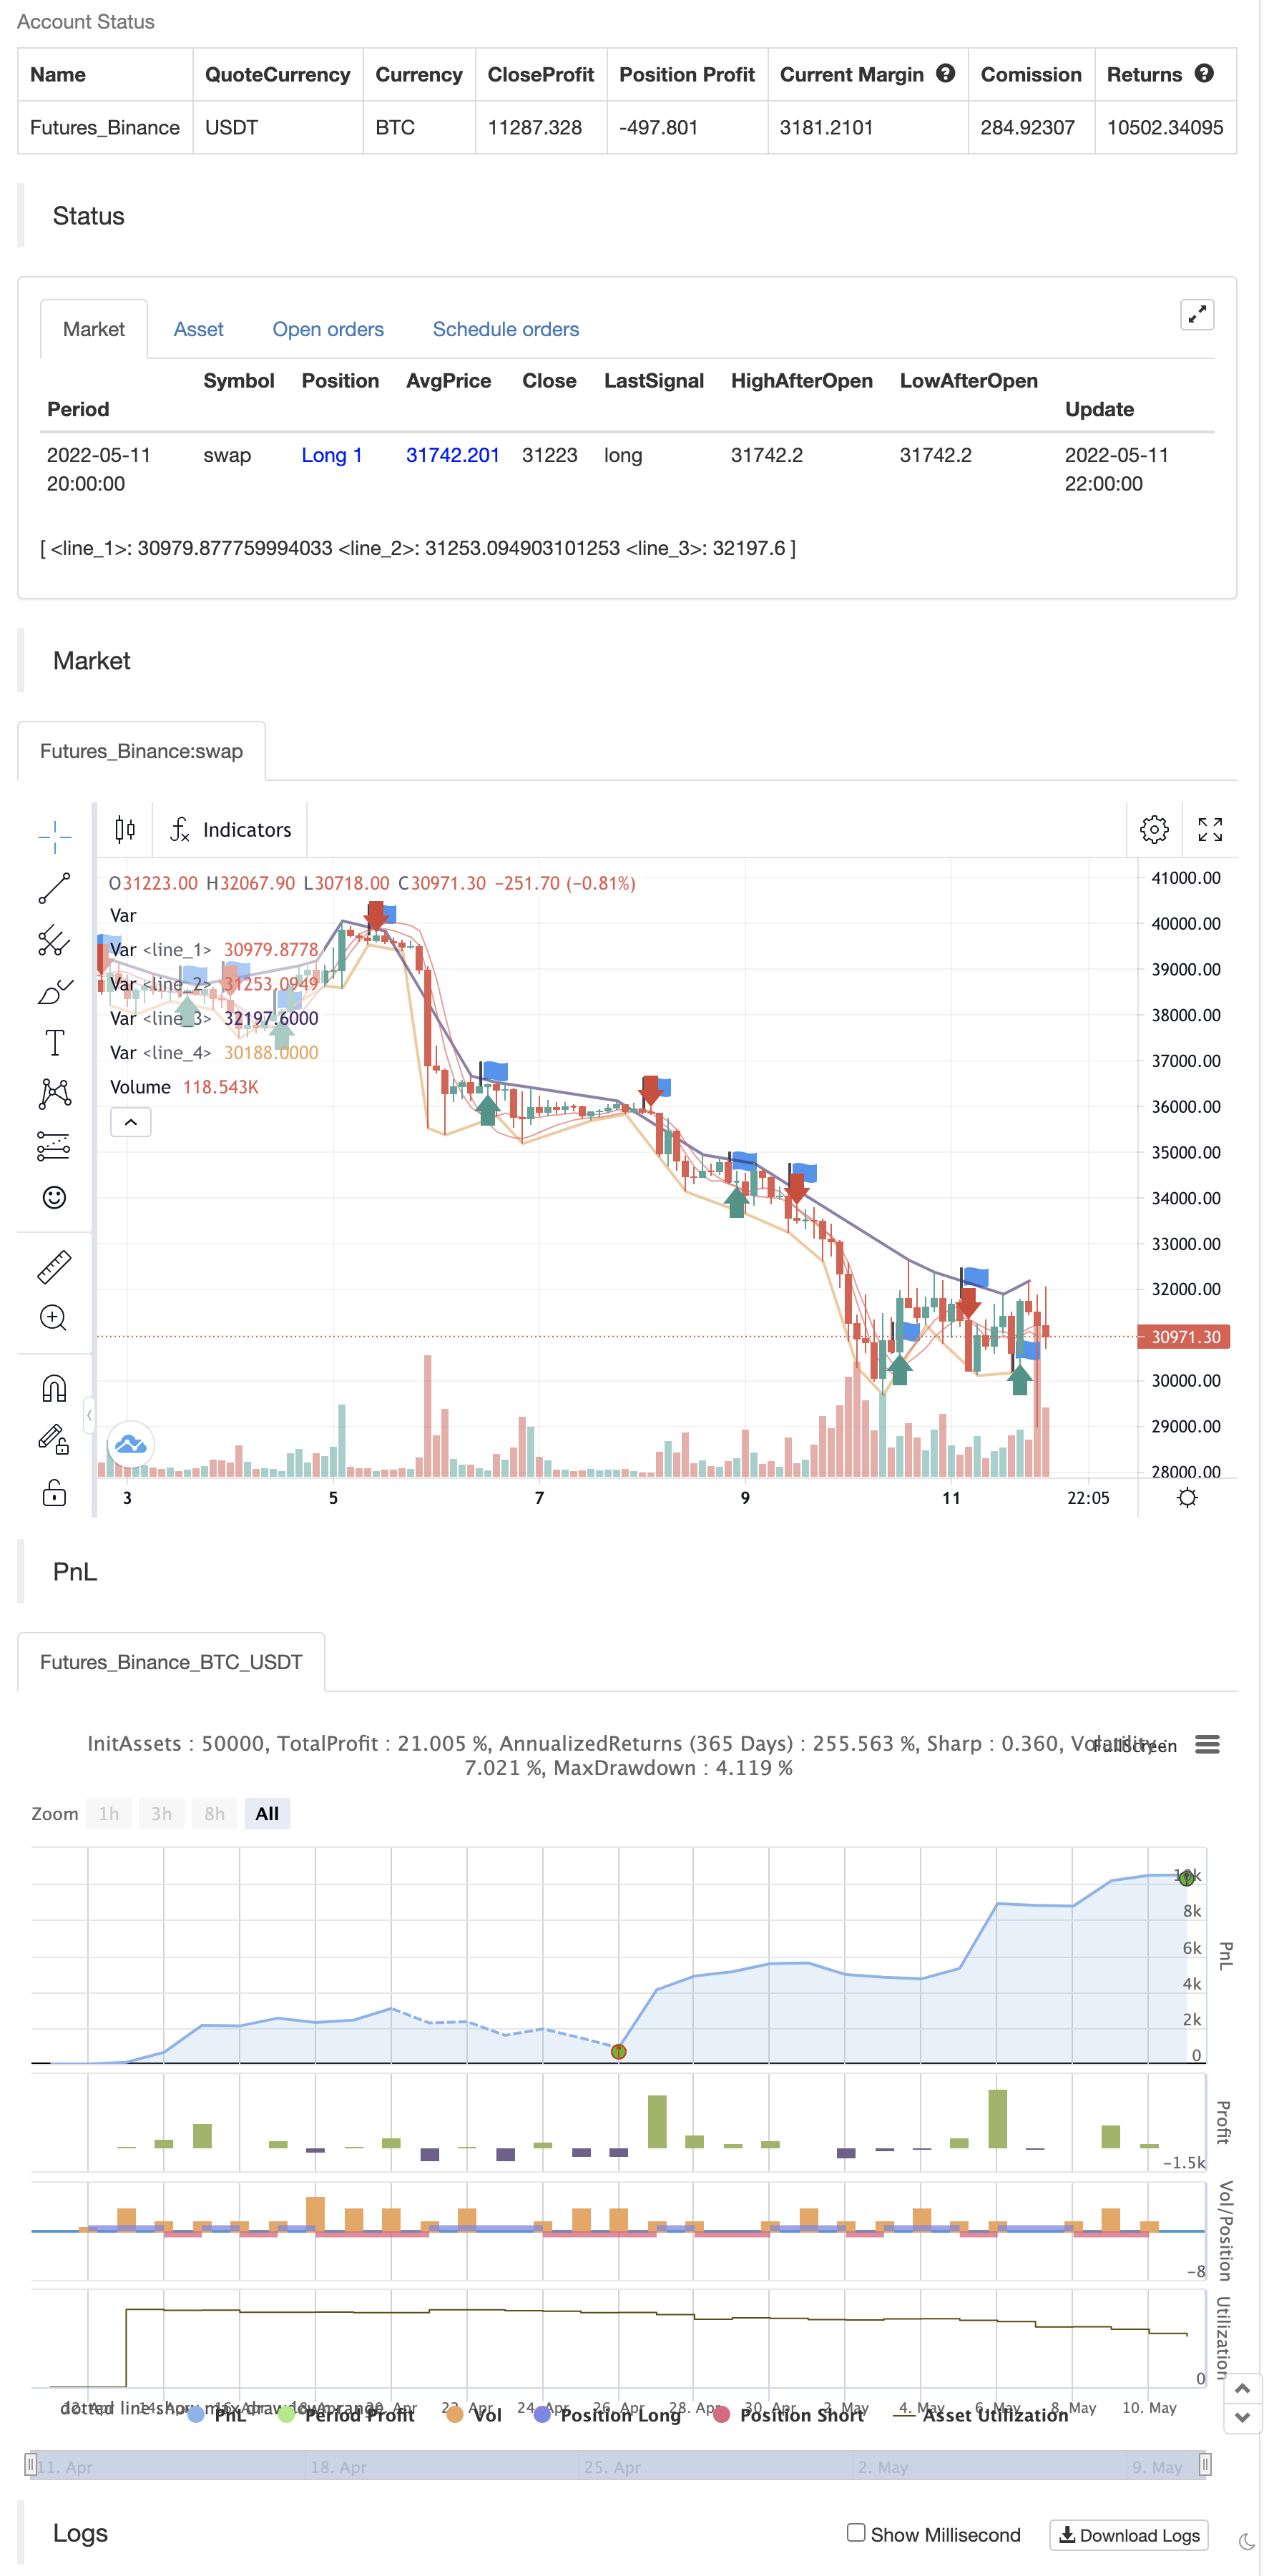
Pada setiap titik waktu, Anda akan melihat hingga 4 garis tren dalam skrip ini.
▶ Trendline bergabung dengan pivot high dalam kondisi uptrend ▶ Trendline bergabung dengan pivot low dalam kondisi uptrend ▶ Trendline bergabung dengan pivot high dalam kondisi downtrend ▶ Trendline bergabung dengan pivot low dalam kondisi downtrend
Garis yang lebih tua akan tetap sampai yang baru datang melalui jenis yang sama. oleh karena itu, Anda masih akan dapat melihat garis tren naik dan rendah untuk instrumen downtrend yang dibuat jauh ke belakang!! Juga, garis tren baru menggantikan yang lama hanya jika mereka lebih kuat (terhubung ke lebih banyak pivot dengan lebih sedikit overflow)
backtest
/*backtest
start: 2022-04-12 00:00:00
end: 2022-05-11 23:59:00
period: 2h
basePeriod: 15m
exchanges: [{"eid":"Futures_Binance","currency":"BTC_USDT"}]
*/

//@version=4
study("BRAHMASTRA", precision=2, overlay=true)
// compilation: capissimo

// This script utilizes two modules, Trendlines Module (by Joris Duyck) and HMA-Kahlman Trend Module.
// Trendlines module produces crossovers predictive of the next local trend.

//*** HMA-Kahlman Trend Module
price  = input(hl2,  "Price Data (hl2)")
hkmod  = input(true, "===HMA-Kahlman Trend Module===")
length = input(22,   "Lookback Window", minval=2)
k      = input(true, "Use Kahlman")
gain   = input(.7,   "Gain", minval=.0001, step=.01)
labels = input(true, "Show Labels?")
o      = input(true, "Use Offset")

hma(x, p) => wma((2 * wma(x, p / 2)) - wma(x, p), round(sqrt(p)))

hma3() => p = length/2, wma(wma(close, p/3)*3 - wma(close, p/2) - wma(close, p), p)

kahlman(x, g) =>
    kf = 0.0
    dk = x - nz(kf[1], x)
    smooth = nz(kf[1],x)+dk*sqrt(g*2)
    velo = 0.0
    velo := nz(velo[1],0) + (g*dk)
    kf := smooth+velo

a = k ? kahlman(hma(price, length), gain) : hma(price, length)
b = k ? kahlman(hma3(), gain) : hma3()
c = b > a ? color.lime : color.red
crossdn = a > b and a[1] < b[1]
crossup = b > a and b[1] < a[1]
ofs = o ? -1 : 0

fill(plot(a,color=c,linewidth=1,transp=75), plot(b,color=c,linewidth=1,transp=75), color=c, transp=55)
plotshape(labels and crossdn ? a : na, location=location.abovebar, style=shape.labeldown, color=color.red, size=size.tiny, text="S", textcolor=color.white, transp=0, offset=ofs)
plotshape(labels and crossup ? a : na, location=location.belowbar, style=shape.labelup, color=color.green, size=size.tiny, text="B", textcolor=color.white, transp=0, offset=ofs)

//*** Trendlines Module, see https://www.tradingview.com/script/mpeEgn5J-Trendlines-JD/
tlmod = input(true, "===Trendlines Module===")
l1    = input(2,    "Pivots Lookback Window", minval=1)

trendline(input_function, delay, only_up) => // Calculate line coordinates (Ax,Ay) - (Bx,By)
    var int Ax = 0, var int Bx = 0, var float By = 0.0, var float slope = 0.0
    Ay = fixnan(input_function)
    if change(Ay)!=0
        Ax := time[delay], By:= Ay[1], Bx := Ax[1]
        slope := ((Ay-By)/(Ax-Bx))
    else
        Ax := Ax[1], Bx := Bx[1], By := By[1]

    var line trendline=na, var int Axbis=0, var float Aybis=0.0, var bool xtend=true
    extension_time = 0
    Axbis := Ax + extension_time
    Aybis := (Ay + extension_time*slope)
    if tlmod and change(Ay)!=0
        line_color = slope*time<0?(only_up?na:color.red):(only_up?color.lime:na)
        if not na(line_color)
            trendline = line.new(Bx,By,Axbis, Aybis, xloc.bar_time, extend=xtend?extend.right:extend.none, color=line_color, style=line.style_dotted, width=1)
            line.delete(trendline[1])
    slope

pivot(len) =>
    high_point = pivothigh(high, len,len/2)
    low_point  = pivotlow(low, len,len/2)
    slope_high = trendline(high_point, len/2,false)
    slope_low  = trendline(low_point, len/2,true)
    [high_point, low_point, slope_high, slope_low]

[high_point1, low_point1, slope_high1, slope_low1] = pivot(l1)

color_high1 = slope_high1 * time<0 ? color.red : na
color_low1  = slope_low1  * time>0 ? color.lime : na
plot(tlmod ? high_point1 : na, color=color_high1, offset=-l1/2, linewidth=2)
plot(tlmod ? low_point1  : na, color=color_low1, offset=-l1/2, linewidth=2)


if crossup
    strategy.entry("Enter Long", strategy.long)
else if crossdn
    strategy.entry("Enter Short", strategy.short)
- Strategi perdagangan kuantitatif berdasarkan Modified Hull Moving Average dan Ichimoku Kinko Hyo
- Strategi perdagangan kuantitatif berdasarkan moving average dan Bollinger Bands
- VWMA-ADX Momentum dan Strategi Bitcoin Long Berbasis Tren
- Stok yang mudah
- Low Scanner strategi crypto
- Scalping EMA ADX RSI dengan Buy/Sell
- Perbedaan Volume
- Hull Moving Average Swing Trader
- Strategi Hull Suite
- Maximizer Keuntungan PMax
- Strategi Swing Hull/rsi/EMA
- Database Strategi Pelacakan Tren Hantu
- Ghoul Trends Track Strategi Perpustakaan Bisnis
- Strategi Pelacakan Tren Hantu
- Rainbow Oscillator
- Perdagangan kurva ekuitas Contoh Ukuran Posisi
- KLineChart Demo
- Villa Dinamic Pivot Supertrend Strategi
- Crodl's Supertrend
- RSI oleh zdmre
- FTL - Range Filter X2 + EMA + UO
- Band Mobo
- SAR + 3SMMA dengan SL & TP
- SSS
- Templat Peringatan Peluncuran Bulan [Indikator]
- HALFTREND + HEMA + SMA (Strategi Sinyal Palsu)
- RSI Divergensi dengan Pivot, BB, SMA, EMA, SMMA, WMA, VWMA
- RSI dan BBand oversold secara bersamaan
- Gulung Lilin Heikin Ashi
- Kombo 2/20 EMA & Filter Bandpass
- ESSMA