Landelier Exit
Penulis:ChaoZhang, Tanggal: 2022-05-17 17:10:19Tag:ATR
Ini adalah desain ulang dari indikator Chandelier Exit. Ini menghilangkan transisi bodoh antara kondisi Chandelier Exit
Indikator ini awalnya dikembangkan oleh Charles Le Beau dan dipopulerkan oleh Dr. Alexander Elder dalam bukunya
Singkatnya, ini adalah stop-loss trailing berdasarkan Average True Range (ATR).
backtest
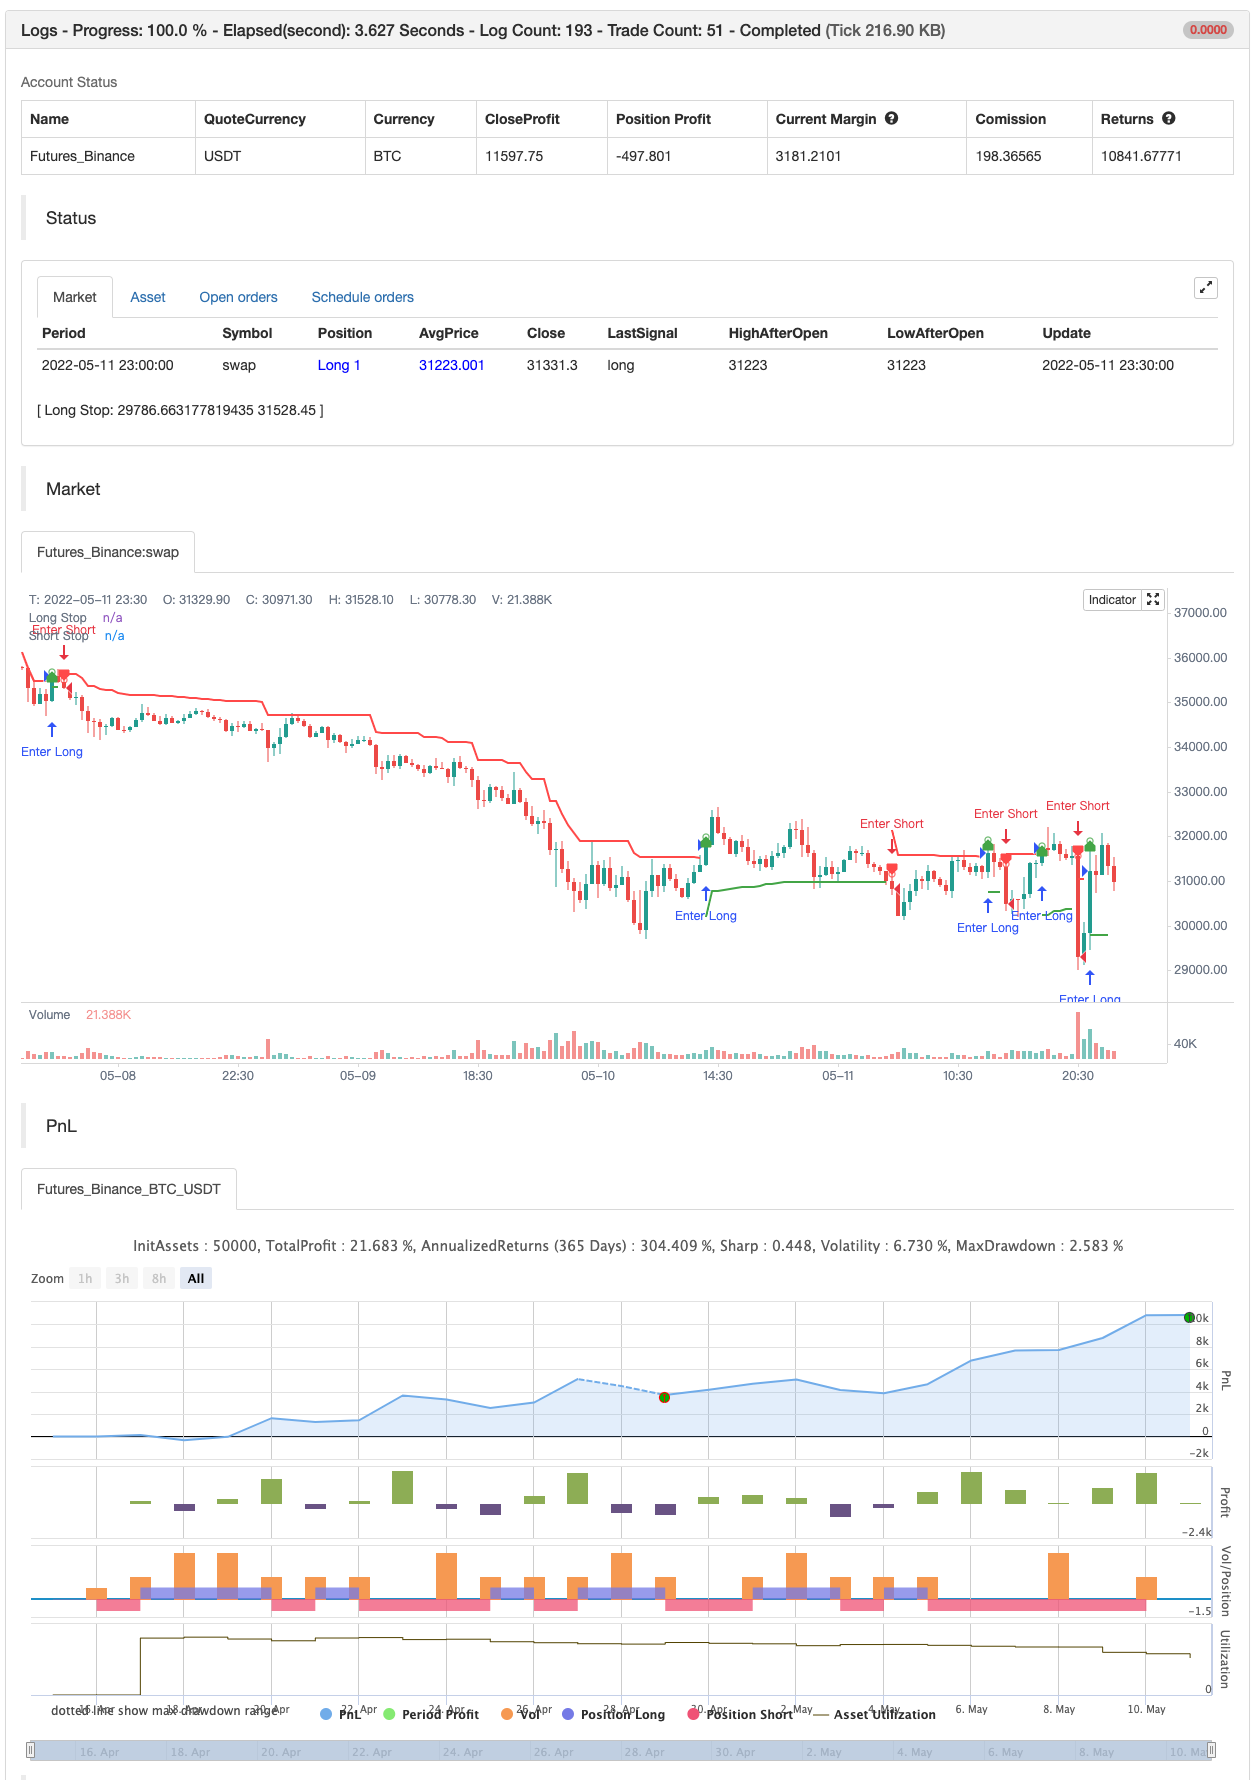
/*backtest
start: 2022-04-16 00:00:00
end: 2022-05-11 23:59:00
period: 30m
basePeriod: 15m
exchanges: [{"eid":"Futures_Binance","currency":"BTC_USDT"}]
*/

//@version=4
// Copyright (c) 2019-present, Alex Orekhov (everget)
// Chandelier Exit script may be freely distributed under the terms of the GPL-3.0 license.
study("Chandelier Exit", shorttitle="CE", overlay=true)

length = input(title="ATR Period", type=input.integer, defval=22)
mult = input(title="ATR Multiplier", type=input.float, step=0.1, defval=3.0)
showLabels = input(title="Show Buy/Sell Labels ?", type=input.bool, defval=true)
useClose = input(title="Use Close Price for Extremums ?", type=input.bool, defval=true)
highlightState = input(title="Highlight State ?", type=input.bool, defval=true)

atr = mult * atr(length)

longStop = (useClose ? highest(close, length) : highest(length)) - atr
longStopPrev = nz(longStop[1], longStop)
longStop := close[1] > longStopPrev ? max(longStop, longStopPrev) : longStop

shortStop = (useClose ? lowest(close, length) : lowest(length)) + atr
shortStopPrev = nz(shortStop[1], shortStop)
shortStop := close[1] < shortStopPrev ? min(shortStop, shortStopPrev) : shortStop

var int dir = 1
dir := close > shortStopPrev ? 1 : close < longStopPrev ? -1 : dir

var color longColor = color.green
var color shortColor = color.red

longStopPlot = plot(dir == 1 ? longStop : na, title="Long Stop", style=plot.style_linebr, linewidth=2, color=longColor)
buySignal = dir == 1 and dir[1] == -1
plotshape(buySignal ? longStop : na, title="Long Stop Start", location=location.absolute, style=shape.circle, size=size.tiny, color=longColor, transp=0)
plotshape(buySignal and showLabels ? longStop : na, title="Buy Label", text="Buy", location=location.absolute, style=shape.labelup, size=size.tiny, color=longColor, textcolor=color.white, transp=0)

shortStopPlot = plot(dir == 1 ? na : shortStop, title="Short Stop", style=plot.style_linebr, linewidth=2, color=shortColor)
sellSignal = dir == -1 and dir[1] == 1
plotshape(sellSignal ? shortStop : na, title="Short Stop Start", location=location.absolute, style=shape.circle, size=size.tiny, color=shortColor, transp=0)
plotshape(sellSignal and showLabels ? shortStop : na, title="Sell Label", text="Sell", location=location.absolute, style=shape.labeldown, size=size.tiny, color=shortColor, textcolor=color.white, transp=0)

midPricePlot = plot(ohlc4, title="", style=plot.style_circles, linewidth=0, display=display.none, editable=false)

longFillColor = highlightState ? (dir == 1 ? longColor : na) : na
shortFillColor = highlightState ? (dir == -1 ? shortColor : na) : na
fill(midPricePlot, longStopPlot, title="Long State Filling", color=longFillColor)
fill(midPricePlot, shortStopPlot, title="Short State Filling", color=shortFillColor)

changeCond = dir != dir[1]
alertcondition(changeCond, title="Alert: CE Direction Change", message="Chandelier Exit has changed direction!")
alertcondition(buySignal, title="Alert: CE Buy", message="Chandelier Exit Buy!")
alertcondition(sellSignal, title="Alert: CE Sell", message="Chandelier Exit Sell!")


if buySignal
    strategy.entry("Enter Long", strategy.long)
else if sellSignal
    strategy.entry("Enter Short", strategy.short)
Berkaitan
- Triple EMA Crossover Strategi
- Strategi Kembali Selasa (Filter Akhir Pekan)
- Strategi Crossover EMA yang ditingkatkan dengan RSI/MACD/ATR
- Tren Multi-Indikator Mengikuti Strategi
- Strategi Pembalikan Tren Fibonacci
- Strategi Perdagangan AlphaTradingBot
- Vegas SuperTrend Strategi Ditingkatkan
- Strategi Pembalikan Tren RSI
- Elliott Wave Theory 4-9 Impulse Wave Deteksi Otomatis Strategi Perdagangan
- Strategi perdagangan volatilitas intraday yang dapat diskalakan
- Trading Trendline Real-time Berdasarkan Titik Pivot dan Slope
Lebih banyak
- Scalping PullBack Tool R1
- Strategi Beli&Jual tergantung pada AO+Stoch+RSI+ATR
- EMA TREND CLOUD
- Rasio energi arah berakselerasi volume RedK
- Donchian Breakout tidak ada cat ulang
- RedK Momentum Bars
- SuperJump Turn Back Bollinger Band
- Tren Fukuiz
- BOT Johny
- SSL hibrida
- RISOTTO
- EMA Cloud Intraday Strategi
- Titik Pivot Supertrend
- Supertrend+4 bergerak
- ZigZag berdasarkan momentum
- VuManChu Cipher B + Divergences Strategi
- Konsep Dual SuperTrend
- Super Scalper
- Pengujian balik- Indikator
- Trendycious