Strategi perdagangan multi-kerangka waktu berdasarkan RSI dan rata-rata pergerakan

Ringkasan
Gagasan inti dari strategi ini adalah untuk menggunakan indeks yang relatif kuat (RSI) dan rata-rata bergerak dari periode waktu yang berbeda untuk mengidentifikasi titik-titik perubahan tren, untuk menangkap tren garis panjang dan menengah dan untuk melakukan perdagangan garis pendek. Strategi ini menggabungkan beberapa sinyal perdagangan untuk meningkatkan tingkat keberhasilan perdagangan.
Prinsip Strategi
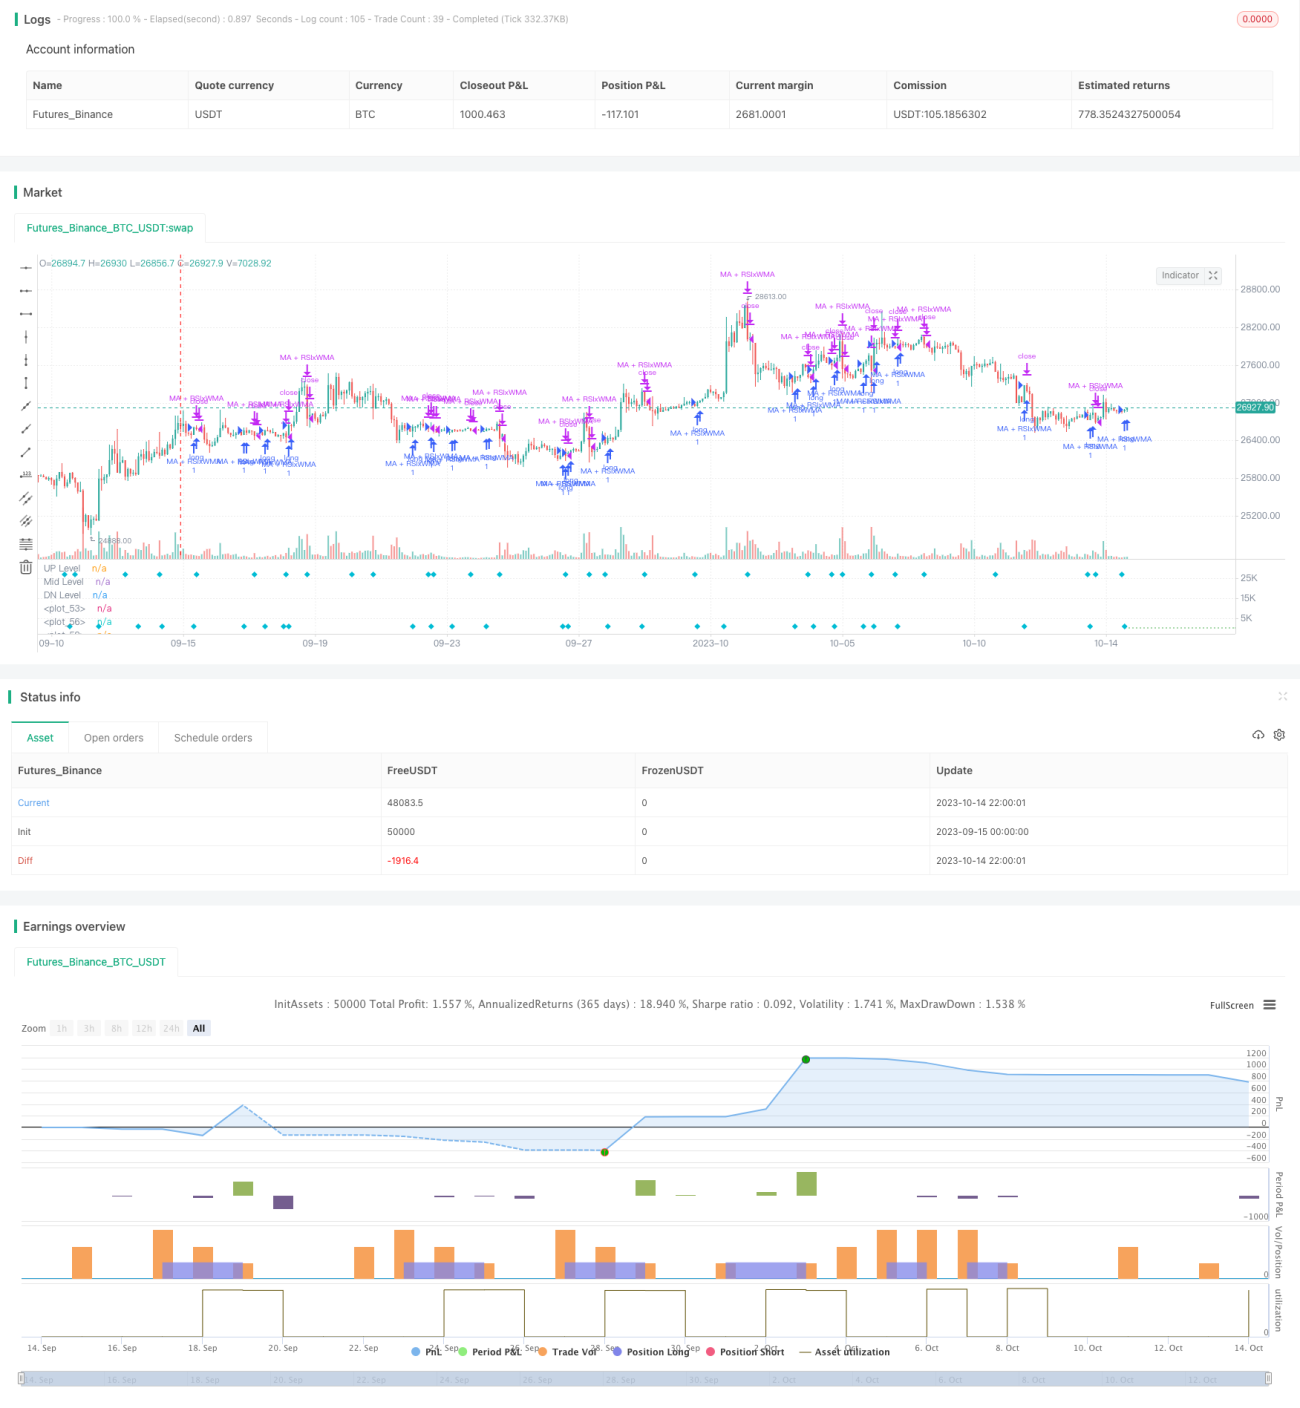
- Hitung indikator RSI, serta EMA garis cepat dan WMA garis lambat
- Ketika RSI menembus WMA, sinyal beli/jual muncul.
- Ketika EMA cepat melewati WMA lambat, menghasilkan sinyal beli/jual.
- Ketika RSI dan EMA menembus WMA pada saat bersamaan, menghasilkan sinyal beli/jual yang kuat.
- Pada saat yang sama, sinyal utama dapat diperkuat ketika harga menembus rata-rata bergerak tambahan.
- Tetapkan Stop Loss dan Stop Stop Condition.
Strategi ini mengintegrasikan sinyal-sinyal terobosan dari berbagai indikator teknis, moving averages dengan pengaturan parameter yang berbeda untuk mengidentifikasi tren dari berbagai periode, sehingga meningkatkan keandalan strategi. Indikator RSI menilai status overbought oversold, EMA garis cepat menilai tren jangka pendek, WMA garis lambat menilai tren jangka menengah, harga dan pembuktian tren terobosan dari rata-rata tambahan.
Analisis Keunggulan
- Menggunakan fitur reversal dari RSI, Anda dapat mengambil peluang reversal di zona overbought dan oversold.
- Membantu Moving Average sebagai filter tren untuk menghindari false breaks.
- Kombinasi dari beberapa periode waktu memungkinkan untuk melacak tren garis panjang dan menangkap peluang garis pendek.
- Dengan menggabungkan berbagai sinyal indikator, Anda dapat meningkatkan tingkat keberhasilan perdagangan Anda.
- Tetapkan strategi Stop Loss Stop Stop yang dapat mengontrol risiko secara proaktif.
Analisis risiko
- Indikator RSI mudah menghasilkan sinyal palsu dan membutuhkan filter rata-rata bergerak tambahan.
- Rebound di bawah tren siklus besar dapat memicu sinyal perdagangan terbalik dan perlu diperhatikan.
- Pengaturan parameter yang harus dioptimalkan, seperti panjang siklus RSI, siklus rata-rata bergerak, dll.
- Pengaturan stop loss harus dilakukan dengan hati-hati untuk menghindari terjadinya kebocoran.
Risiko dapat dikurangi dengan metode seperti pengoptimalan parameter, strategi stop loss yang ketat, dan mempertimbangkan tren siklus besar.
Arah optimasi
- Optimalkan parameter RSI untuk menemukan panjang siklus optimal.
- Uji berbagai jenis kombinasi moving average.
- Tambahkan indikator volatilitas seperti ATR, stop loss stop loss.
- Menambahkan modul manajemen volume transaksi.
- Menggunakan teknologi pembelajaran mesin untuk mengoptimalkan parameter dan menilai kualitas sinyal.
Meringkaskan
Strategi ini mengintegrasikan pemantauan tren dan ide perdagangan reversal titik, menambahkan analisis multi-frame waktu dan penggunaan komprehensif berbagai indikator, dengan tujuan untuk meningkatkan peluang perdagangan. Kuncinya adalah untuk mengendalikan risiko dengan baik, mengoptimalkan pengaturan parameter, dan mempertimbangkan dampak tren siklus besar pada perdagangan pada waktu yang tepat.
- 1