Strategi Perdagangan Trailing Stop Stokastik Supertrend
Ringkasan
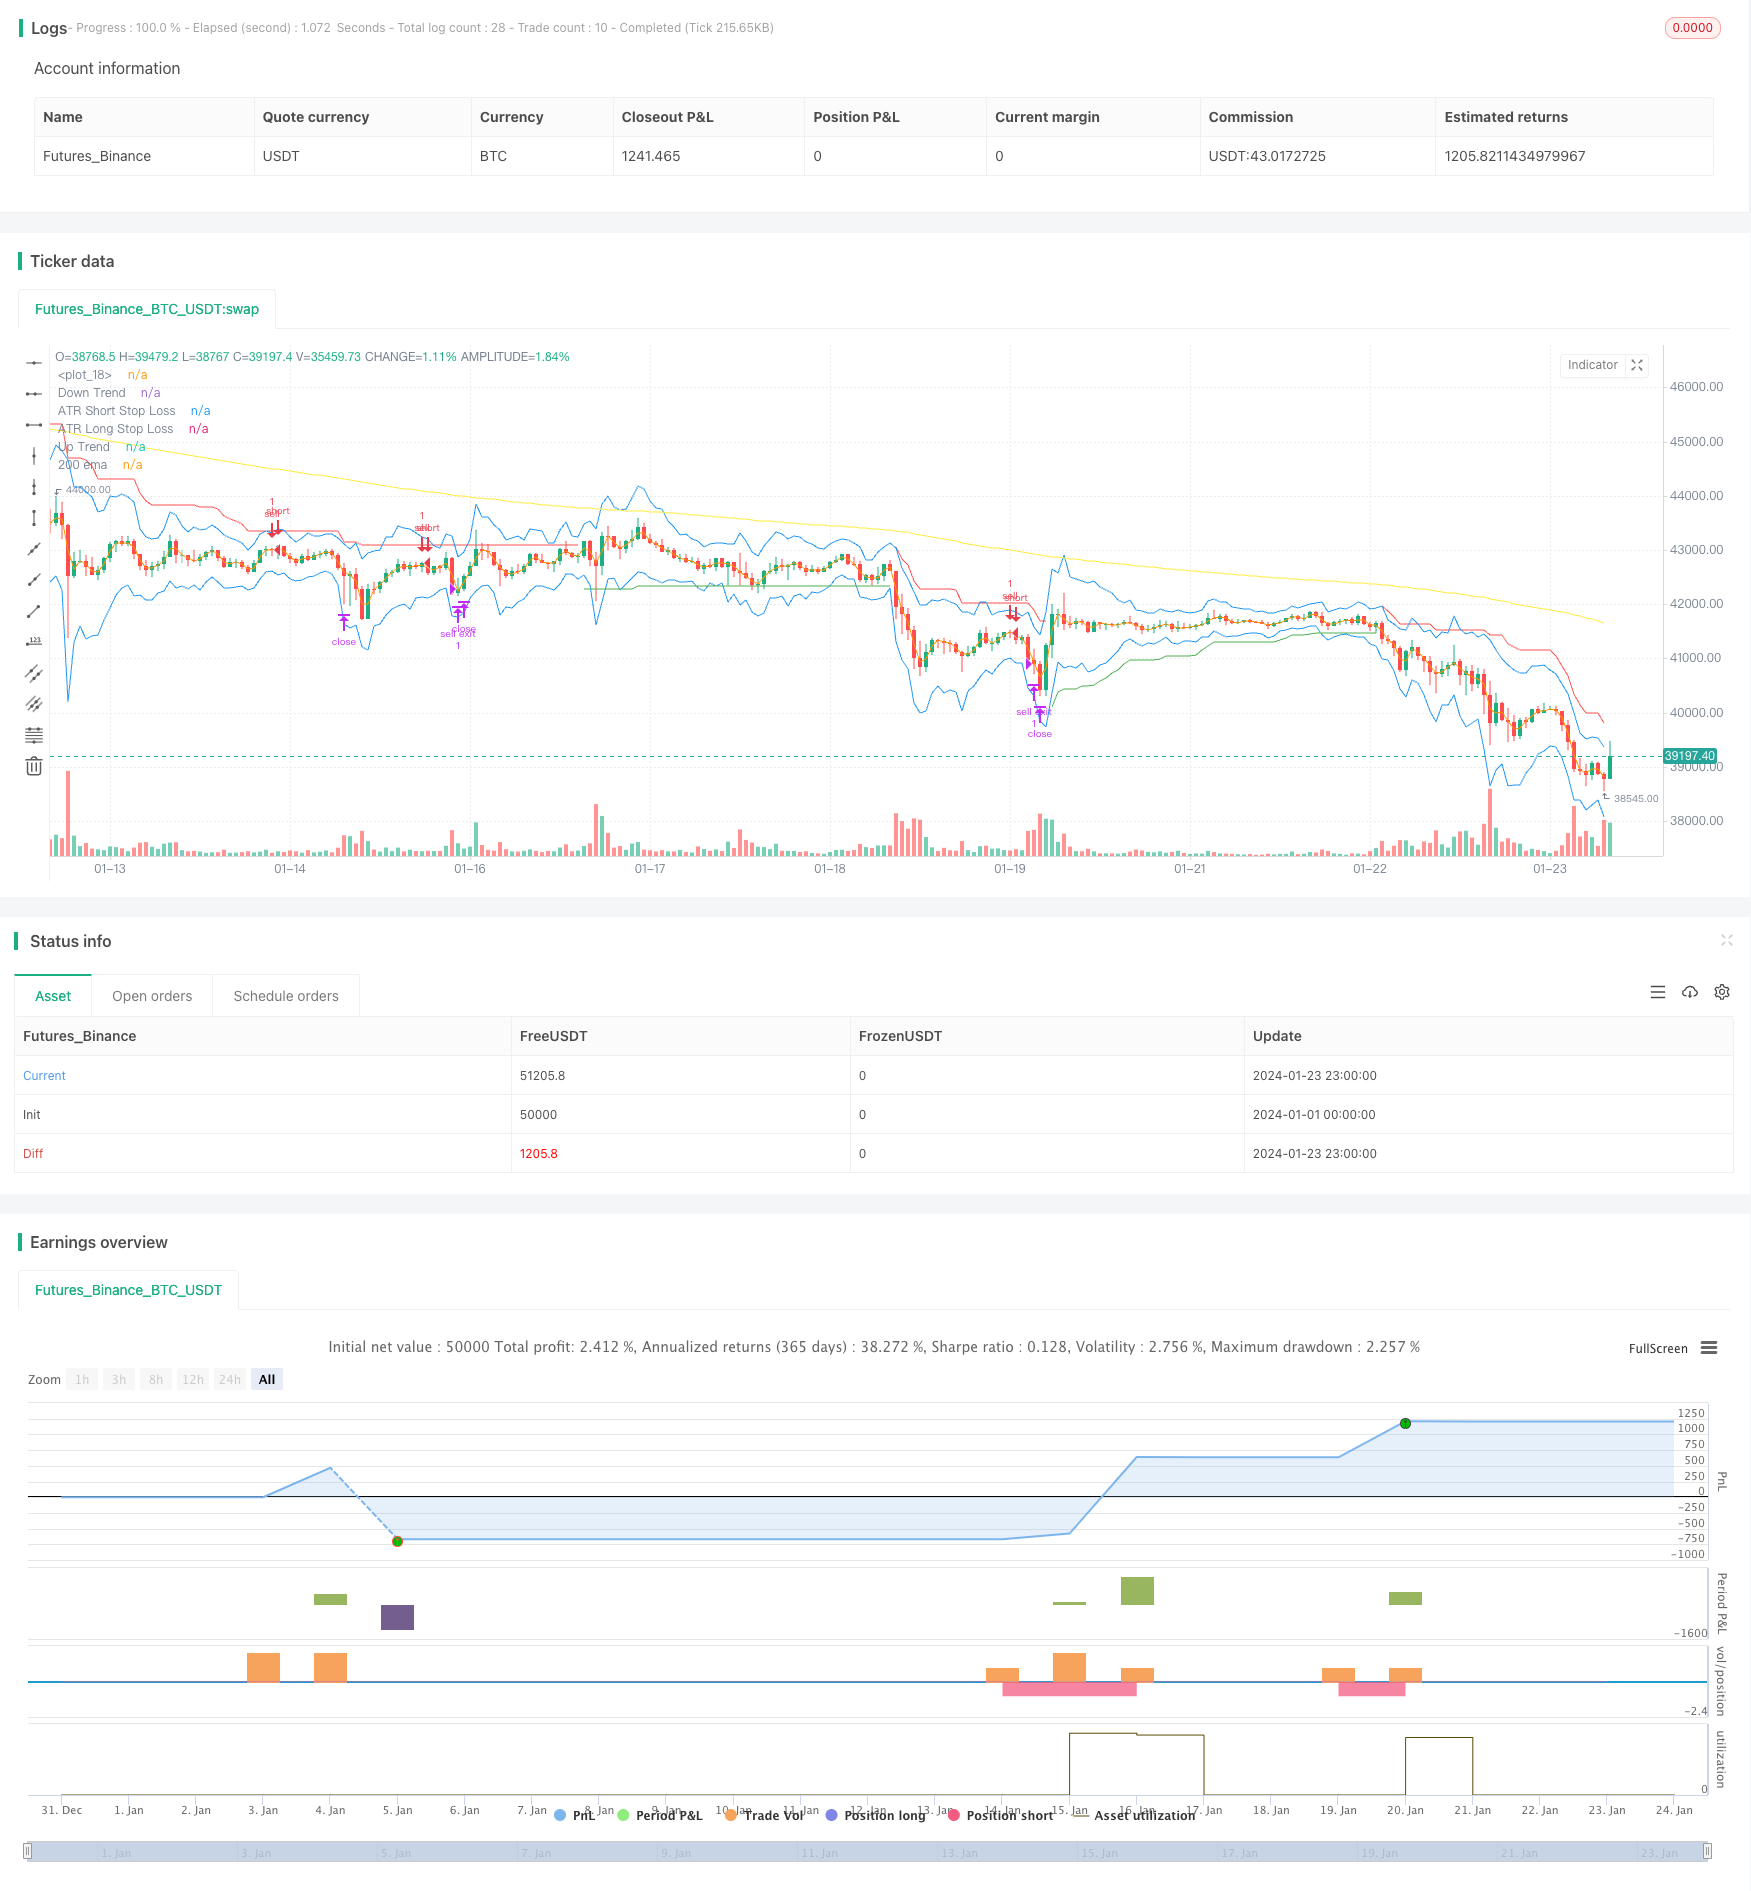
Ini adalah strategi perdagangan stop loss yang menggabungkan beberapa indikator teknis. Ini terutama menggunakan indikator Supertrend, Stochastic, 200-day moving average dan ATR stop loss untuk mengidentifikasi sinyal perdagangan dan mengatur stop loss.
Prinsip Strategi
Ketika garis Stochastic K turun dari zona overbought, Supertrend menunjukkan tren ke atas, dan harga melewati 200-hari moving average, lakukan overbought; ketika garis Stochastic K naik dari zona overbought, Supertrend menunjukkan tren ke bawah, dan harga jatuh dari 200-hari moving average, lakukan shorting. Gunakan indikator ATR untuk mengatur stop loss setelah perdagangan.
Secara khusus, ketika nilai Stochastic K melewati 80, dianggap sebagai sinyal overbought; ketika nilai Stochastic K melewati 20, dianggap sebagai sinyal oversold. Indikator Supertrend menentukan arah tren harga, ketika Supertrend menunjukkan ke atas berarti harga berada dalam tren naik, ketika Supertrend menunjukkan ke bawah berarti harga berada dalam tren turun. Indikator ATR digunakan untuk menghitung gelombang nyata.
Kondisi pemicu sinyal ganda: garis Stochastic K turun dari zona superbeli (<80); Supertrend menunjukkan ke atas; harga lebih tinggi dari rata-rata bergerak 200 hari.
Kondisi pemicu sinyal kosong: Garis Stochastic K naik dari zona oversold (lebih besar dari 20), Supertrend menunjukkan ke bawah, harga di bawah rata-rata bergerak 200 hari.
Setelah masuk, atur stop loss ATR untuk melacak risiko kontrol fluktuasi harga. Stop loss multipel adalah harga minimum dikurangi nilai ATR dikali faktor; Stop loss kosong adalah harga tertinggi ditambah nilai ATR dikali faktor.
Keunggulan Strategis
Strategi ini menggabungkan berbagai indikator untuk menentukan arah tren dan waktu masuk, yang dapat secara efektif menyaring sinyal palsu. Pada saat yang sama, dengan menggunakan ATR yang dinamis untuk melacak stop loss, Anda dapat mengendalikan risiko sesuai dengan kondisi pasar yang berfluktuasi, dan menghemat uang Anda sebanyak mungkin.
Strategi ini dapat menangkap titik balik lebih baik daripada strategi pelacakan tren seperti rata-rata bergerak sederhana. Strategi ATR ini dapat lebih fleksibel dibandingkan dengan stop loss tunggal. Oleh karena itu, strategi ini secara keseluruhan memiliki rasio risiko / keuntungan yang lebih baik.
Risiko Strategis
Strategi ini terutama bergantung pada penilaian indikator, jika indikator mengirimkan sinyal yang salah, dapat menyebabkan kerugian karena operasi terbalik. Selain itu, dalam situasi getaran, stop loss dapat sering dipicu, menyebabkan kerugian.
Selain itu, stop loss ATR, meskipun dapat menyesuaikan posisi stop loss sesuai dengan fluktuasi, tidak dapat sepenuhnya menghindari probabilitas stop loss ditembus. Jika harga melonjak, stop loss order dapat langsung dipicu.
Optimasi Strategi
Strategi ini dapat dioptimalkan dari beberapa dimensi:
Menyesuaikan parameter indikator untuk mengoptimalkan akurasi sinyal beli dan beli. Misalnya, indikator Stochastic yang dapat menguji parameter yang berbeda, atau menyesuaikan siklus ATR dan parameter perkalian dari indikator Supertrend.
Uji efektifitas metode stop loss lainnya. Misalnya, cobalah algoritma stop loss cerdas yang lebih fleksibel daripada stop loss ATR, atau pertimbangkan untuk membuat stop loss mengikuti stop loss yang bergerak.
Menambahkan kondisi penyaringan, masuk dalam situasi yang lebih dapat diandalkan. Misalnya, filter seperti indikator energi volume transaksi dapat ditambahkan, untuk menghindari masuk yang salah berdasarkan indikator ketika kapasitas tidak mencukupi.
Mengoptimalkan strategi pengelolaan dana, misalnya dengan melakukan perubahan posisi secara dinamis.
Meringkaskan
Strategi Stochastic Supertrend Tracking Stop Loss Trading Strategi Stochastic Supertrend Tracking Stop Loss Trading Strategi Stochastic Supertrend Tracking Stop Loss Trading Strategi Stochastic Supertrend Tracking Stop Loss Trading Strategi Stochastic Supertrend Tracking Stop Loss Trading Strategi Stochastic Supertrend Tracking Stop Loss Trading Strategi Stochastic Supertrend Tracking Stop Loss Trading Strategi Stochastic Supertrend Tracking Stop Loss Trading Strategi Stochastic Supertrend Tracking Stop Loss Trading Strategi Stochastic Supertrend Tracking Stop Loss Trading Strategi Stochastic Supertrend Tracking Stop Loss Trading Strategi Stochastic Supertrend Tracking Strategi Stochastic Supertrend Tracking Stop Loss Trading Strategi Stochastic Supertrend Tracking Strategi Stochastic Supertrend Tracking Strategi Stochastic Supertrend Tracking Strategi Stochastic Supertrend Tracking Strategi Stochastic Supertrend Tracking Strategi Stochastic Supertrend Tracking Strategi Stochastic Supertrend Tracking Strategi Stochastic Supertrend Tracking Strategi Stochastic Supertrend Tracking Strategi Stochastic Supertrend Tracking
/*backtest
start: 2024-01-01 00:00:00
end: 2024-01-24 00:00:00
period: 1h
basePeriod: 15m
exchanges: [{"eid":"Futures_Binance","currency":"BTC_USDT"}]
*/

// This source code is subject to the terms of the Mozilla Public License 2.0 at https://mozilla.org/MPL/2.0/
// © araamas

//@version=5
strategy("stoch supertrd atr 200ma", overlay=true, process_orders_on_close=true)
var B = 0
if strategy.position_size > 0 //to figure out how many bars away did buy order happen
    B += 1

if strategy.position_size == 0
    B := 0

atrPeriod = input(10, "ATR Length")
factor = input.float(3.0, "Factor", step = 0.01)

[supertrend, direction] = ta.supertrend(factor, atrPeriod)

bodyMiddle = plot((open + close) / 2, display=display.none)
upTrend = plot(direction < 0 ? supertrend : na, "Up Trend", color = color.green, style=plot.style_linebr)
downTrend = plot(direction < 0? na : supertrend, "Down Trend", color = color.red, style=plot.style_linebr)

ema = ta.ema(close, 200)
plot(ema, title="200 ema", color=color.yellow)

b = input.int(defval=14, title="length k%")
d = input.int(defval=3, title="smoothing k%")
s = input.int(defval=3, title="smoothing d%")
smooth_k = ta.sma(ta.stoch(close, high, low, b), d)
smooth_d = ta.sma(smooth_k, s)

////////////////////////////////////////////////////////////////////////////////
length = input.int(title="Length", defval=12, minval=1)
smoothing = input.string(title="Smoothing", defval="SMA", options=["RMA", "SMA", "EMA", "WMA"])
m = input(1.5, "Multiplier")
src1 = input(high)
src2 = input(low)
pline = input(true, "Show Price Lines")
col1 = input(color.blue, "ATR Text Color")
col2 = input(color.teal, "Low Text Color",inline ="1")
col3 = input(color.red, "High Text Color",inline ="2")

collong = input(color.teal, "Low Line Color",inline ="1")
colshort = input(color.red, "High Line Color",inline ="2")

ma_function(source, length) =>
	if smoothing == "RMA"
		ta.rma(source, length)
	else
		if smoothing == "SMA"
			ta.sma(source, length)
		else
			if smoothing == "EMA"
				ta.ema(source, length)
			else
				ta.wma(source, length)

a = ma_function(ta.tr(true), length) * m
x = ma_function(ta.tr(true), length) * m + src1
x2 = src2 - ma_function(ta.tr(true), length) * m

p1 = plot(x, title = "ATR Short Stop Loss", color=color.blue)
p2 = plot(x2, title = "ATR Long Stop Loss", color= color.blue)


///////////////////////////////////////////////////////////////////////////////////////////////

shortCondition = high < ema and direction == 1 and smooth_k > 80
if (shortCondition) and strategy.position_size == 0
    strategy.entry("sell", strategy.short)

longCondition = low > ema and direction == -1 and smooth_k < 20
if (longCondition) and strategy.position_size == 0
    strategy.entry("buy", strategy.long)

g = (strategy.opentrades.entry_price(0)-x2) * 2
k = (x - strategy.opentrades.entry_price(0)) * 2

if strategy.position_size > 0
    strategy.exit(id="buy exit", from_entry="buy",limit=strategy.opentrades.entry_price(0) + g, stop=x2)

if strategy.position_size < 0
    strategy.exit(id="sell exit", from_entry="sell",limit=strategy.opentrades.entry_price(0) - k, stop=x)

//plot(strategy.opentrades.entry_price(0) - k, color=color.yellow)
//plot(strategy.opentrades.entry_price(0) + g, color=color.red)