株式曲線の取引のポジションサイジング例
作者: リン・ハーンチャオチャン開催日:2022年5月13日 22:25:44タグ:CMOSMA
リスクマネジメントの方法として"株式曲線取引"は,システムのパフォーマンスが戦略が収益的か損をする段階にあるかを示すかどうかに依存して取引信号に反応するプロセスです.
株式曲線を管理するポイントは,株式曲線がダウントレンドにあるとき,取引のリスクを最小限に抑えることである.この戦略は,株式曲線のダウントレンドを決定するための2つのモードを有する: ポートフォリオの株式曲線の2つの単純な移動平均 - 短期および長期間の平均 - を作成し,その交差点に作用する.高速SMAが遅いSMA以下であれば,株式ダウントレンドが検出される (smafastequity < smaslowequity). 2つ目の方法は,長期SMA (equity < smasloweequity) との自己資本の交差を用いることです.
株式曲線で取引する"が有効である場合,選択されたルールに従って株式が"水の下"である場合,ポジションサイズは指定されたパーセントで減少します.リスクを求めるなら,選択してください "% サイズを増やす" - いくつかの堅牢なシステムでは,小さな引き下げをより早く克服するのに役立ちます.
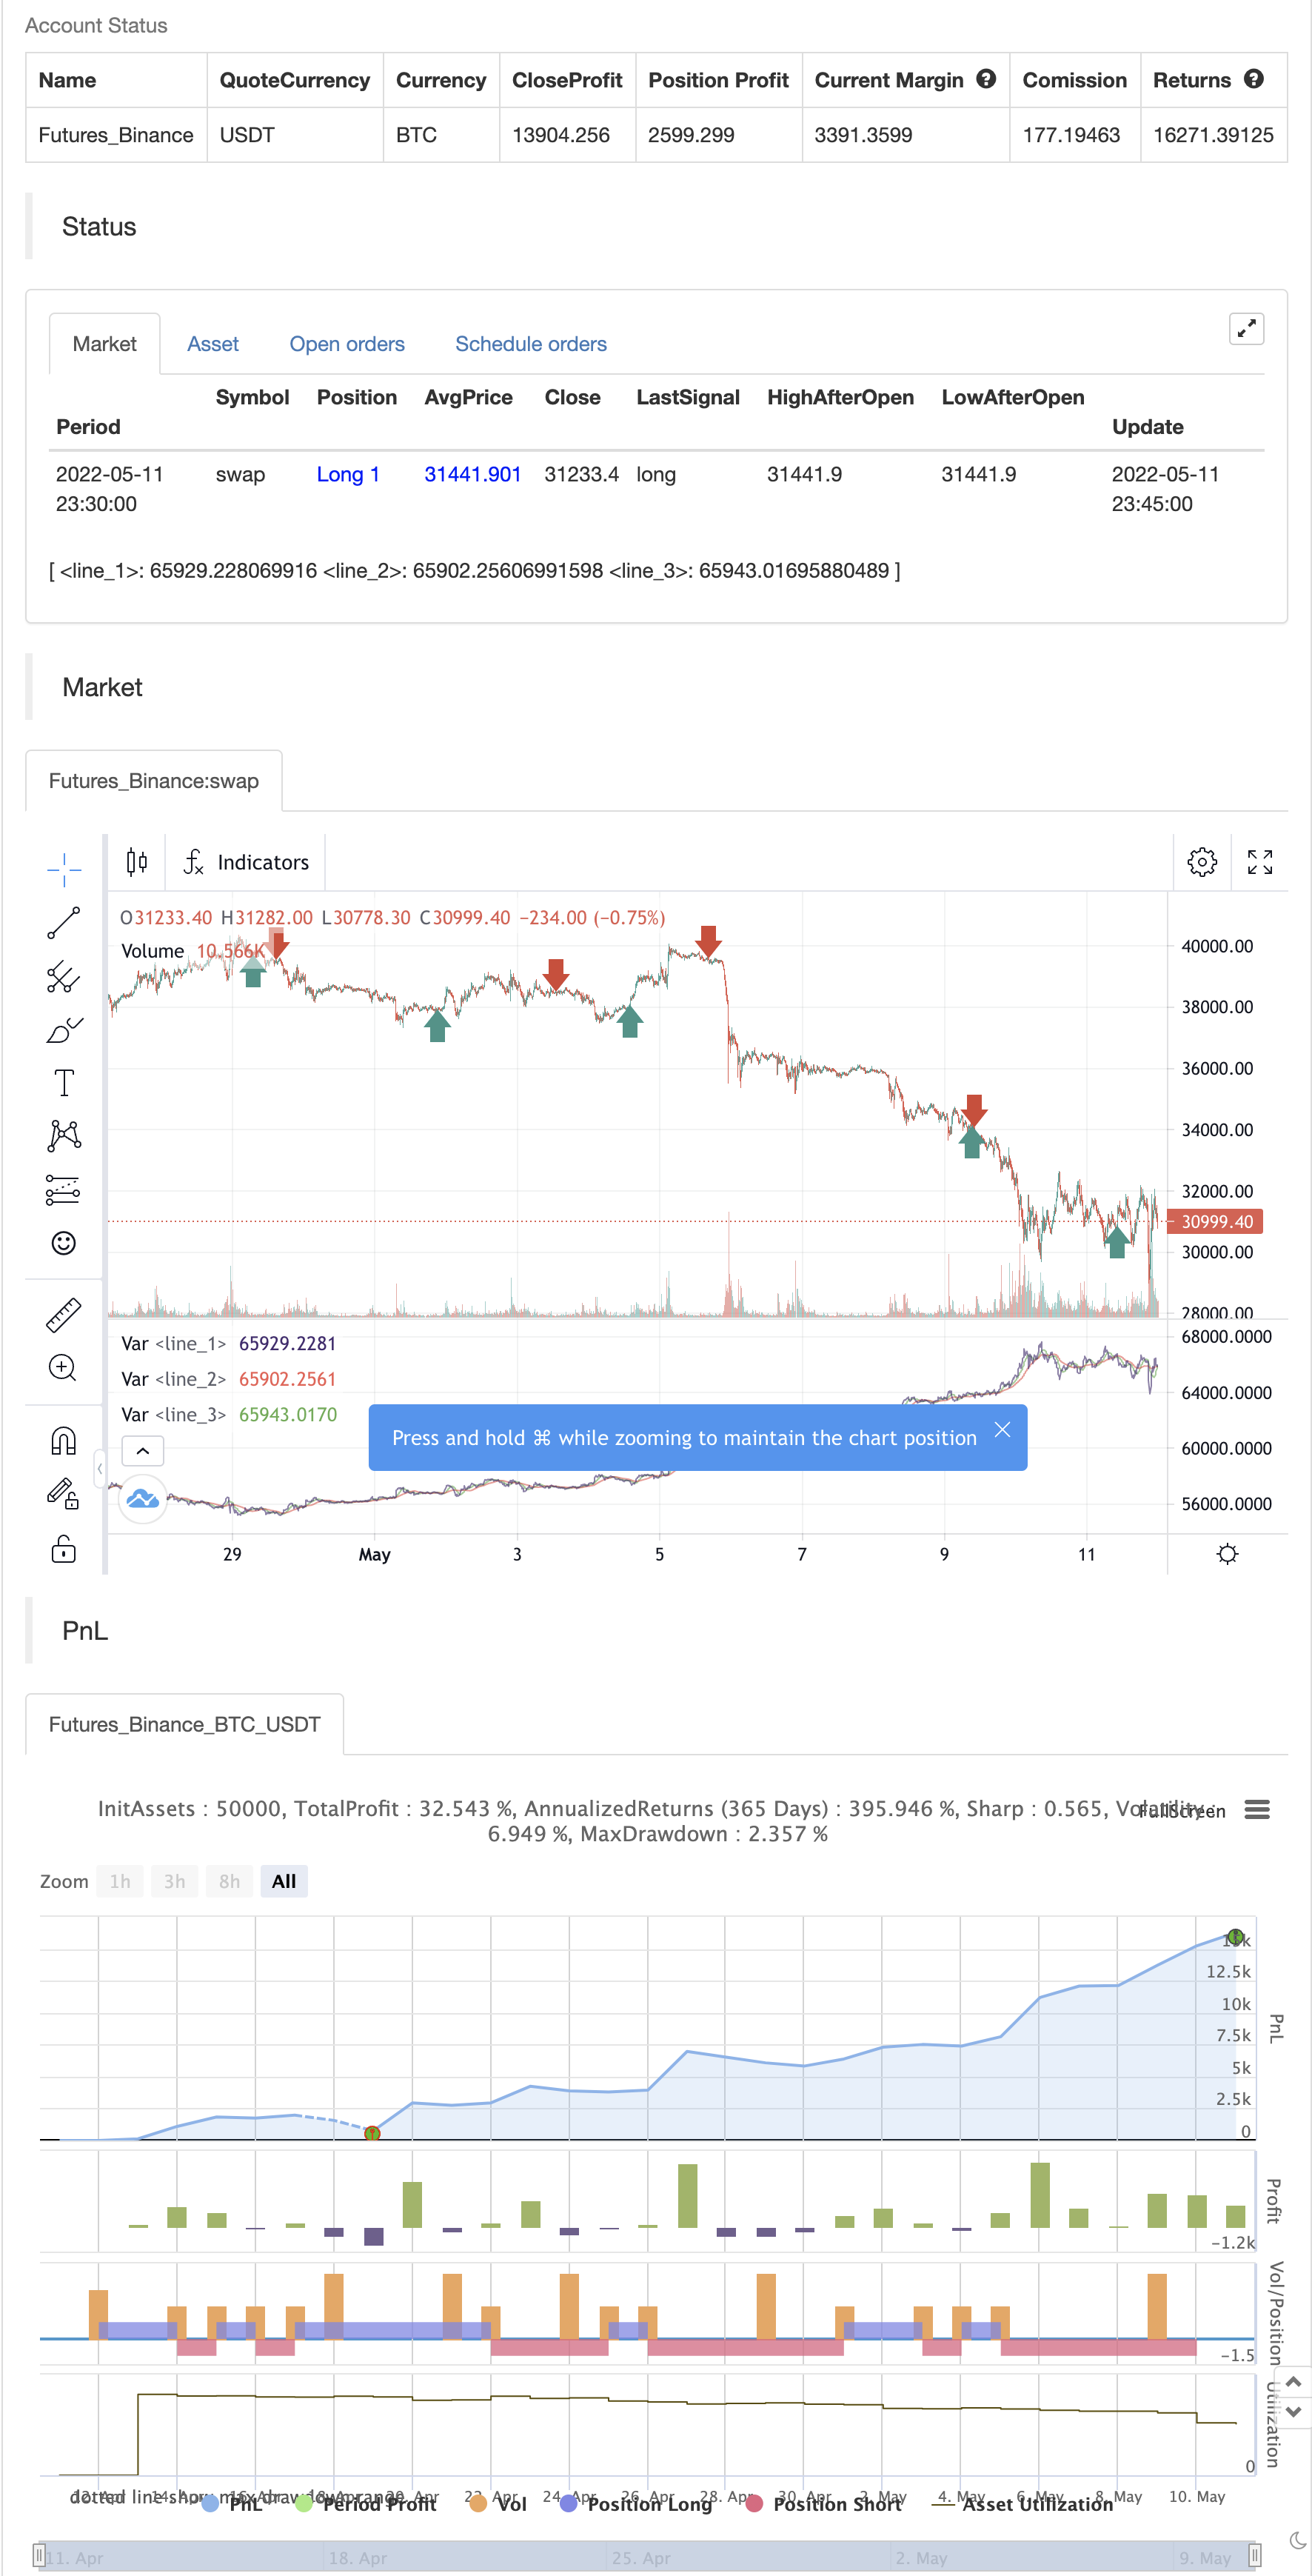
バックテスト
/*backtest
start: 2022-04-12 00:00:00
end: 2022-05-11 23:59:00
period: 15m
basePeriod: 5m
exchanges: [{"eid":"Futures_Binance","currency":"BTC_USDT"}]
*/

// This source code is subject to the terms of the Mozilla Public License 2.0 at https://mozilla.org/MPL/2.0/
// © shardison
//@version=5

//EXPLANATION
//"Trading the equity curve" as a risk management method is the
//process of acting on trade signals depending on whether a system’s performance
//is indicating the strategy is in a profitable or losing phase.
//The point of managing equity curve is to minimize risk in trading when the equity curve is  in a downtrend.
//This strategy has two modes to determine the equity curve downtrend:
//By creating two simple moving averages of a portfolio's equity curve - a short-term
//and a longer-term one - and acting on their crossings. If the fast SMA is below
//the slow SMA, equity downtrend is detected (smafastequity < smaslowequity).
//The second method is by using the crossings of equity itself with the longer-period SMA (equity < smasloweequity).
//When "Reduce size by %" is active, the position size will be reduced by a specified percentage
//if the equity is "under water" according to a selected rule. If you're a risk seeker, select "Increase size by %"
//- for some robust systems, it could help overcome their small drawdowns quicker.

//strategy("Use Trading the Equity Curve Postion Sizing", shorttitle="TEC", default_qty_type = strategy.percent_of_equity, default_qty_value = 10, initial_capital = 100000)

//TRADING THE EQUITY CURVE INPUTS
useTEC           = input.bool(true, title="Use Trading the Equity Curve Position Sizing")
defulttraderule  = useTEC ? false: true
initialsize      = input.float(defval=10.0, title="Initial % Equity")
slowequitylength = input.int(25, title="Slow SMA Period")
fastequitylength = input.int(9, title="Fast SMA Period")
seedequity = 100000 * .10
if strategy.equity == 0
    seedequity
else
    strategy.equity
slowequityseed   = strategy.equity > seedequity ? strategy.equity : seedequity
fastequityseed   = strategy.equity > seedequity ? strategy.equity : seedequity
smaslowequity    = ta.sma(slowequityseed, slowequitylength)
smafastequity    = ta.sma(fastequityseed, fastequitylength)
equitycalc       = input.bool(true, title="Use Fast/Slow Avg", tooltip="Fast Equity Avg is below Slow---otherwise if unchecked uses Slow Equity Avg below Equity")
sizeadjstring    = input.string("Reduce size by (%)", title="Position Size Adjustment", options=["Reduce size by (%)","Increase size by (%)"])
sizeadjint       = input.int(50, title="Increase/Decrease % Equity by:")
equitydowntrendavgs = smafastequity < smaslowequity
slowequitylessequity = strategy.equity < smaslowequity

equitymethod = equitycalc ? equitydowntrendavgs : slowequitylessequity

if sizeadjstring == ("Reduce size by (%)")
    sizeadjdown = initialsize * (1 - (sizeadjint/100))
else
    sizeadjup = initialsize * (1 + (sizeadjint/100))
c = close
qty = 100000 * (initialsize / 100) / c
if useTEC and equitymethod
    if sizeadjstring == "Reduce size by (%)"
        qty := (strategy.equity * (initialsize / 100) * (1 - (sizeadjint/100))) / c
    else
        qty := (strategy.equity * (initialsize / 100) * (1 + (sizeadjint/100))) / c

//EXAMPLE TRADING STRATEGY INPUTS
CMO_Length = input.int(defval=9, minval=1, title='Chande Momentum Length')
CMO_Signal = input.int(defval=10, minval=1, title='Chande Momentum Signal')

chandeMO = ta.cmo(close, CMO_Length)
cmosignal = ta.sma(chandeMO, CMO_Signal)

SuperTrend_atrPeriod = input.int(10, "SuperTrend ATR Length")
SuperTrend_Factor = input.float(3.0, "SuperTrend Factor", step = 0.01)
Momentum_Length = input.int(12, "Momentum Length")
price = close

mom0 = ta.mom(price, Momentum_Length)
mom1 = ta.mom( mom0, 1)
[supertrend, direction] = ta.supertrend(SuperTrend_Factor, SuperTrend_atrPeriod)
stupind = (direction < 0 ? supertrend : na)
stdownind = (direction < 0? na : supertrend)

//TRADING CONDITIONS
longConditiondefault = ta.crossover(chandeMO, cmosignal) and (mom0 > 0 and mom1 > 0 and close > stupind) and defulttraderule
if (longConditiondefault)
    strategy.entry("DefLong", strategy.long)

shortConditiondefault = ta.crossunder(chandeMO, cmosignal) and (mom0 < 0 and mom1 < 0 and close < stdownind) and defulttraderule
if (shortConditiondefault)
    strategy.entry("DefShort", strategy.short)

longCondition = ta.crossover(chandeMO, cmosignal) and (mom0 > 0 and mom1 > 0 and close > stupind) and useTEC
if (longCondition)
    strategy.entry("AdjLong", strategy.long)

shortCondition = ta.crossunder(chandeMO, cmosignal) and (mom0 < 0 and mom1 < 0 and close < stdownind) and useTEC
if (shortCondition)
    strategy.entry("AdjShort", strategy.short)
plot(strategy.equity)
plot(smaslowequity, color=color.new(color.red, 0))
plot(smafastequity, color=color.new(color.green, 0))
関連性
- NMVOB-S
- Bollinger Bandsストカスティックオシレーター戦略
- 信号によるZスコア
- TMA オーバーレイ
- Bollinger Bands 標準偏差突破戦略
- ハースト 境界線戦略の未来
- モボバンド
- 圧縮モメント インディケーター
- ニク・ストック
- 2つのタイムフレームモメント戦略
もっと