チェンデリア出口
作者: リン・ハーンチャオチャン開催日:2022年5月17日17時10分19秒タグ:ATR
これは Chandelier Exit 指標の再設計です. Chandelier Exit 状態の間の愚かな移行を削除し,両線の初期点を強調します.
この指標は,最初はチャールズ・ル・ボによって開発され,アレクサンダー・エルダー博士が彼の本"Come Into My Trading Room: A Complete Guide to Trading" (2002) で普及させた.
ストップ・ロスは,平均値 (ATR) に基づいて決算されます.
バックテスト
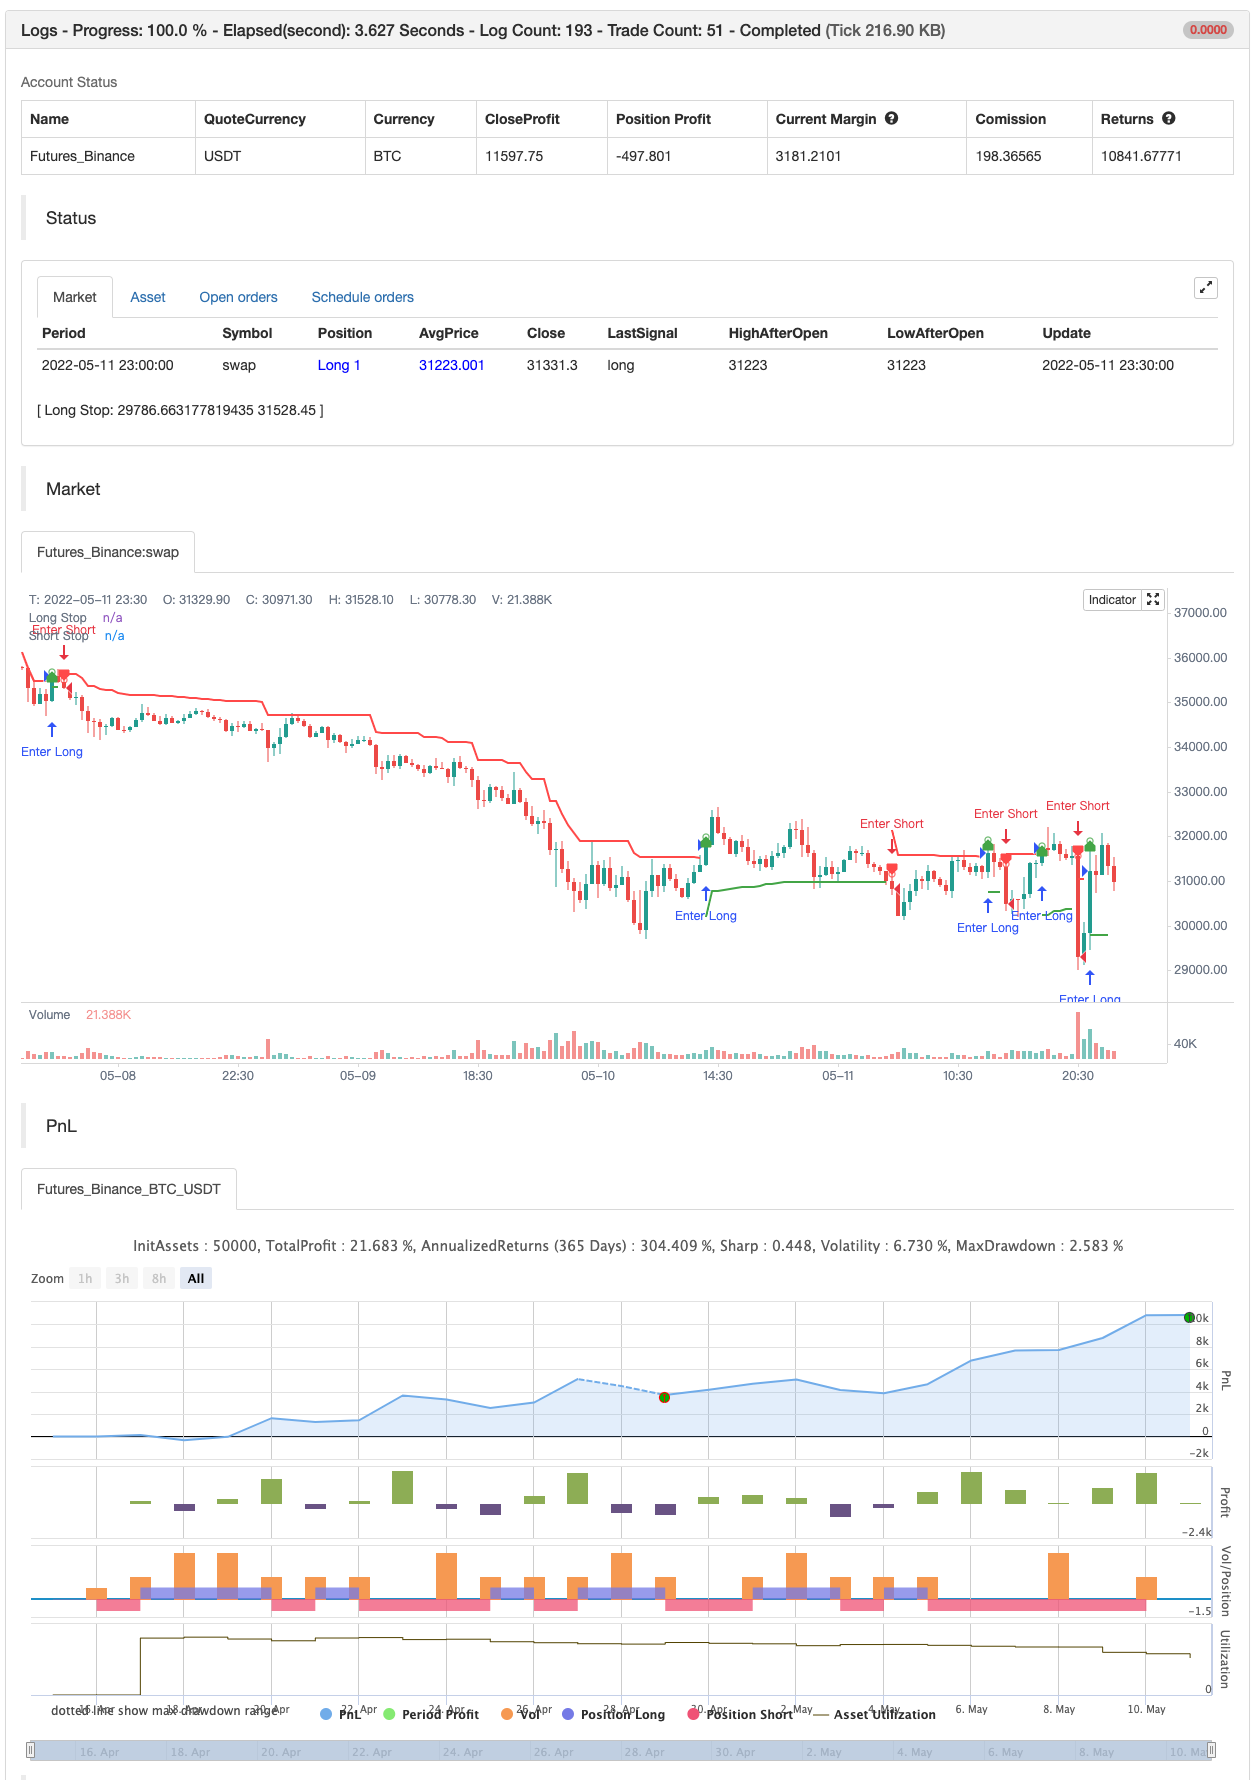
/*backtest
start: 2022-04-16 00:00:00
end: 2022-05-11 23:59:00
period: 30m
basePeriod: 15m
exchanges: [{"eid":"Futures_Binance","currency":"BTC_USDT"}]
*/

//@version=4
// Copyright (c) 2019-present, Alex Orekhov (everget)
// Chandelier Exit script may be freely distributed under the terms of the GPL-3.0 license.
study("Chandelier Exit", shorttitle="CE", overlay=true)

length = input(title="ATR Period", type=input.integer, defval=22)
mult = input(title="ATR Multiplier", type=input.float, step=0.1, defval=3.0)
showLabels = input(title="Show Buy/Sell Labels ?", type=input.bool, defval=true)
useClose = input(title="Use Close Price for Extremums ?", type=input.bool, defval=true)
highlightState = input(title="Highlight State ?", type=input.bool, defval=true)

atr = mult * atr(length)

longStop = (useClose ? highest(close, length) : highest(length)) - atr
longStopPrev = nz(longStop[1], longStop)
longStop := close[1] > longStopPrev ? max(longStop, longStopPrev) : longStop

shortStop = (useClose ? lowest(close, length) : lowest(length)) + atr
shortStopPrev = nz(shortStop[1], shortStop)
shortStop := close[1] < shortStopPrev ? min(shortStop, shortStopPrev) : shortStop

var int dir = 1
dir := close > shortStopPrev ? 1 : close < longStopPrev ? -1 : dir

var color longColor = color.green
var color shortColor = color.red

longStopPlot = plot(dir == 1 ? longStop : na, title="Long Stop", style=plot.style_linebr, linewidth=2, color=longColor)
buySignal = dir == 1 and dir[1] == -1
plotshape(buySignal ? longStop : na, title="Long Stop Start", location=location.absolute, style=shape.circle, size=size.tiny, color=longColor, transp=0)
plotshape(buySignal and showLabels ? longStop : na, title="Buy Label", text="Buy", location=location.absolute, style=shape.labelup, size=size.tiny, color=longColor, textcolor=color.white, transp=0)

shortStopPlot = plot(dir == 1 ? na : shortStop, title="Short Stop", style=plot.style_linebr, linewidth=2, color=shortColor)
sellSignal = dir == -1 and dir[1] == 1
plotshape(sellSignal ? shortStop : na, title="Short Stop Start", location=location.absolute, style=shape.circle, size=size.tiny, color=shortColor, transp=0)
plotshape(sellSignal and showLabels ? shortStop : na, title="Sell Label", text="Sell", location=location.absolute, style=shape.labeldown, size=size.tiny, color=shortColor, textcolor=color.white, transp=0)

midPricePlot = plot(ohlc4, title="", style=plot.style_circles, linewidth=0, display=display.none, editable=false)

longFillColor = highlightState ? (dir == 1 ? longColor : na) : na
shortFillColor = highlightState ? (dir == -1 ? shortColor : na) : na
fill(midPricePlot, longStopPlot, title="Long State Filling", color=longFillColor)
fill(midPricePlot, shortStopPlot, title="Short State Filling", color=shortFillColor)

changeCond = dir != dir[1]
alertcondition(changeCond, title="Alert: CE Direction Change", message="Chandelier Exit has changed direction!")
alertcondition(buySignal, title="Alert: CE Buy", message="Chandelier Exit Buy!")
alertcondition(sellSignal, title="Alert: CE Sell", message="Chandelier Exit Sell!")


if buySignal
    strategy.entry("Enter Long", strategy.long)
else if sellSignal
    strategy.entry("Enter Short", strategy.short)
関連性
- トリプルEMAクロスオーバー戦略
- ターンオーバー火曜日の戦略 (週末フィルター)
- RSI/MACD/ATRとの強化されたEMAクロスオーバー戦略
- 戦略をフォローする多指標の傾向
- フィボナッチトレンド逆転戦略
- AlphaTradingBotの取引戦略
- ベガス スーパートレンド 強化戦略
- RSIのトレンド逆転戦略
- エリオット波理論 4-9 インパルス波自動検出 取引戦略
- 日中の可拡大波動性取引戦略
- Pivot Point と Slope をベースにしたリアルタイムトレンドライン取引
もっと
- Scalping PullBack ツール R1
- 買・売戦略は AO+Stoch+RSI+ATRに依存する
- EMA トレンドクラウド
- RedK ボリューム加速方向エネルギー比
- ドンチアン・ブレイク 塗装なし
- レッドKモメントバー
- スーパージャンプ バックボリンガー帯
- フクイズの傾向
- ジョニーのボット
- SSL ハイブリッド
- リゾット
- EMA クラウド・イントラデイ・戦略
- ピボットポイント スーパートレンド
- スーパートレンド+4移動
- モメントベースのジグザグ
- ヴァンチュ・シッファーB+ディバージェンス戦略
- コンセプト デュアル スーパートレンド
- スーパースカルパー
- バックテスト - 指標
- トレンドリー