CM MACD カスタム インディケーター - 複数のタイムフレーム - V2
作者: リン・ハーンチャオチャン開催日:2022年5月20日17時08分49秒タグ:マックドSMAエイマ
V2 にコードを更新する助けを @SKTennis に感謝します 設定パネルにグループを追加 設定画面に色グラフを追加 MTF ロジックを切り替えて,自動でオン/オフする. 更新された色透明度グラフは将来の更新で動作する オン / オフ ショウ MacD & シグナル ライン を オン / オフ する 追加 機能 オン / オフ ショウ ヒストグラム を オン / オフ する 追加 機能 トレンドに基づいてMACD線色を変更する追加機能 傾向に基づく価格バーを強調する追加機能 設定パネルに警告を追加しました. 設定パネルでチェックしておかなければならない. 警告パネルに行くと,インディケーターにシンボルを変更 (CM_Ult_MacD_MTF_V2) 標識,タイムフレーム,閉値,MACDの上昇と減少の信号を表示するカスタマイズされたアラート 警告は,バーを閉じるときにのみ警告するように設定されています.
バックテスト
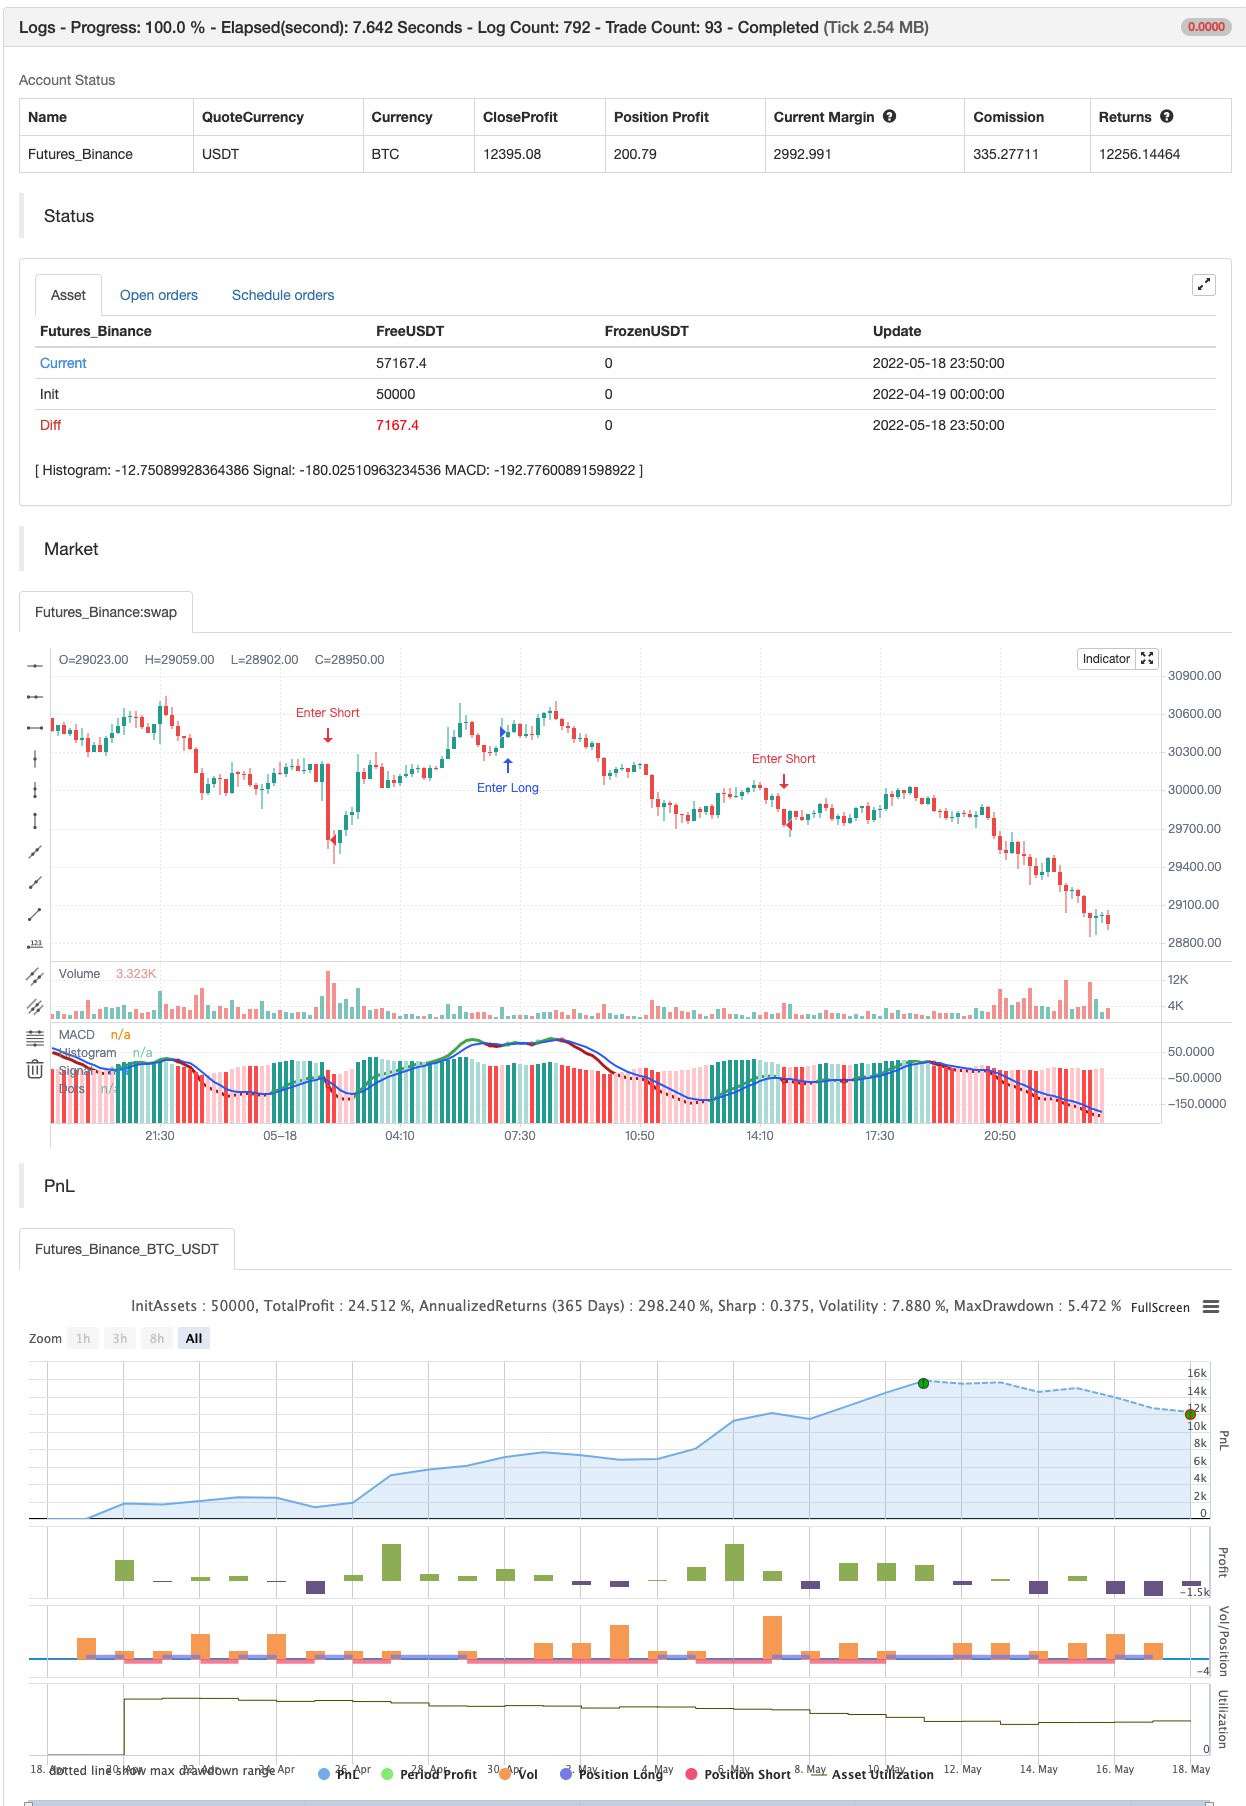
/*backtest
start: 2022-04-19 00:00:00
end: 2022-05-18 23:59:00
period: 10m
basePeriod: 1m
exchanges: [{"eid":"Futures_Binance","currency":"BTC_USDT"}]
*/

//------New V2 Update 07-28-2021----------
//Thanks to @SKTennis for help in Updating code to V2
//Added Groups to Settings Pane.
//Added Color Plots to Settings Pane
//Switched MTF Logic to turn ON/OFF automatically w/ TradingView's Built in Feature
//Updated Color Transparency plots to work in future update
//Added Ability to Turn ON/OFF Show MacD & Signal Line
//Added Ability to Turn ON/OFF Show Histogram
//Added Ability to Change MACD Line Colors Based on Trend
//Added Ability to Highlight Price Bars Based on Trend
//Added Alerts to Settings Pane.
//Customized how Alerts work.  Must keep Checked in Settings Pane, and...
//When you go to Alerts Panel, Change Symbol to Indicator (CM_Ult_MacD_MTF_V2)
//Customized Alerts to Show Symbol, TimeFrame, Closing Price, MACD Crosses Up & MACD Crosses Down Signals in Alert
//Alerts are Pre-Set to only Alert on Bar Close

//------New V2.1 Update 08-03-2021----------
//Added back in ability to show Dots when MACD Crosses.
//Added Ability to Change Plot Widths in Settings Pane
//Added in Alert Feature where Cross Up if above 0 or cross down if below 0 (OFF By Default) user Request. @creid58
//FIXED - Plot Orders to Default what Plots are on top of each other
//FIXED - Two of the histogrm colors were backwrds

//------New V2.1 Update 12-07-2021----------
//Updated to PineScript V5

//------Minor Update 02-16-2022----------
//Per user request...Increased the Maxval for Signal Smoothing
//Next Add in Plot Types to Settings Pane.
//Next Add in more Moving Average types.
//See Video for Detailed Overview

//@version=5
indicator(title="_CM_MacD_Ult_MTF_V2.1", shorttitle="_CM_Ult_MacD_MTF_V2.1")
//Plot Inputs
res           = input.timeframe("",  "Indicator TimeFrame")
fast_length   = input.int(title="Fast Length", defval=12)
slow_length   = input.int(title="Slow Length", defval=26)
src           = input.source(title="Source", defval=close)
signal_length = input.int(title="Signal Smoothing", minval = 1, maxval = 999, defval = 5)
sma_source    = input.string(title="Oscillator MA Type", defval="EMA", options=["SMA", "EMA"])
sma_signal    = input.string(title="Signal Line MA Type", defval="EMA", options=["SMA", "EMA"])
// Show Plots T/F
show_macd     = input.bool(true, title="Show MACD Lines", group="Show Plots?", inline="SP10")
show_macd_LW  = input.int(3, minval=0, maxval=5, title = "MACD Width", group="Show Plots?", inline="SP11")
show_signal_LW= input.int(2, minval=0, maxval=5, title = "Signal Width", group="Show Plots?", inline="SP11")
show_Hist     = input.bool(true, title="Show Histogram", group="Show Plots?", inline="SP20")
show_hist_LW  = input.int(5, minval=0, maxval=5, title = "-- Width", group="Show Plots?", inline="SP20")
show_trend    = input.bool(true, title = "Show MACD Lines w/ Trend Color", group="Show Plots?", inline="SP30")
show_HB       = input.bool(false, title="Show Highlight Price Bars", group="Show Plots?", inline="SP40")
show_cross    = input.bool(false, title = "Show BackGround on Cross", group="Show Plots?", inline="SP50")
show_dots     = input.bool(true, title = "Show Circle on Cross", group="Show Plots?", inline="SP60")
show_dots_LW  = input.int(5, minval=0, maxval=5, title = "-- Width", group="Show Plots?", inline="SP60")

//show_trend    = input(true, title = "Colors MACD Lines w/ Trend Color", group="Show Plots?", inline="SP5")
// MACD Lines colors
col_macd      = input(#FF6D00, "MACD Line  ",  group="Color Settings", inline="CS1")
col_signal    = input(#2962FF, "Signal Line  ",  group="Color Settings", inline="CS1")
col_trnd_Up   = input(#4BAF4F, "Trend Up      ",  group="Color Settings", inline="CS2")
col_trnd_Dn   = input(#B71D1C, "Trend Down    ",  group="Color Settings", inline="CS2")
// Histogram Colors
col_grow_above = input(#26A69A, "Above   Grow",  group="Histogram Colors", inline="Hist10")
col_fall_above = input(#B2DFDB, "Fall",  group="Histogram Colors", inline="Hist10")
col_grow_below = input(#FF5252, "Below Grow",  group="Histogram Colors", inline="Hist20")
col_fall_below = input(#FFCDD2, "Fall",  group="Histogram Colors", inline="Hist20")
// Alerts T/F Inputs
alert_Long    = input.bool(true, title = "MACD Cross Up", group = "Alerts", inline="Alert10")
alert_Short   = input.bool(true, title = "MACD Cross Dn", group = "Alerts", inline="Alert10")
alert_Long_A  = input.bool(true, title = "MACD Cross Up & > 0", group = "Alerts", inline="Alert20")
alert_Short_B = input.bool(true, title = "MACD Cross Dn & < 0", group = "Alerts", inline="Alert20")
// Calculating
fast_ma = request.security(syminfo.tickerid, res, sma_source == "SMA" ? ta.sma(src, fast_length) : ta.ema(src, fast_length))
slow_ma = request.security(syminfo.tickerid, res, sma_source == "SMA" ? ta.sma(src, slow_length) : ta.ema(src, slow_length))
macd = fast_ma - slow_ma
signal = request.security(syminfo.tickerid, res, sma_signal == "SMA" ? ta.sma(macd, signal_length) : ta.ema(macd, signal_length))
hist = macd - signal
// MACD Trend and Cross Up/Down conditions
trend_up   = macd > signal
trend_dn   = macd < signal
cross_UP   = signal[1] >= macd[1] and signal < macd
cross_DN   = signal[1] <= macd[1] and signal > macd
cross_UP_A = (signal[1] >= macd[1] and signal < macd) and macd > 0
cross_DN_B = (signal[1] <= macd[1] and signal > macd) and macd < 0
// Condition that changes Color of MACD Line if Show Trend is turned on..
trend_col = show_trend  and trend_up ? col_trnd_Up : trend_up ? col_macd : show_trend  and trend_dn ? col_trnd_Dn: trend_dn ? col_macd : na

//Var Statements for Histogram Color Change
var bool histA_IsUp = false
var bool histA_IsDown = false
var bool histB_IsDown = false
var bool histB_IsUp = false
histA_IsUp   := hist == hist[1] ? histA_IsUp[1] : hist > hist[1] and hist > 0
histA_IsDown := hist == hist[1] ? histA_IsDown[1] : hist < hist[1] and hist > 0
histB_IsDown := hist == hist[1] ? histB_IsDown[1] : hist < hist[1] and hist <= 0
histB_IsUp   := hist == hist[1] ? histB_IsUp[1] : hist > hist[1] and hist <= 0

hist_col =  histA_IsUp ? col_grow_above : histA_IsDown ? col_fall_above : histB_IsDown ? col_grow_below : histB_IsUp ? col_fall_below :color.silver

// Plot Statements
//Background Color
bgcolor(show_cross and cross_UP ? col_trnd_Up : na, editable=false)
bgcolor(show_cross and cross_DN ? col_trnd_Dn : na, editable=false)
//Highlight Price Bars
barcolor(show_HB and trend_up ? col_trnd_Up : na, title="Trend Up", offset = 0, editable=false)
barcolor(show_HB and trend_dn ? col_trnd_Dn : na, title="Trend Dn", offset = 0, editable=false)
//Regular Plots
plot(show_Hist and hist ? hist : na, title="Histogram", style=plot.style_columns, color=color.new(hist_col ,0),linewidth=show_hist_LW)
plot(show_macd  and signal ? signal : na, title="Signal", color=color.new(col_signal, 0),  style=plot.style_line ,linewidth=show_signal_LW)
plot(show_macd  and macd ? macd : na, title="MACD", color=color.new(trend_col, 0),  style=plot.style_line ,linewidth=show_macd_LW)
hline(0, title="0 Line", color=color.new(color.gray, 0), linestyle=hline.style_dashed, linewidth=1, editable=false)
plot(show_dots and cross_UP ? macd : na, title="Dots", color=color.new(trend_col ,0), style=plot.style_circles, linewidth=show_dots_LW, editable=false)
plot(show_dots and cross_DN ? macd : na, title="Dots", color=color.new(trend_col ,0), style=plot.style_circles, linewidth=show_dots_LW, editable=false)

//Alerts
if alert_Long and cross_UP
    alert("Symbol = (" + syminfo.tickerid + ") TimeFrame = (" + timeframe.period + ") Current Price (" + str.tostring(close) + ") MACD Crosses Up.", alert.freq_once_per_bar_close)

if alert_Short and cross_DN
    alert("Symbol = (" + syminfo.tickerid + ") TimeFrame = (" + timeframe.period + ") Current Price (" + str.tostring(close) + ") MACD Crosses Down.", alert.freq_once_per_bar_close)
//Alerts - Stricter Condition - Only Alerts When MACD Crosses UP & MACD > 0 -- Crosses Down & MACD < 0
if alert_Long_A and cross_UP_A
    alert("Symbol = (" + syminfo.tickerid + ") TimeFrame = (" + timeframe.period + ") Current Price (" + str.tostring(close) + ") MACD > 0 And Crosses Up.", alert.freq_once_per_bar_close)

if alert_Short_B and cross_DN_B
    alert("Symbol = (" + syminfo.tickerid + ") TimeFrame = (" + timeframe.period + ") Current Price (" + str.tostring(close) + ") MACD < 0 And Crosses Down.", alert.freq_once_per_bar_close)

//End Code

if alert_Long_A and cross_UP_A
    strategy.entry("Enter Long", strategy.long)
else if alert_Short_B and cross_DN_B
    strategy.entry("Enter Short", strategy.short)
関連性
- ZeroLag MACD ロングショート戦略
- Kの逆転指標 I
- 移動平均クロスオーバー+MACDスローラインモメント戦略
- MACD BB ブレイクストラテジー
- 月面発射警報テンプレート [指標]
- MACD 再充電戦略
- よりスマートなMACD
- モメントベースのジグザグ
- 量に基づくダイナミックDCA戦略
- エリオット波理論 4-9 インパルス波自動検出 取引戦略
もっと
- 15MIN BTCUSDTPERP BOT
- シャノンエントロピー V2
- 負荷が減る
- ボリュームフロー v3
- 暗号期貨は,ma & rsi - ogcheckersで毎時間スカルパー
- ATR スムーズ化
- オーダーブロックファインダー
- トレンドスカルプ-フラクタルボックス-3EMA
- QQE信号
- U位格子振幅フィルタ
- ホードルライン
- 2 移動平均色方向検知
- Scalping PullBack ツール R1
- 買・売戦略は AO+Stoch+RSI+ATRに依存する
- EMA トレンドクラウド
- RedK ボリューム加速方向エネルギー比
- ドンチアン・ブレイク 塗装なし
- レッドKモメントバー
- スーパージャンプ バックボリンガー帯
- フクイズの傾向