移動平均のクロスアラート,多時間枠 (MTF)
作者: リン・ハーンチャオチャン, 日付: 2022-05-24 11:23:02タグ:SMAエイマWMA
2つの移動平均値が交差するときに 4つの移動平均値の計算から選択できます
SMA = 単純な移動平均値 EMA = 指数関数移動平均値 (デフォルト) WMA = 重度の移動平均値 線形 = 線形回帰
移動平均は,計算のための価格源としてHL2, HLC3またはOHLC4を使用して,週または4時間の時間枠などの異なる時間枠からプロットすることができます. さらに,価格も上昇または低下するときに移動平均が交差する背景色アラートと矢印があります. そして移動平均は,トレンド方向 (上昇または減少傾向がある場合) に基づいて色付けされています.
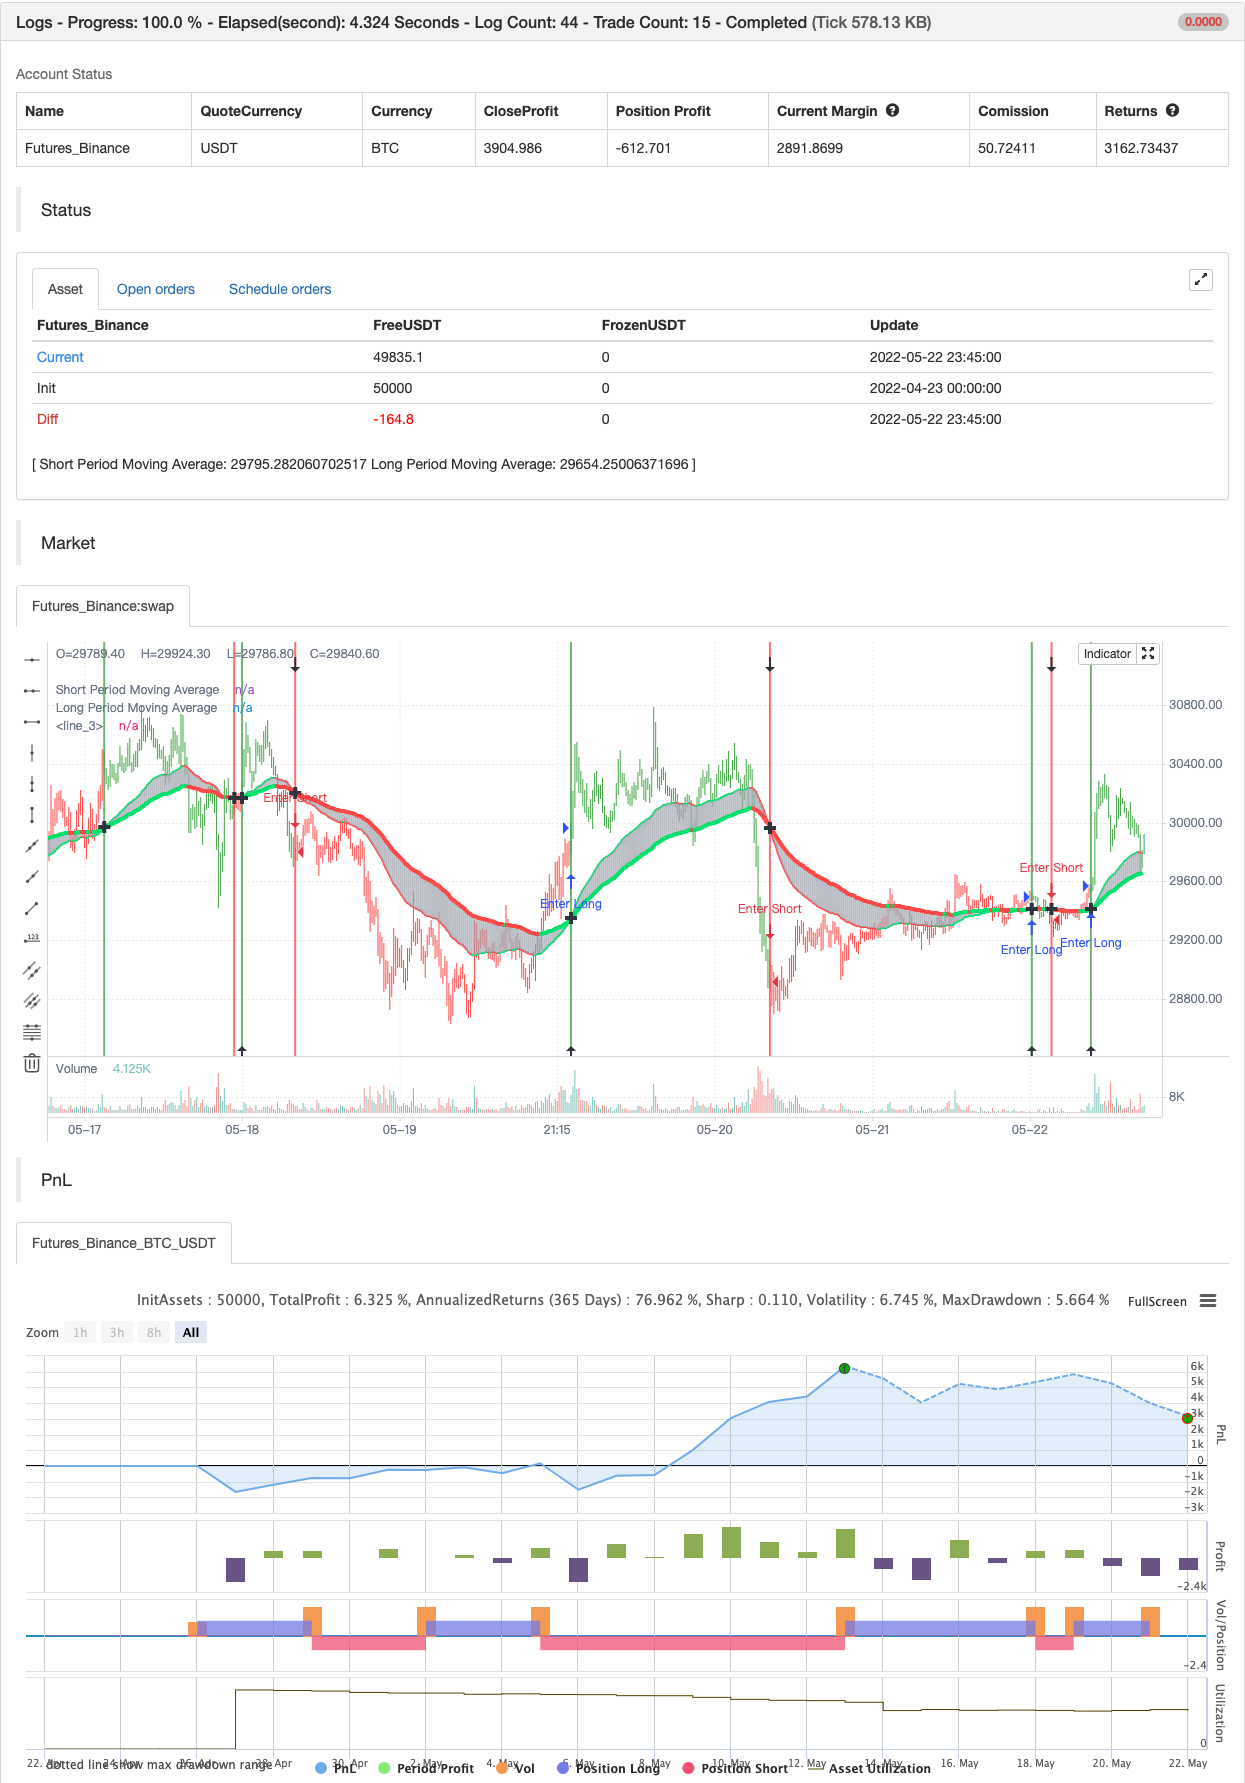
バックテスト
/*backtest
start: 2022-04-23 00:00:00
end: 2022-05-22 23:59:00
period: 15m
basePeriod: 5m
exchanges: [{"eid":"Futures_Binance","currency":"BTC_USDT"}]
*/

study("Moving Average Cross Alert, Multi-Timeframe Option (MTF) (by ChartArt)", shorttitle="CA_-_MA_cross", overlay=true)

// ChartArt's Moving Average Cross Indicator
//
// Version 1.0
// Idea by ChartArt on September 15, 2015.
//
// This indicator shows when two moving averages cross.
// With the option to choose between four moving
// average calculations:
// (SMA = simple moving average)
// (EMA = exponential moving average)
// (WMA = weighted moving average)
// (Linear = Linear regression)
//
// The moving averages can be plotted from different
// timeframes, like the weekly or 4 hour timeframe.
// With the possibility to use HL2, HLC3 or OHLC4 prices.
//
// In addition there is a background color alert
// and arrows when the moving averages cross each other.
// And the moving averages are colored depending if
// they are trending up or down.
//
// List of my work:
// https://www.tradingview.com/u/ChartArt/

//@version=4
// Multi-timeframe and price input
pricetype = input(close, title="Price Source For The Moving Averages")
useCurrentRes = input(true, title="Use Current Timeframe As Resolution?")
resCustom = input(title="Use Different Timeframe? Then Uncheck The Box Above", defval="W")
res = useCurrentRes ? timeframe.period : resCustom
price = security(syminfo.tickerid, res, pricetype)

// MA period input
shortperiod = input(50, title="Short Period Moving Average")
longperiod = input(100, title="Long Period Moving Average")

// MA calculation
smoothinput = input(2, minval=1, maxval=4, title='Moving Average Calculation: (1 = SMA), (2 = EMA), (3 = WMA), (4 = Linear)')
short = smoothinput == 1 ? sma(price, shortperiod) :
   smoothinput == 2 ? ema(price, shortperiod) :
   smoothinput == 3 ? wma(price, shortperiod) :
   smoothinput == 4 ? linreg(price, shortperiod,0) :
   na
long = smoothinput == 1 ? sma(price, longperiod) :
   smoothinput == 2 ? ema(price, longperiod) :
   smoothinput == 3 ? wma(price, longperiod) :
   smoothinput == 4 ? linreg(price, longperiod,0) :
   na

// MA trend direction color
shortcolor = short > short[1] ? lime : short < short[1] ? red : blue
longcolor = long > long[1] ? lime : long < long[1] ? red : blue

// MA output
MA1 = plot(short, title="Short Period Moving Average", style=linebr, linewidth=2, color=shortcolor)
MA2 = plot(long, title="Long Period Moving Average", style=linebr, linewidth=4, color=longcolor)
fill(MA1, MA2, color=silver, transp=50)

// MA trend bar color
TrendingUp() => short > long
TrendingDown() => short < long
barcolor(TrendingUp() ? green : TrendingDown() ? red : blue)

// MA cross alert
MAcrossing = cross(short, long) ? short : na
plot(MAcrossing, style = cross, linewidth = 4,color=black)

// MA cross background color alert
Uptrend() => TrendingUp() and TrendingDown()[1]
Downtrend() => TrendingDown() and TrendingUp()[1]
bgcolor(Uptrend() ? green : Downtrend() ? red : na,transp=50)

// Buy and sell alert
Buy = Uptrend() and close > close[1]
Sell = Downtrend() and close < close[1]
plotshape(Buy, color=black, style=shape.arrowup, text="Buy", location=location.bottom)
plotshape(Sell, color=black, style=shape.arrowdown, text="Sell", location=location.top)


if Buy
    strategy.entry("Enter Long", strategy.long)
else if Sell
    strategy.entry("Enter Short", strategy.short)
関連性
- レッドK ダュアル・ヴァーダー エネルギーバー
- 移動平均値とボリンジャー帯に基づいた定量的な取引戦略
- HALFTREND + HEMA + SMA (誤った信号の戦略)
- RedK ボリューム加速方向エネルギー比
- レインボーオシレーター
- レッドKモメントバー
- エースマ
- スーパースカルパー
- スーパージャンプ バックボリンガー帯
- よりスマートなMACD
もっと
- 三角利息 (小額通貨の格差)
- bybit逆契約動的格子 (特異格子)
- MT4 MT5 + ダイナミック変数へのTradingViewアラート
- マトリックスシリーズ
- スーパースカルパー - 5分 15分
- 相対力指数 - 差異 - リバータス
- 線形回帰 ++
- レッドK ダュアル・ヴァーダー エネルギーバー
- コンソリデーションゾーン - ライブ
- 定量 定性 評価
- MACD 再充電戦略
- 超トレンド移動平均値
- ABC取引
- 15MIN BTCUSDTPERP BOT
- シャノンエントロピー V2
- 負荷が減る
- ボリュームフロー v3
- 暗号期貨は,ma & rsi - ogcheckersで毎時間スカルパー
- ATR スムーズ化
- オーダーブロックファインダー