トレンドフォロー最大移動平均クロスオーバー戦略

1
Follow
1781
Followers
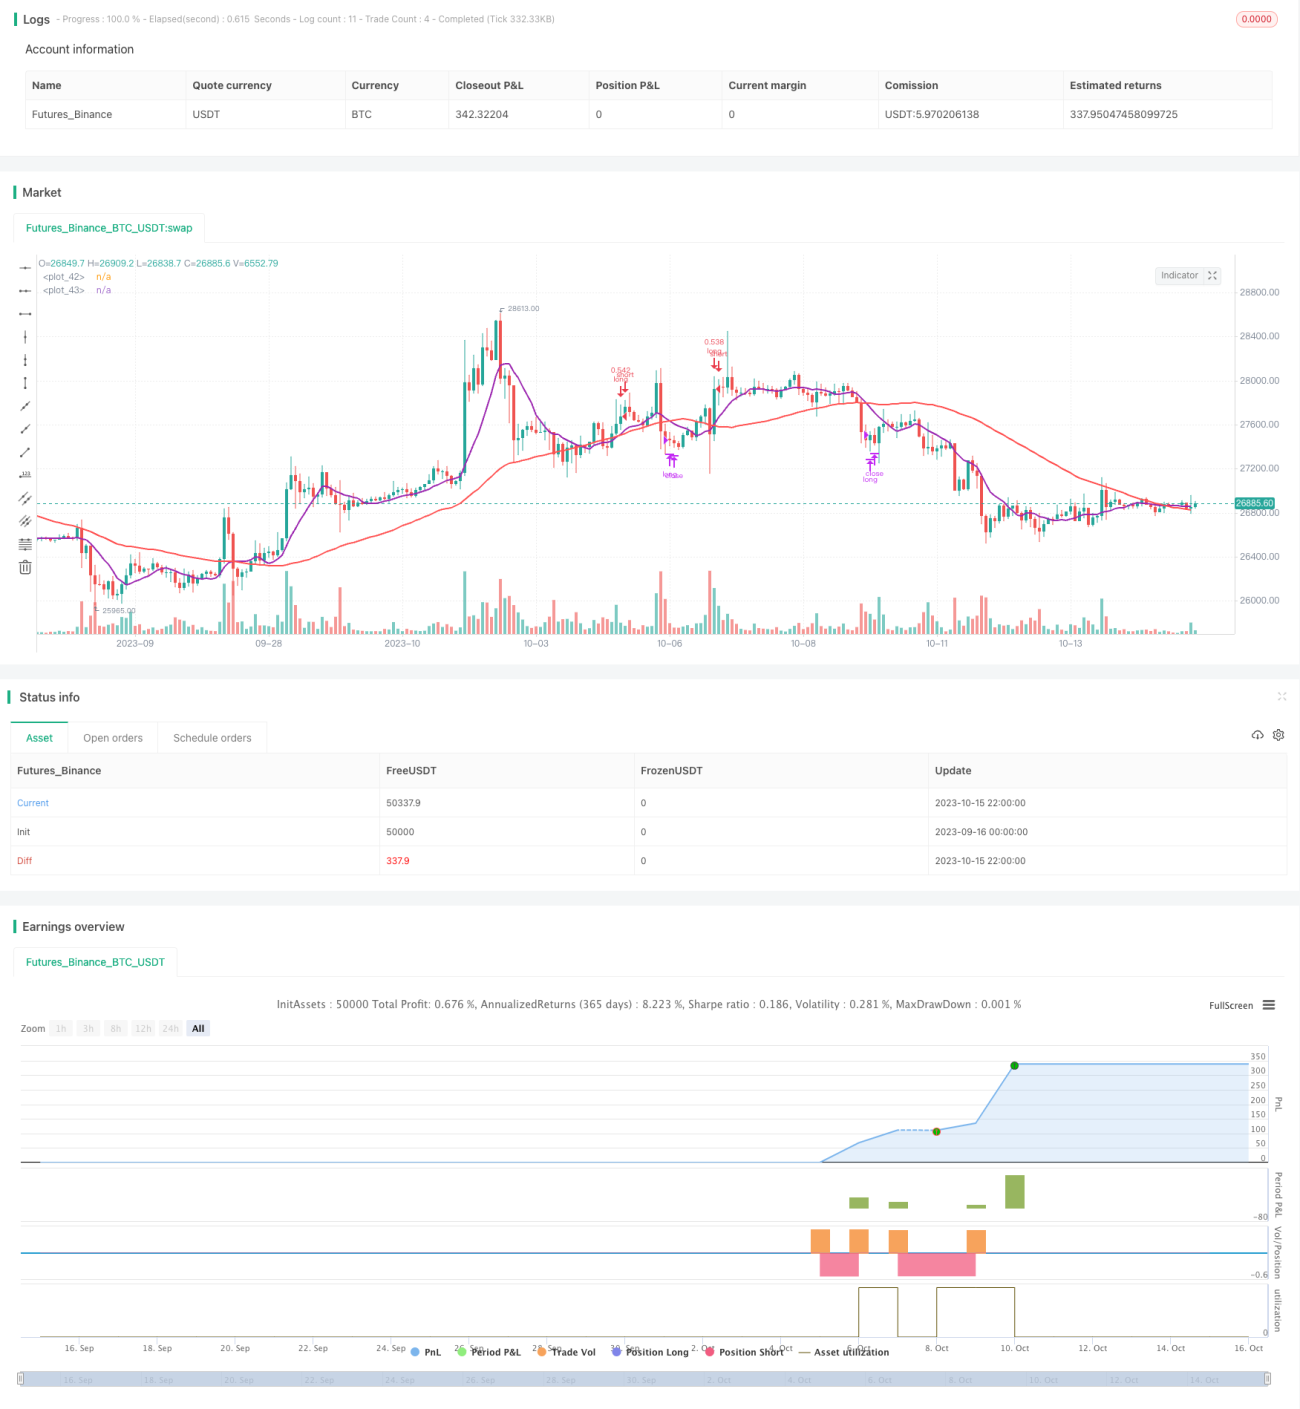
概要
この戦略は,2つの異なる周期の移動平均の交差を利用して取引し,トレンド追跡型の戦略である.戦略は,短期および長期の移動平均の交差で購入シグナルと販売シグナルを利用して,トレンドの動きの中で取引する.
戦略原則
この戦略は9周期の短期移動平均SMAと50周期の長期移動平均LMAを使用する.短期移動平均が下から長期移動平均を横切ると買入シグナルが生じ,短期移動平均が上から下から長期移動平均を横切ると売出シグナルが生じます.
同時に,戦略は,RSI指標がトレンドの強さを判断することを導入した.RSIが設定された<unk>値 (>デフォルト55) よりも大きい場合にのみ,取引シグナルが生成されます.これは,RSIが超売り範囲にあるときに誤ったシグナルを生成することを防ぐことができます.
戦略 取引毎の資金は,総資金の30%を占め,取引費用の0.1%を考慮して,注文を1回だけ開きます.
優位分析
- この戦略は,移動平均の交差形成のトレンド信号を利用して,トレンドの動きを効果的に追跡することができる.
- RSI指標を導入することで,トレンドの強さを判断し,トレンドが阻害されたときに誤ったシグナルを生じることを防ぐことができます.
- デフォルトのパラメータを最適化すると,複数の市場でより安定した収益が得られます.
- 資金管理は合理的で,単一の損失を避けます.
リスク分析
- この戦略は,市場が揺れ動いている時に,誤ったシグナルを発信し,利益を得ることができない.
- トレンドフォロー戦略は,明確なトレンドがない場合,利益を得ることはできません.
- パラメータを正しく設定しない場合,取引が頻繁になり,取引費用が増加する可能性があります.
- 緊急事態の影響を考慮しないことにより,損害が遅れて発生する可能性があります.
利得の機会を判断するためのパラメータの最適化,他の指標の組み合わせ,厳格な資金管理,ストップ・ロスの設定によってリスクを軽減できます.
最適化の方向
- 異なる移動平均の組み合わせをテストし,最適なパラメータを探します.
- MACDなどの他の指標の判断傾向を導入することができます.
- ダイナミック・ストップ・ロスは単一損失を制御するために設定できます.
- 資金管理比率は市場によって調整できます.
- 取引量指数と組み合わせて,トレンドの強さや弱さを見ることができます.
要約する
この戦略は,単純な移動平均の交差システムによってトレンドの機会を捉えます. 標準パラメータは最適化され,収益は安定し,自動取引に適しています. 他の補助指標,最適化パラメータ,停止の改善を導入することにより,戦略の安定性と収益率をさらに向上させることができます.
Source
Pine
/*backtest
start: 2023-09-16 00:00:00
end: 2023-10-16 00:00:00
period: 2h
basePeriod: 15m
exchanges: [{"eid":"Futures_Binance","currency":"BTC_USDT"}]
*/

// This source code is subject to the terms of the Mozilla Public License 2.0 at https://mozilla.org/MPL/2.0/
// © relevantLeader16058

//@version=4Strategy parameters
Related strategies
Comment
All comments (0)
No data
- 1