RSI 平均逆転取引戦略

作者: リン・ハーンチャオチャン開催日:2023年11月1日16時30分
タグ:

img

概要

この戦略は,RSIインジケーターを使用して,トレンドとオーバーバイト/オーバーセール条件を特定します. EMAと組み合わせて,現在のトレンド方向を決定し,トレンド方向がRSI信号と一致するときに逆転ポジションを開設し,平均逆転取引を実施します.

戦略の論理

  1. 現在のトレンド方向を決定するためにEMA指標を使用します.EMAの上は上昇傾向を定義し,EMA下は下落傾向を定義します.

  2. RSI インディケーターを使用して,過買い/過売り状態を特定します.RSI 60を超えると過買いゾーンで,40を下回ると過売りゾーンです.

  3. アップトレンドとRSIが40を下回ると,買い信号が起動します.ダウントレンドとRSIが60を超えると,売り信号が起動します.

  4. 購入/売却のシグナルが発信されると,入場価格の一定の割合に基づいて,利益とストップロスの価格が設定されます.

  5. ポジションサイズが0を超えると 利益を得るオーダーが与えられます.ポジションサイズが0未満の場合 ストップ・ロスは与えられます.

利点分析

  1. この戦略は,EMAとRSIを合理的に組み合わせて,トレンドと過買い/過売りの条件を特定し,トレンドに反する取引を避ける.

  2. 平均逆転アプローチは,短期間の利益の回転を捉える.

  3. 利益とストップ・ロスのポイントは 利益とリスクの制御に役立ちます

  4. シンプルで明快な論理で 分かりやすく実行し 初心者にも適しています

  5. EMA期間やRSIのようなパラメータは,異なる製品や市場環境に最適化できます.

リスク分析

  1. 失敗した逆転リスク 短期的な逆転は失敗し,損失を伴う可能性があります

  2. 不明なトレンドリスク EMAは,変動市場における明確なトレンドを特定できず,間違った信号を生成する可能性があります.

  3. ストップ・ロスはリスクが引き起こす.ストップ・ロスはあまりにも近く設定されれば,予期せぬように引き起こす可能性があります.

  4. 過剰なリスク 履歴データに対する過剰な最適化は,ライブ取引には適用されない可能性があります.

  5. 取引頻度が高いリスク.取引頻度が高い場合,大きな取引コストがかかります.

改善

  1. EMAとRSIのパラメータを最適化して バックテストで最適な組み合わせを見つけます

  2. 例えば,音量条件を追加します.

  3. 利得を固定するために,利得/ストップ損失比を最適化します.ストップ損失は,あまりにも幅が広くないはずです.

  4. 単一の取引損失を制御するために固定分数のようなポジションサイズルールを追加します.

  5. MACD,KDなどの他の指標を組み合わせて信号の精度を向上させたり 多変数モデルを使用します.

  6. 現時点でのデータでバックテストし 最新の市場状況に合わせて 継続的に最適化します

結論

この戦略は,EMAとRSIに基づいた短期平均逆転アプローチを実装し,トレンド識別とオーバーバイト/オーバーセール検出の明確な論理を有する.短期回転から利益を得ながらリスクを制御するために利益とストップ損失を設定する. シンプルさと明確性は利点である.さらなる最適化により良いバックテスト結果が得られる. しかし,失敗した逆転やレンジング市場などのリスクはライブ取引に注意すべきである. 全体的に,初心者が学ぶためのシンプルで実践的な短期取引アイデアを提供します.


/*backtest
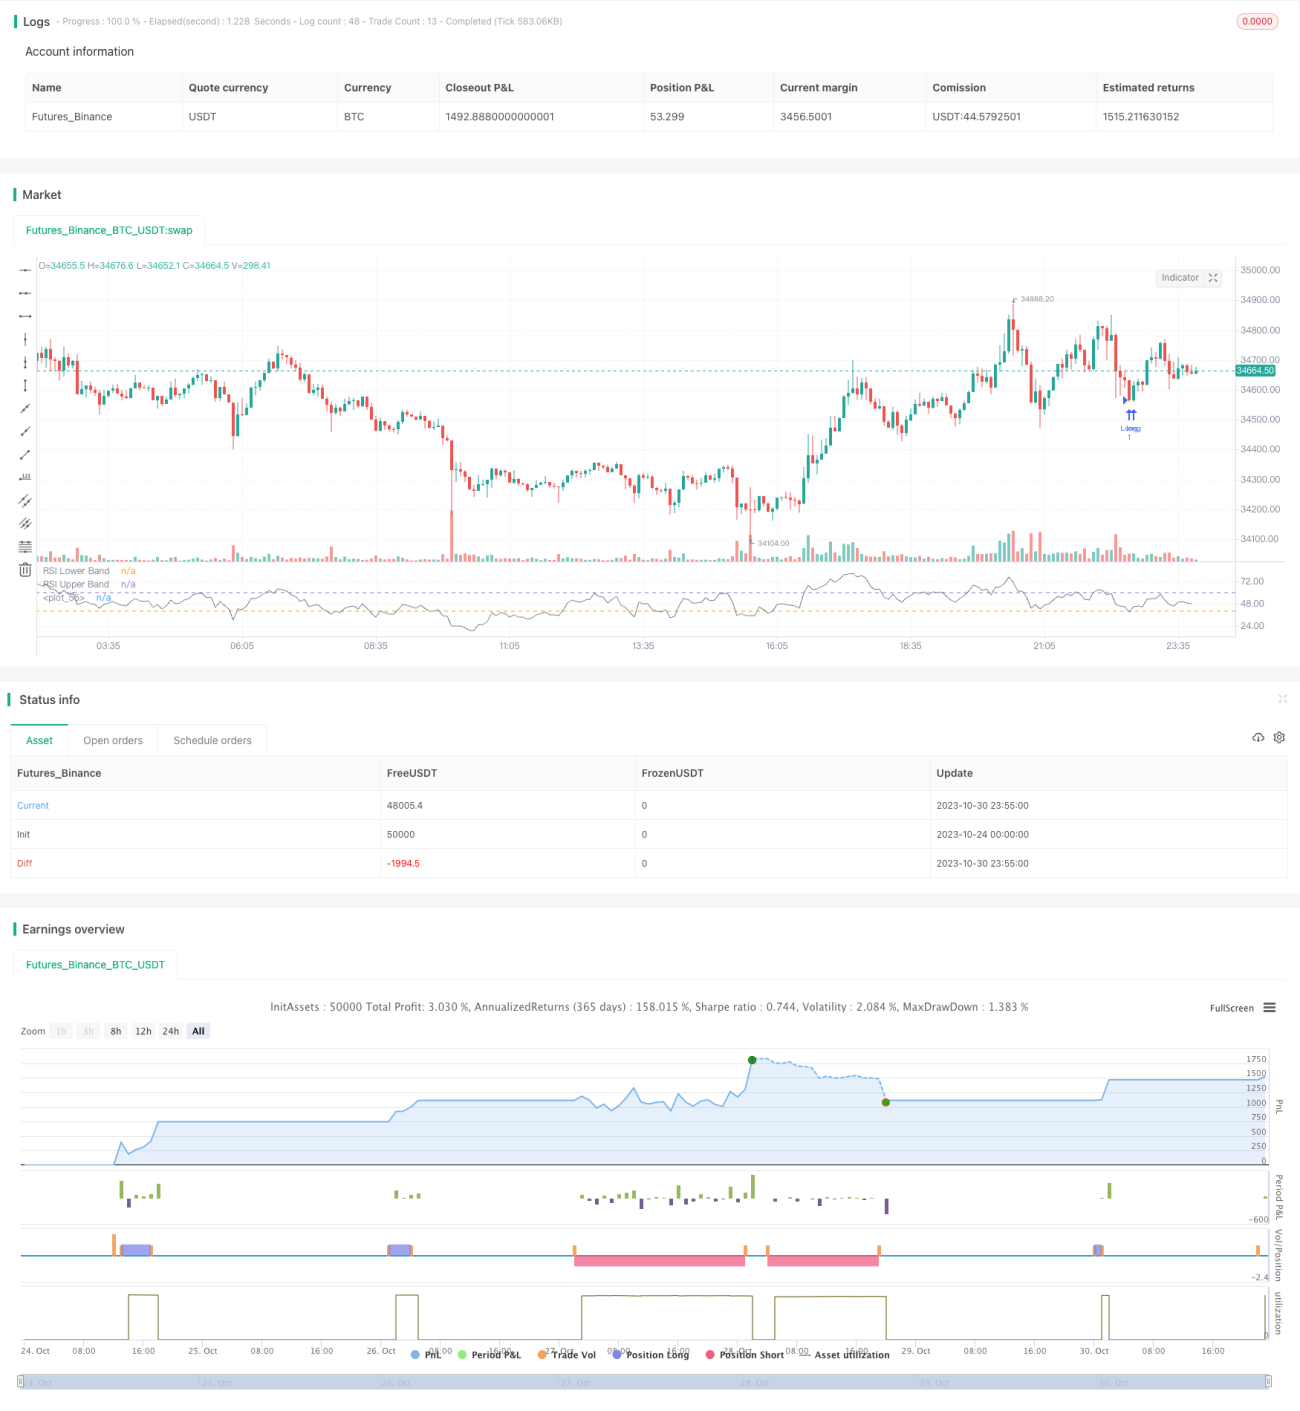
start: 2023-10-24 00:00:00
end: 2023-10-31 00:00:00
period: 5m
basePeriod: 1m
exchanges: [{"eid":"Futures_Binance","currency":"BTC_USDT"}]
*/

// This source code is subject to the terms of the Mozilla Public License 2.0 at https://mozilla.org/MPL/2.0/
// © Sarahann999
//@version=5
strategy("RSI Strategy", shorttitle="RSI", overlay= false)

//Inputs
long_entry = input(true, title='Long Entry')
short_entry = input(true, title='Short Entry')
emaSettings = input(100, 'EMA Length')
ema = ta.ema(close,emaSettings)
rsi = ta.rsi(close,14)

//Conditions
uptrend = close > ema
downtrend = close < ema
OB = rsi > 60
OS = rsi < 40
buySignal = uptrend and OS and strategy.position_size == 0
sellSignal = downtrend and OB and strategy.position_size == 0

//Calculate Take Profit Percentage
longProfitPerc = input.float(title="Long Take Profit", group='Take Profit Percentage',
     minval=0.0, step=0.1, defval=1) / 100
shortProfitPerc = input.float(title="Short Take Profit",
     minval=0.0, step=0.1, defval=1) / 100

// Figure out take profit price 1
longExitPrice  = strategy.position_avg_price * (1 + longProfitPerc)
shortExitPrice = strategy.position_avg_price * (1 - shortProfitPerc)

// Make inputs that set the stop %  1
longStopPerc = input.float(title="Long Stop Loss", group='Stop Percentage',
     minval=0.0, step=0.1, defval=1.5) / 100
shortStopPerc = input.float(title="Short Stop Loss",
     minval=0.0, step=0.1, defval=1.5) / 100

// Figure Out Stop Price
longStopPrice  = strategy.position_avg_price * (1 - longStopPerc)
shortStopPrice = strategy.position_avg_price * (1 + shortStopPerc)

// Submit entry orders
if buySignal and long_entry
    strategy.entry(id="Long", direction=strategy.long, alert_message="Enter Long")
    
if sellSignal and short_entry
    strategy.entry(id="Short", direction=strategy.short, alert_message="Enter Short")
    
//Submit exit orders based on take profit price
if (strategy.position_size > 0)
    strategy.exit(id="Long TP/SL", limit=longExitPrice, stop=longStopPrice, alert_message="Long Exit 1 at {{close}}")
if (strategy.position_size < 0)
    strategy.exit(id="Short TP/SL", limit=shortExitPrice, stop=shortStopPrice, alert_message="Short Exit 1 at {{close}}")
    
//note: for custom alert messages to read, "{{strategy.order.alert_message}}" must be placed into the alert dialogue box when the alert is set.

plot(rsi, color= color.gray)
hline(40, "RSI Lower Band")
hline(60, "RSI Upper Band")

もっと