木星と土星のモメンタム MA クロスオーバー フィルター戦略

概要
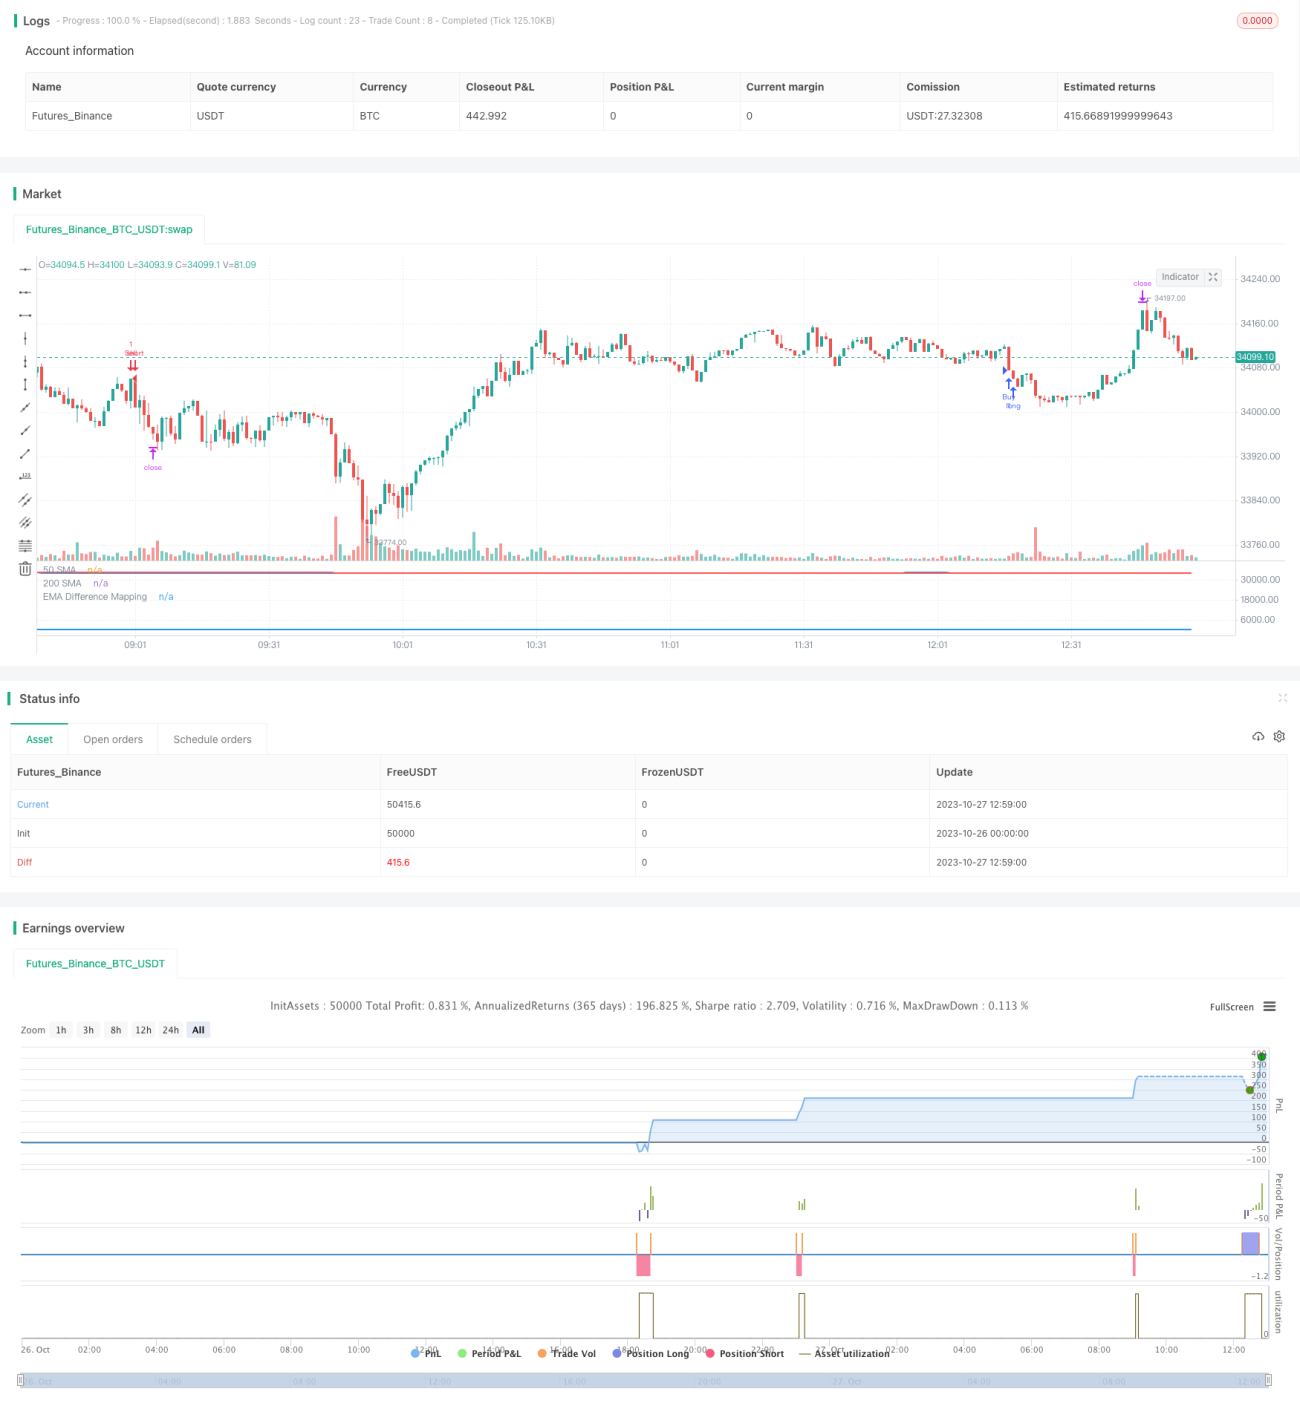
この戦略は,両移動平均の交差を取引信号として使用し,波幅指標BBとカスタム動能指標と組み合わせたフィルタリングを行います.MA交差信号の信頼性を高め,偽信号を減らすことを目的としています.
原則
-
50周期EMAと200周期SMAを用いて金叉死叉信号を形成する.
-
価格が上昇傾向にあるとき,価格が200日線以上とカスタム動能指標値が25未満であることを要求して買取シグナルを生成する.
-
価格が下方傾向にあるとき,価格が200日線以下で,カスタム動能指標値が75より大きいことを要求してセールシグナルを生成する.
-
自定義動能指標はBB中線と上下線の距離に基づいて0-100の範囲にマッピングする. 統計的距離の最大最小値を遡って,归一化処理を行う.
-
動能指標は,価格の相対波幅の位置情報を反映し,<unk>値を設定してフィルタリングし,偽交差を効果的に減らすことができます.
優位分析
-
EMAとSMAの優位性を利用して,中長線トレンドを捉える.
-
動能指数を増やしてフィルタリングを行うことで,信頼性が高く,偽信号が少なくなる.
-
BB上下軌道の距離は波動力を反映し,遡及統計と組み合わせて標準化処理を行い,パラメータ依存を回避する.
-
EMAとSMAの周期および動能指標の値下げをカスタマイズして,異なる市場環境に対応します.
-
戦略は明快でわかりやすい,パラメータ調整の余地があり,実用性が強い.
リスク分析
-
EMAとSMA自身は遅滞しており,ショートラインの機会を逃しているかもしれない.
-
双線交差は本質的にトレンド追跡戦略であり,震<unk>の状況には適さない.
-
動能指標の<unk>値は,適切なパラメータを決定するために反復テストを必要とし,曲線最適化のリスクがある.
-
大周期平均線戦略で,収益は比較的安定しているが,絶対的な収益は限られている可能性がある.
-
平均周期を適当に短縮したり,他の指標を追加したりすることで,戦略の適応性を向上させることができます.
最適化の方向
-
異なる均線組み合わせをテストし,最適なパラメータを探します.
-
MACD,KDなどの補助判断を追加する.
-
運動エネルギー指標のパラメータを最適化します.例えば,回帰周期,マッピング範囲などです.
-
リスク管理のためのストップダストメカニズムを追加する.
-
異なる品種のパラメータが一致しない場合,機械学習の特性を抽出することを検討できます.
-
余計な交差信号を避けるために,エネルギー指数を加える.
要約する
この戦略は,集積周期的なトレンド追跡とカスタム動能指標の二重フィルタリングの優位性がある.信頼性が高く,実戦価値は高い.パラメータ最適化と補助技術指標の強化により,より優れたパフォーマンスを得ることが期待されています.この戦略は,他のトレンド追跡戦略に借用できる新しいアイデアであり,量化取引戦略庫に価値ある追加です.
- 1