ダブルMAトレンドブレイクアウト戦略
概要
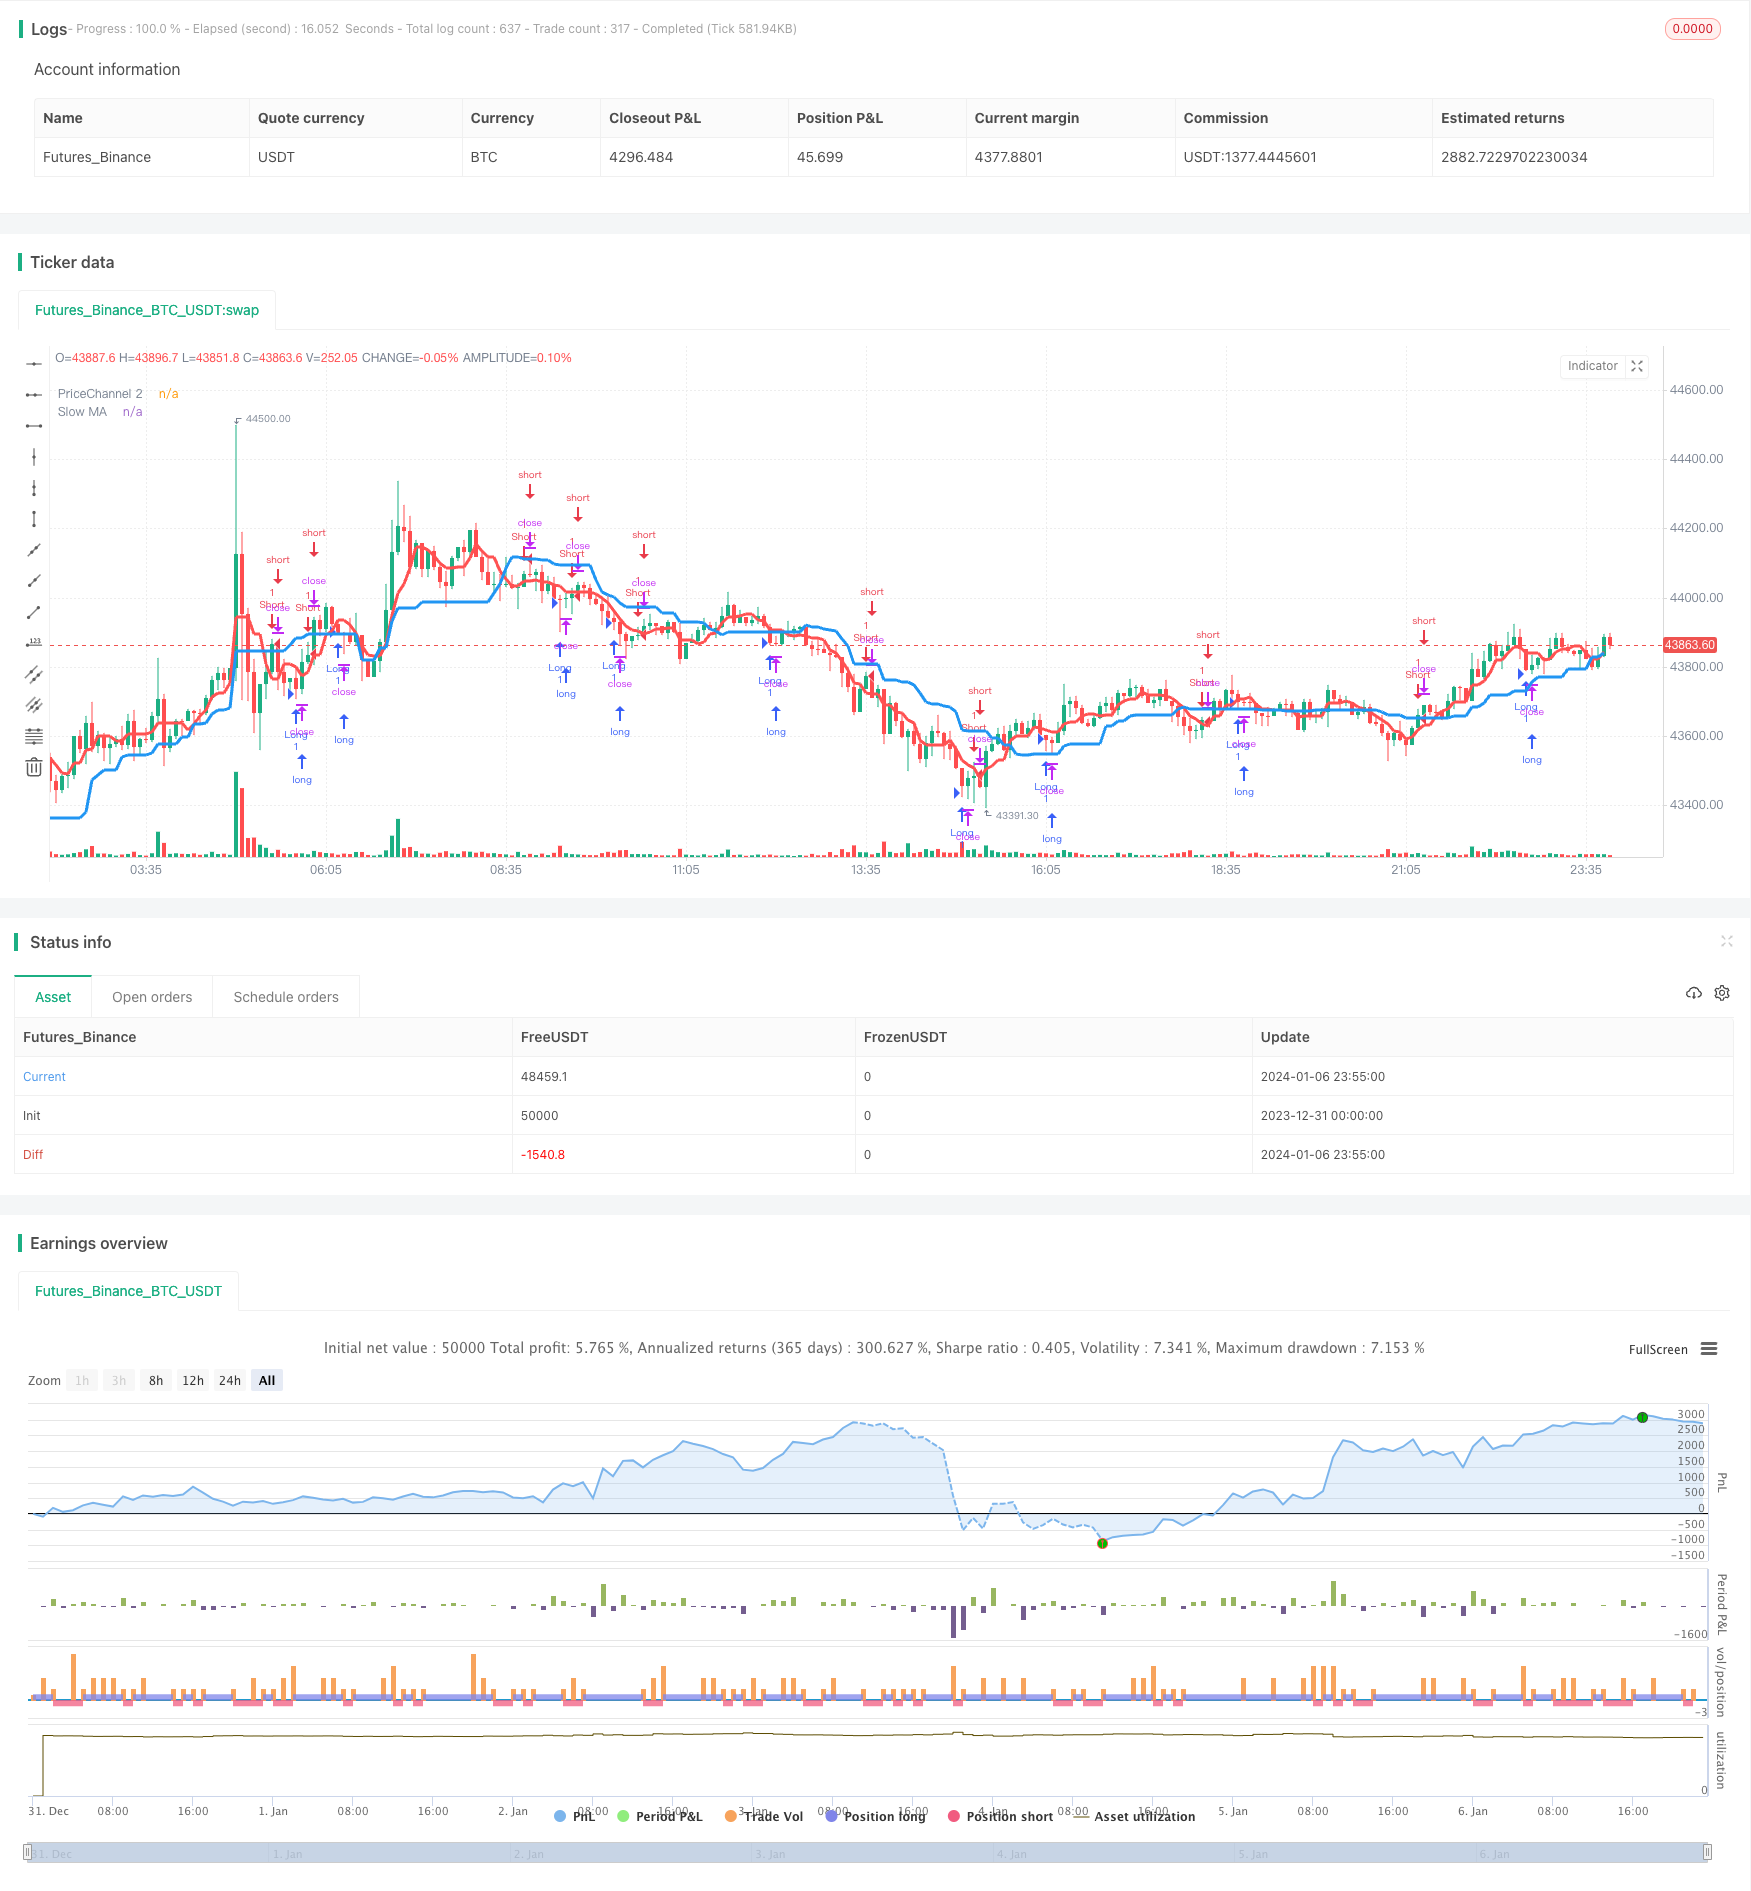
双MA順位突破戦略は,2つの異なる周期の移動平均を使ってトレンド判断と入場を行う定量取引戦略である.戦略は,主にゆっくりとしたMAによって全体的なトレンドの方向を判断し,急速なMAを使用して入場をフィルターし,大レベルのトレンドの方向が一致するときに,K線を逆転して入場することを選択し,より高い勝率と利益率を追求する.
戦略原則
この戦略は以下の部分から構成されています.
トレンド判断:21周期のMAを計算して,ゆっくりとしたMAと定義し,その位置は比較的平坦で,全体的なトレンドの方向を判断するために使用できます.価格が上昇するときにMA値に近づくことは上昇傾向であり,価格が低下するときにMA値に近づくことは下降傾向です.
フィルタリング:5周期のMAを計算し,急速MAとして定義する. 価格が遅いMAを突破すると同時に急速MAを突破すると,取引信号が生成されるのみである. この設計は,偽突破の可能性をさらにフィルタリングする.
K線フィルター:戦略は,周期K線が陰線である場合にのみ多出するか,周期K線が陽線である場合にのみ空出する.これは,反転K線を利用して入場するより高い成功率を考慮する.同時に,高速RSI指標と組み合わせて,過度に超買または超売り領域に入場するのを避ける.
倉庫のフィルター:暗号通貨市場では,戦略はさらに波動の突破を3倍する加減条件を追加し,大規模下落の過程で超下落の機会をフィルターします.
デザインの障害は戦略は,移動のストップをサポートします. ポジションを開設すると,設定されたストップパーセンテージに基づいてストップポジションをリアルタイムで更新します.
優位分析
この戦略の利点は以下の通りです.
- デザインはシンプルで実用的で,理解しやすい.
- 動的MA組み合わせのフィルターを使用して,トレンドを確実に判断する.
- 取引の成功率を向上させるため,K線を反転させる.
- 全体の方法論は安定しており,あらゆるレベルの取引に適しています.
- 移動式・制御可能なリスクのサポート
- 仮想通貨市場の特性を考慮して,超低価格の加仓機会を加え,余分な利益を得ることができます.
リスク分析
この戦略にはいくつかのリスクがあります.
- 双MA区間の振動は,小規模な損失を繰り返し引き起こします.
- 逆転K線入場は,特定のレベルの時に勝率が低い場合がある.
- 暗号通貨の市場が波動し,ストップダスの発動の可能性が高い.
- 株価が上昇し,上昇する確率は低いが,利回りは変動する.
これらのリスクに対して,以下のような方法で最適化できます.
- 市民の参入条件を高め,無効性ショックを回避する.
- Kラインの周期を調整したり,他の指標のフィルターを追加したり
- 中軸周辺のストップを追跡するストップアルゴリズムを最適化
- 超低利回り戦略の実効性について評価する.
最適化の方向
この戦略は以下の点で最適化できます.
パラメータ最適化: より体系的な反省により,速慢MAの周期パラメータの組み合わせを最適化し,全体的な利益リスク比率を向上させる.
パターン認識: KDJ,MACDなどの他の指標を追加し,より信頼できる反転信号を識別する.
ストップ・ロスト・最適化: 浮動ストップ,ストップ追跡などのアルゴリズムを開発し,ストップがトリガーされる確率を下げる.
機械学習機械学習により,より多くの歴史データを収集し,タグ付けし,取引ルールを自動的に生成します.
定量化して市場状況に応じてポジション管理戦略を自動的に調整する.
要約する
双MA順位突破戦略は,全体として比較的シンプルで実用的なトレンド追跡戦略である.複雑な機械学習アルゴリズムと比較して,この戦略はより簡単に解釈・把握し,信頼性が高くなる.パラメータ最適化,機能拡張および機械学習の導入により,この戦略は大きな改善の可能性があり,量化取引の良い出発点である.
/*backtest
start: 2023-12-31 00:00:00
end: 2024-01-07 00:00:00
period: 5m
basePeriod: 1m
exchanges: [{"eid":"Futures_Binance","currency":"BTC_USDT"}]
*/

//@version=2
strategy(title = "Noro's Trend MAs Strategy v2.0 +CB", shorttitle = "Trend MAs str 2.0", overlay=true, default_qty_type = strategy.percent_of_equity, default_qty_value=100.0, pyramiding=0)

//Settings
needlong = input(true, "long")
needshort = input(true, "short")
needstops = input(false, "stops")
stoppercent = input(5, defval = 5, minval = 1, maxval = 50, title = "Stop, %")
useohlc4 = input(false, defval = false, title = "Use OHLC4")
usefastsma = input(true, "Use fast MA Filter")
fastlen = input(5, defval = 5, minval = 1, maxval = 50, title = "fast MA Period")
slowlen = input(21, defval = 20, minval = 2, maxval = 200, title = "slow MA Period")
bars = input(2, defval = 2, minval = 0, maxval = 3, title = "Bars Q")
needbg = input(false, defval = false, title = "Need trend Background?")
needarr = input(false, defval = false, title = "Need entry arrows?")
needex = input(true, defval = true, title = "Need extreme? (crypto/fiat only!!!)")

src = useohlc4 == true ? ohlc4 : close

//PriceChannel 1
lasthigh = highest(src, slowlen)
lastlow = lowest(src, slowlen)
center = (lasthigh + lastlow) / 2

//PriceChannel 2
lasthigh2 = highest(src, fastlen)
lastlow2 = lowest(src, fastlen)
center2 = (lasthigh2 + lastlow2) / 2

//Trend
trend = low > center and low[1] > center[1] ? 1 : high < center and high[1] < center[1] ? -1 : trend[1]

//Bars
bar = close > open ? 1 : close < open ? -1 : 0
redbars = bars == 0 ? 1 : bars == 1 and bar == -1 ? 1 : bars == 2 and bar == -1 and bar[1] == -1 ? 1 : bars == 3 and bar == -1 and bar[1] == -1 and bar[2] == -1 ? 1 : 0
greenbars = bars == 0 ? 1 : bars == 1 and bar == 1 ? 1 : bars == 2 and bar == 1 and bar[1] == 1 ? 1 : bars == 3 and bar == 1 and bar[1] == 1 and bar[2] == 1 ? 1 : 0

//Fast RSI
fastup = rma(max(change(close), 0), 2)
fastdown = rma(-min(change(close), 0), 2)
fastrsi = fastdown == 0 ? 100 : fastup == 0 ? 0 : 100 - (100 / (1 + fastup / fastdown))

//CryptoBottom
mac = sma(close, 10)
len = abs(close - mac)
sma = sma(len, 100)
max = max(open, close)
min = min(open, close)
up3 = close < open and len > sma * 3 and min < min[1] and fastrsi < 10 ? 1 : 0

//Signals
up = trend == 1 and (low < center2 or usefastsma == false) and (redbars == 1) ? 1 : 0
dn = trend == -1 and (high > center2 or usefastsma == false) and (greenbars == 1) ? 1 : 0

up2 = high < center and high < center2 and bar == -1 ? 1 : 0
dn2 = low > center and low > center2 and bar == 1 ? 0 : 0

//Lines
plot(center, color = blue, linewidth = 3, transp = 0, title = "Slow MA")
plot(center2, color = red, linewidth = 3, transp = 0, title = "PriceChannel 2")

//Arrows
plotarrow(up == 1 and needarr == true ? 1 : 0, colorup = black, colordown = black, transp = 0)
plotarrow(dn == 1 and needarr == true ? -1 : 0, colorup = black, colordown = black, transp = 0)

//Background
col = needbg == false ? na : trend == 1 ? lime : red
bgcolor(col, transp = 90)

//Alerts
alertcondition(up == 1, title='buy', message='Uptrend')
alertcondition(dn == 1, title='sell', message='Downtrend')

//Trading
stoplong = up == 1 and needstops == true ? close - (close / 100 * stoppercent) : stoplong[1]
stopshort = dn == 1 and needstops == true ? close + (close / 100 * stoppercent) : stopshort[1]

longCondition = up == 1 or (up2 == 1 and needex == true) or up3 == 1
if (longCondition)
    strategy.entry("Long", strategy.long, needlong == false ? 0 : na)
    strategy.exit("Stop Long", "Long", stop = stoplong)

shortCondition = dn == 1
if (shortCondition)
    strategy.entry("Short", strategy.short, needshort == false ? 0 : na)
    strategy.exit("Stop Short", "Short", stop = stopshort)