RSIインジケーターに基づく優れた取引戦略
概要
この戦略は,相対的に強い指数 (RSI) をベースに,ニフティ指数取引のための量的な投資戦略を設計しています. この戦略は,RSI指標を使用して,超買い超売の機会を特定し,低価格で高価格で高価格で高価格で高価格で高価格に低価格で高価格に低価格で高価格に低価格に低価格に低価格に低価格に低価格に低価格に低価格に低価格に低価格に低価格に低価格に低価格に低価格に低価格に低価格に低価格に低価格に低価格に低価格に低価格に低価格に低価格に低価格に低価格に低価格に低価格に低価格に低価格に低価格に低価格に低価格に低価格に低価格に低価格に低価格に低価格に低価格に低価格に低価格に低価格に低価格に低価格に低価格に低価格に低価格に低価格に低価格に低価格に低価格に低価格に低価格に低価格に低価格に低価格に低価格に低価格に低価格に低価格に
戦略原則
この戦略は,2期RSIを取引シグナルとして設定します. RSIが20を超えると,多めにします. RSIが70を超えると,平仓します. これにより,指数の短期的な調整の機会を捉えることができます.
具体的原理は:RSIが20を下回ると,超売り状態であり,資産が過小評価されていることを示し,反発が近づいていることを示します.RSIが20を超えると,多額で;RSIが70を超えると,超買い状態であり,資産が過大評価されていることを示し,即日調整が進んでいることを示します.RSIが70を下回ると,平仓します.
優位分析
これは,短期的な超買超売の機会を特定するために指標を用いた定量化戦略である. 複雑な機械学習と統計学的値策の対比では,この戦略の優位性は主に次のとおりである.
- 原則はシンプルで明快で 分かりやすく検証できます
- 指標のパラメータが少なく,最適化や調整が容易である
- 横断取引の理念に合致する,短期間の余剰利益を追求する
- 取引の時間帯をカスタマイズし,異なる期待に応える
リスク分析
この戦略には以下のリスクがあります.
- 長期的トレンドを把握できず,大局を見落としてしまう
- パラメータ最適化に過度に依存し,過度に適合するリスクがある
- 損失を制御できない無止境の仕組み
- 取引の頻度,保有時間の影響,取引費の増加
上記のリスクを制御するために,以下の方法で最適化できます.
- トレンドなどの指標を組み合わせて,長期の動向を識別する
- ウォーク・フォワード・アナリシスによる過適合防止
- ストップポイントを設定し,タイムストップします.
- 取引パラメータを適切に調整し,取引頻度を制御する
最適化の方向
この戦略は以下の点で最適化できます.
- RSIパラメータを最適化して,最適なパラメータの組み合わせを探します.
- 損失防止装置を増やし,最大撤退を抑制する.
- 移動平均線などの指標を組み合わせて長期のトレンドを判断する
- ポジション管理モジュールを追加し,ポジション配分を最適化
- コピーライトの量化機能を追加し,パラメータを自動的に調整します.
要約する
本策略は,RSI指標をベースに短期取引戦略を設計し,RSI指標の超買い超売り信号を利用して低買い高売りを実現し,超利益を追求する.この策略の原理はシンプルで,実行しやすいが,一定の取引頻度があり,長期トレンドを識別できないなどの問題がある.将来,RSIパラメータを最適化,ストップメカニズムを増やし,トレンド判断を組み合わせるなどで改善することができる.この策略は,より安定し,信頼性がある.
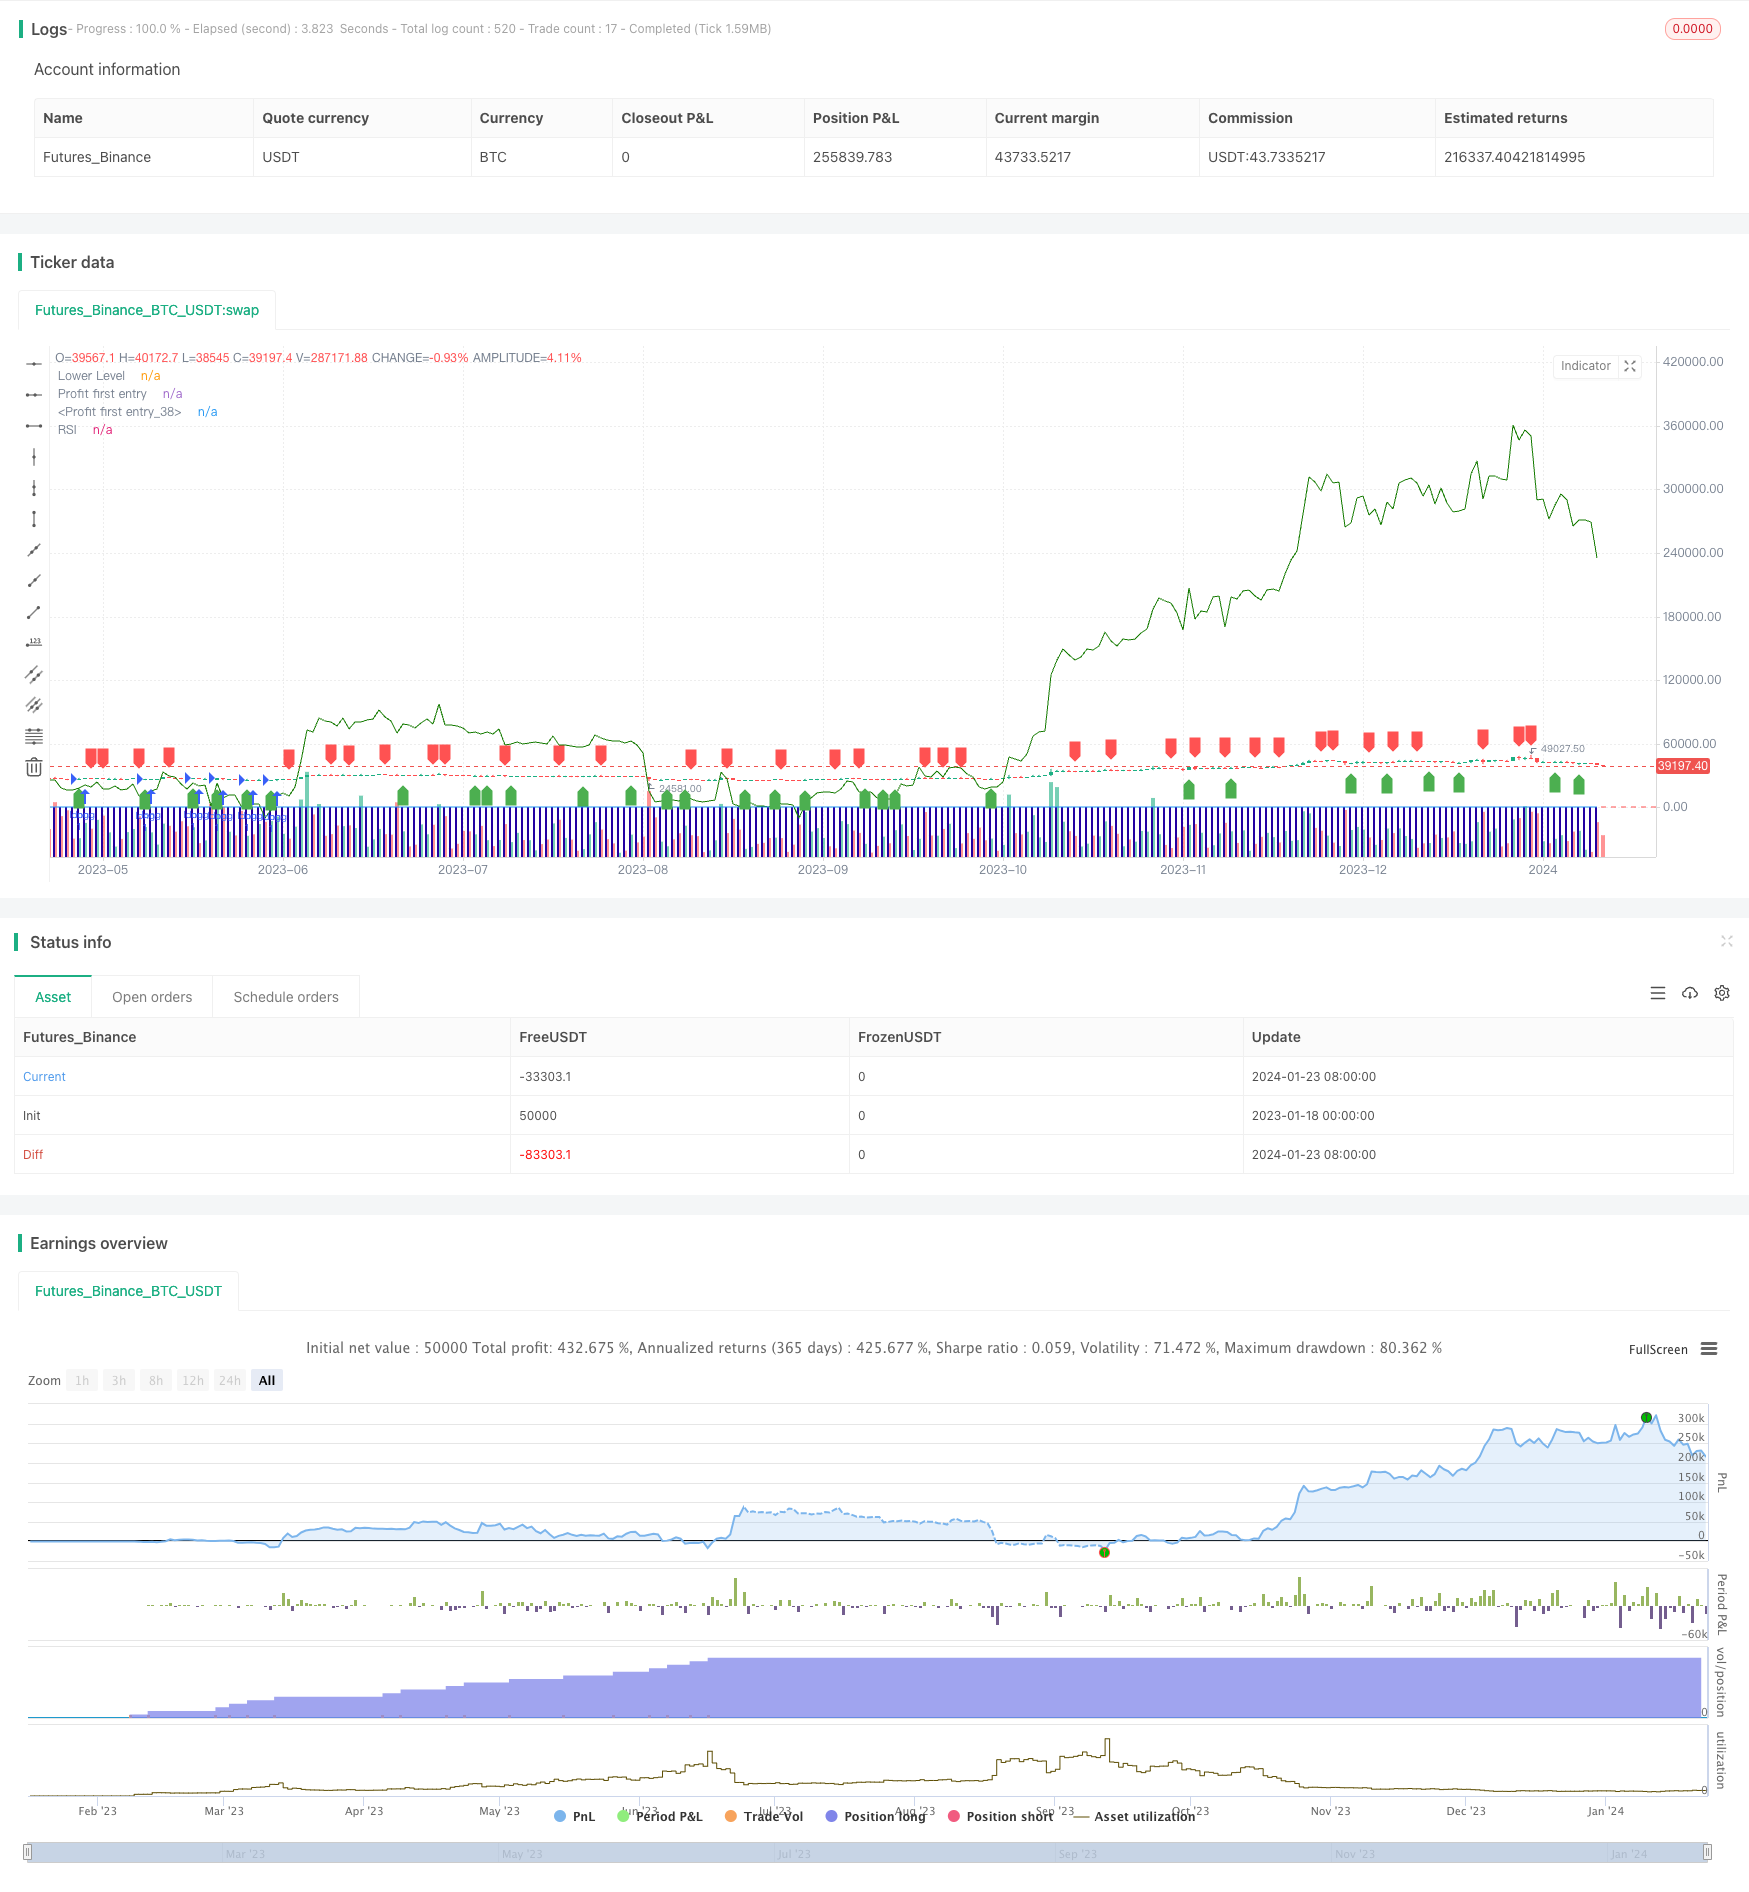
/*backtest
start: 2023-01-18 00:00:00
end: 2024-01-24 00:00:00
period: 1d
basePeriod: 1h
exchanges: [{"eid":"Futures_Binance","currency":"BTC_USDT"}]
*/

//@version=4
strategy("RSI Strategy", overlay=true,pyramiding = 1000)
rsi_period = 2
rsi_lower = 20
rsi_upper = 70

rsi_value = rsi(close, rsi_period)
buy_signal = crossover(rsi_value, rsi_lower)
sell_signal = crossunder(rsi_value, rsi_upper)
current_date1 =  input(defval=timestamp("01 Nov 2009 00:00 +0000"), title="stary Time", group="Time Settings")

current_date =  input(defval=timestamp("01 Nov 2023 00:00 +0000"), title="End Time", group="Time Settings")
investment_amount = 100000.0
start_time = input(defval=timestamp("01 Dec 2018 00:00 +0000"), title="Start Time", group="Time Settings")
end_time = input(defval=timestamp("30 Nov 2023 00:00 +0000"), title="End Time", group="Time Settings")

in_time = time >= start_time and time <= end_time
// Variable to track accumulation.
var accumulation = 0.0
out_time = time >= end_time

if (buy_signal )
    strategy.entry("long",strategy.long,qty= 1)
    accumulation += 1
if (out_time)
    strategy.close(id="long")

plotshape(series=buy_signal, title="Buy Signal", location=location.belowbar, color=color.green, style=shape.labelup)
plotshape(series=sell_signal, title="Sell Signal", location=location.abovebar, color=color.red, style=shape.labeldown)

plot(rsi_value, title="RSI", color=color.blue)
hline(rsi_lower, title="Lower Level", color=color.red)


plot(strategy.opentrades, style=plot.style_columns,
     color=#2300a1, title="Profit first entry")
plot(strategy.openprofit, style=plot.style_line,
     color=#147a00, title="Profit first entry")
// plot(strategy.position_avg_price, style=plot.style_columns,
//      color=#ca0303, title="Profit first entry")
// log.info(strategy.position_size * strategy.position_avg_price)