ロング戦略を実行するために移動平均と組み合わせたモメンタム指標
作成日:
2024-02-29 11:57:18
最終変更日:
2024-02-29 11:57:18
コピー:
7
クリック数:
636
1
フォロー
1750
フォロワー
概要
この戦略は,MACD動態指標とDMIトレンド指標を組み合わせて,適格性のあるときに複数の操作を行います.その出口は,固定ストップとカスタマイズされた波動的なトレーリングストップを設定して,収益をロックします.
原則
この戦略のエントリーは,MACDとDMIの指標に依存しています.
- MACDが正のとき (MACD線がシグナル線より高い) は,市場の振動力が強化されたことを示します.
- DMIのDI+がDI-よりも高い場合,市場が上昇傾向にあることを示します.
上記の2つの条件が同時に満たされると,多額開設する.
ポジション・エグジットには2つの基準があります.
- 固定ストップ: close 価格上昇がセットストップに達した割合
- 変動追跡ストップ:ATRと最近最高価格を使用して動的に調整されたストップ位置を計算します. これは,市場の変動に応じて trailing stop loss を行うことができます.
利点
- MACDとDMIの組み合わせは,市場のトレンド方向を比較的に信頼して判断し,誤った操作を減らすことができます.
- 固定ストップと波動ストップを組み合わせたストップ条件で,利潤を柔軟にロックできます.
リスク
- MACDとDMIは偽信号を発信し,不必要な損失を招く可能性があります.
- 固定ストップは利益の最大化を妨げます
- 波動性停止のトレイル 速度が不適切な調整,過度に過激な,または保守的な可能性がある
最適化の方向
- KDJ指標を活用して過買過売を判断するなど,他の指標の入場シグナルをフィルタリングすることを検討できます.
- より良いストップ・ストップ・損失の効果を得るために,異なるパラメータをテストすることができます
- 特定の取引品種に応じて移動平均などのパラメータを調整し,システムを最適化します.
要約する
この戦略は,市場動向と条件を判断する複数の指標を統合し,有利な可能性のある状況で介入する.停止条件も最適化して設計され,一定の利益を保証しながら,収益のロック化の柔軟性を考慮している.パラメータ調整とさらなるリスク管理により,この戦略は,安定した出力の定量取引システムになることができる.
ストラテジーソースコード
/*backtest
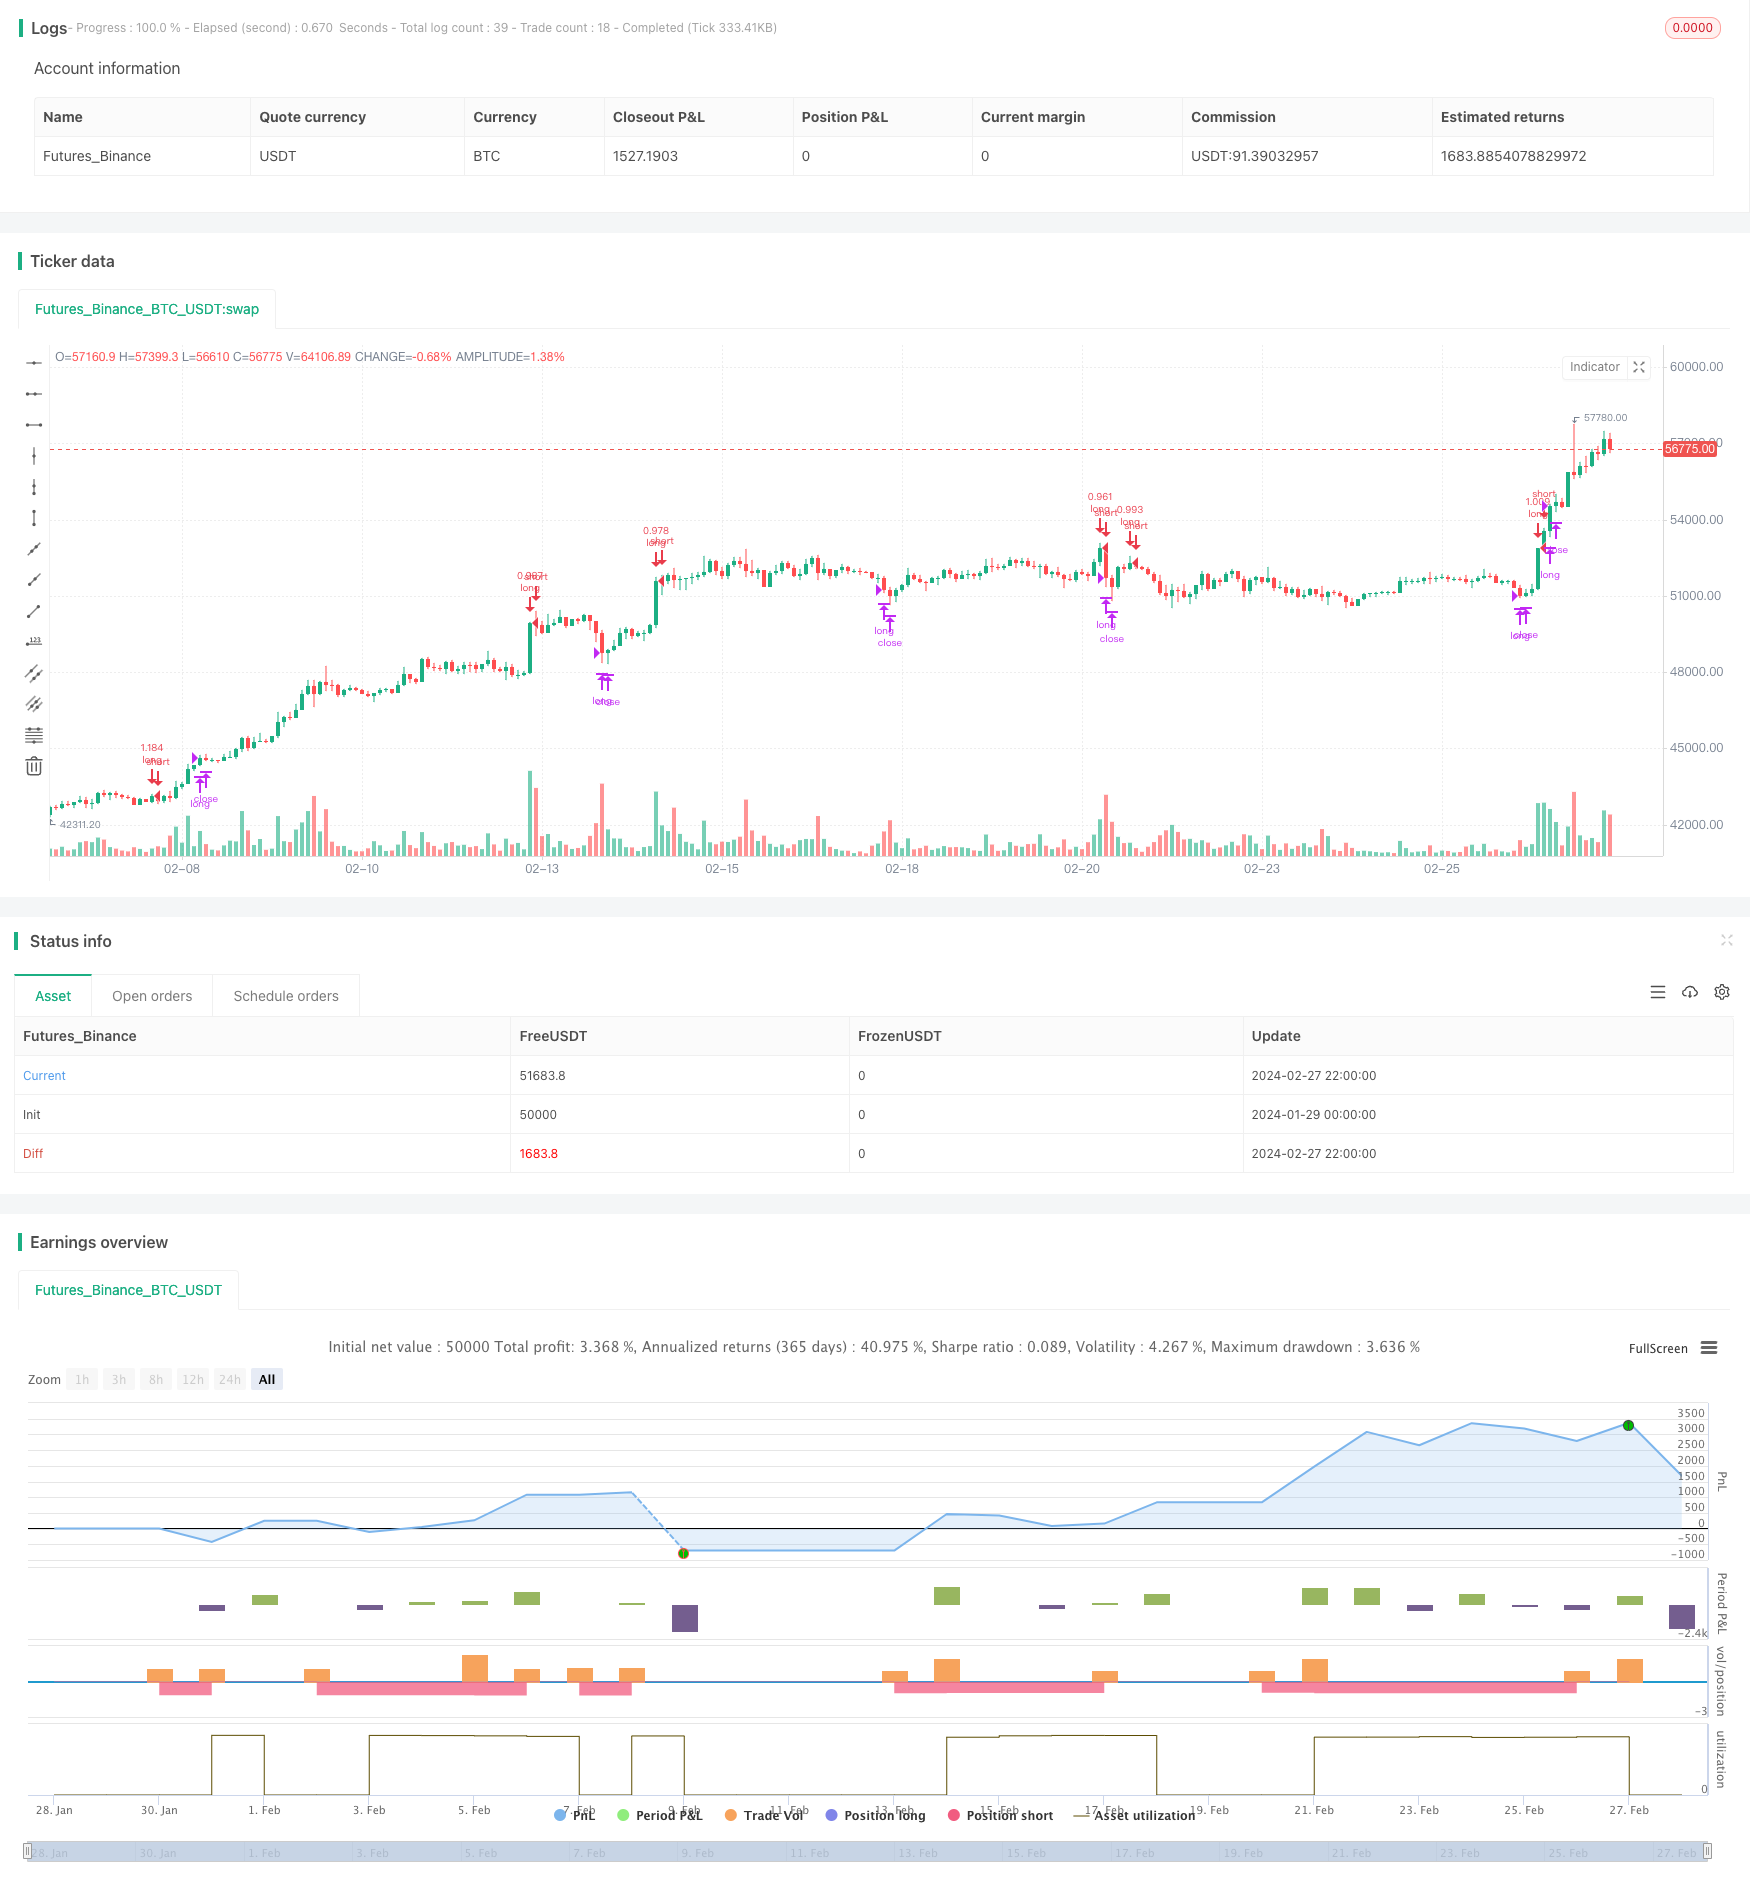
start: 2024-01-29 00:00:00
end: 2024-02-28 00:00:00
period: 2h
basePeriod: 15m
exchanges: [{"eid":"Futures_Binance","currency":"BTC_USDT"}]
*/
// This source code is subject to the terms of the Mozilla Public License 2.0 at https://mozilla.org/MPL/2.0/
//@version=4
strategy(shorttitle='(MACD + DMI Scalping with Volatility Stop',title='MACD + DMI Scalping with Volatility Stop by (Coinrule)', overlay=true, initial_capital = 100, process_orders_on_close=true, default_qty_type = strategy.percent_of_equity, default_qty_value = 100, commission_type=strategy.commission.percent, commission_value=0.1)
// Works better on 3h, 1h, 2h, 4h
//Backtest dates
fromMonth = input(defval = 1, title = "From Month", type = input.integer, minval = 1, maxval = 12)
fromDay = input(defval = 1, title = "From Day", type = input.integer, minval = 1, maxval = 31)
fromYear = input(defval = 2021, title = "From Year", type = input.integer, minval = 1970)
thruMonth = input(defval = 1, title = "Thru Month", type = input.integer, minval = 1, maxval = 12)
thruDay = input(defval = 1, title = "Thru Day", type = input.integer, minval = 1, maxval = 31)
thruYear = input(defval = 2112, title = "Thru Year", type = input.integer, minval = 1970)
showDate = input(defval = true, title = "Show Date Range", type = input.bool)
start = timestamp(fromYear, fromMonth, fromDay, 00, 00) // backtest start window
finish = timestamp(thruYear, thruMonth, thruDay, 23, 59) // backtest finish window
window() => true
// DMI and MACD inputs and calculations
[pos_dm, neg_dm, avg_dm] = dmi(14, 14)
[macd, macd_signal, macd_histogram] = macd(close, 12, 26, 9)
Take_profit= ((input (3))/100)
longTakeProfit = strategy.position_avg_price * (1 + Take_profit)
length = input(20, "Length", minval = 2)
src = input(close, "Source")
factor = input(2.0, "vStop Multiplier", minval = 0.25, step = 0.25)
volStop(src, atrlen, atrfactor) =>
var max = src
var min = src
var uptrend = true
var stop = 0.0
atrM = nz(atr(atrlen) * atrfactor, tr)
max := max(max, src)
min := min(min, src)
stop := nz(uptrend ? max(stop, max - atrM) : min(stop, min + atrM), src)
uptrend := src - stop >= 0.0
if uptrend != nz(uptrend[1], true)
max := src
min := src
stop := uptrend ? max - atrM : min + atrM
[stop, uptrend]
[vStop, uptrend] = volStop(src, length, factor)
closeLong = close > longTakeProfit or crossunder(close, vStop)
//Entry
strategy.entry(id="long", long = true, when = crossover(macd, macd_signal) and pos_dm > neg_dm and window())
//Exit
strategy.close("long", when = closeLong and window())