스톡 슈퍼트르드 ATR 200ma
저자:차오장, 날짜: 2022-05-10 10:53:25태그:EMA
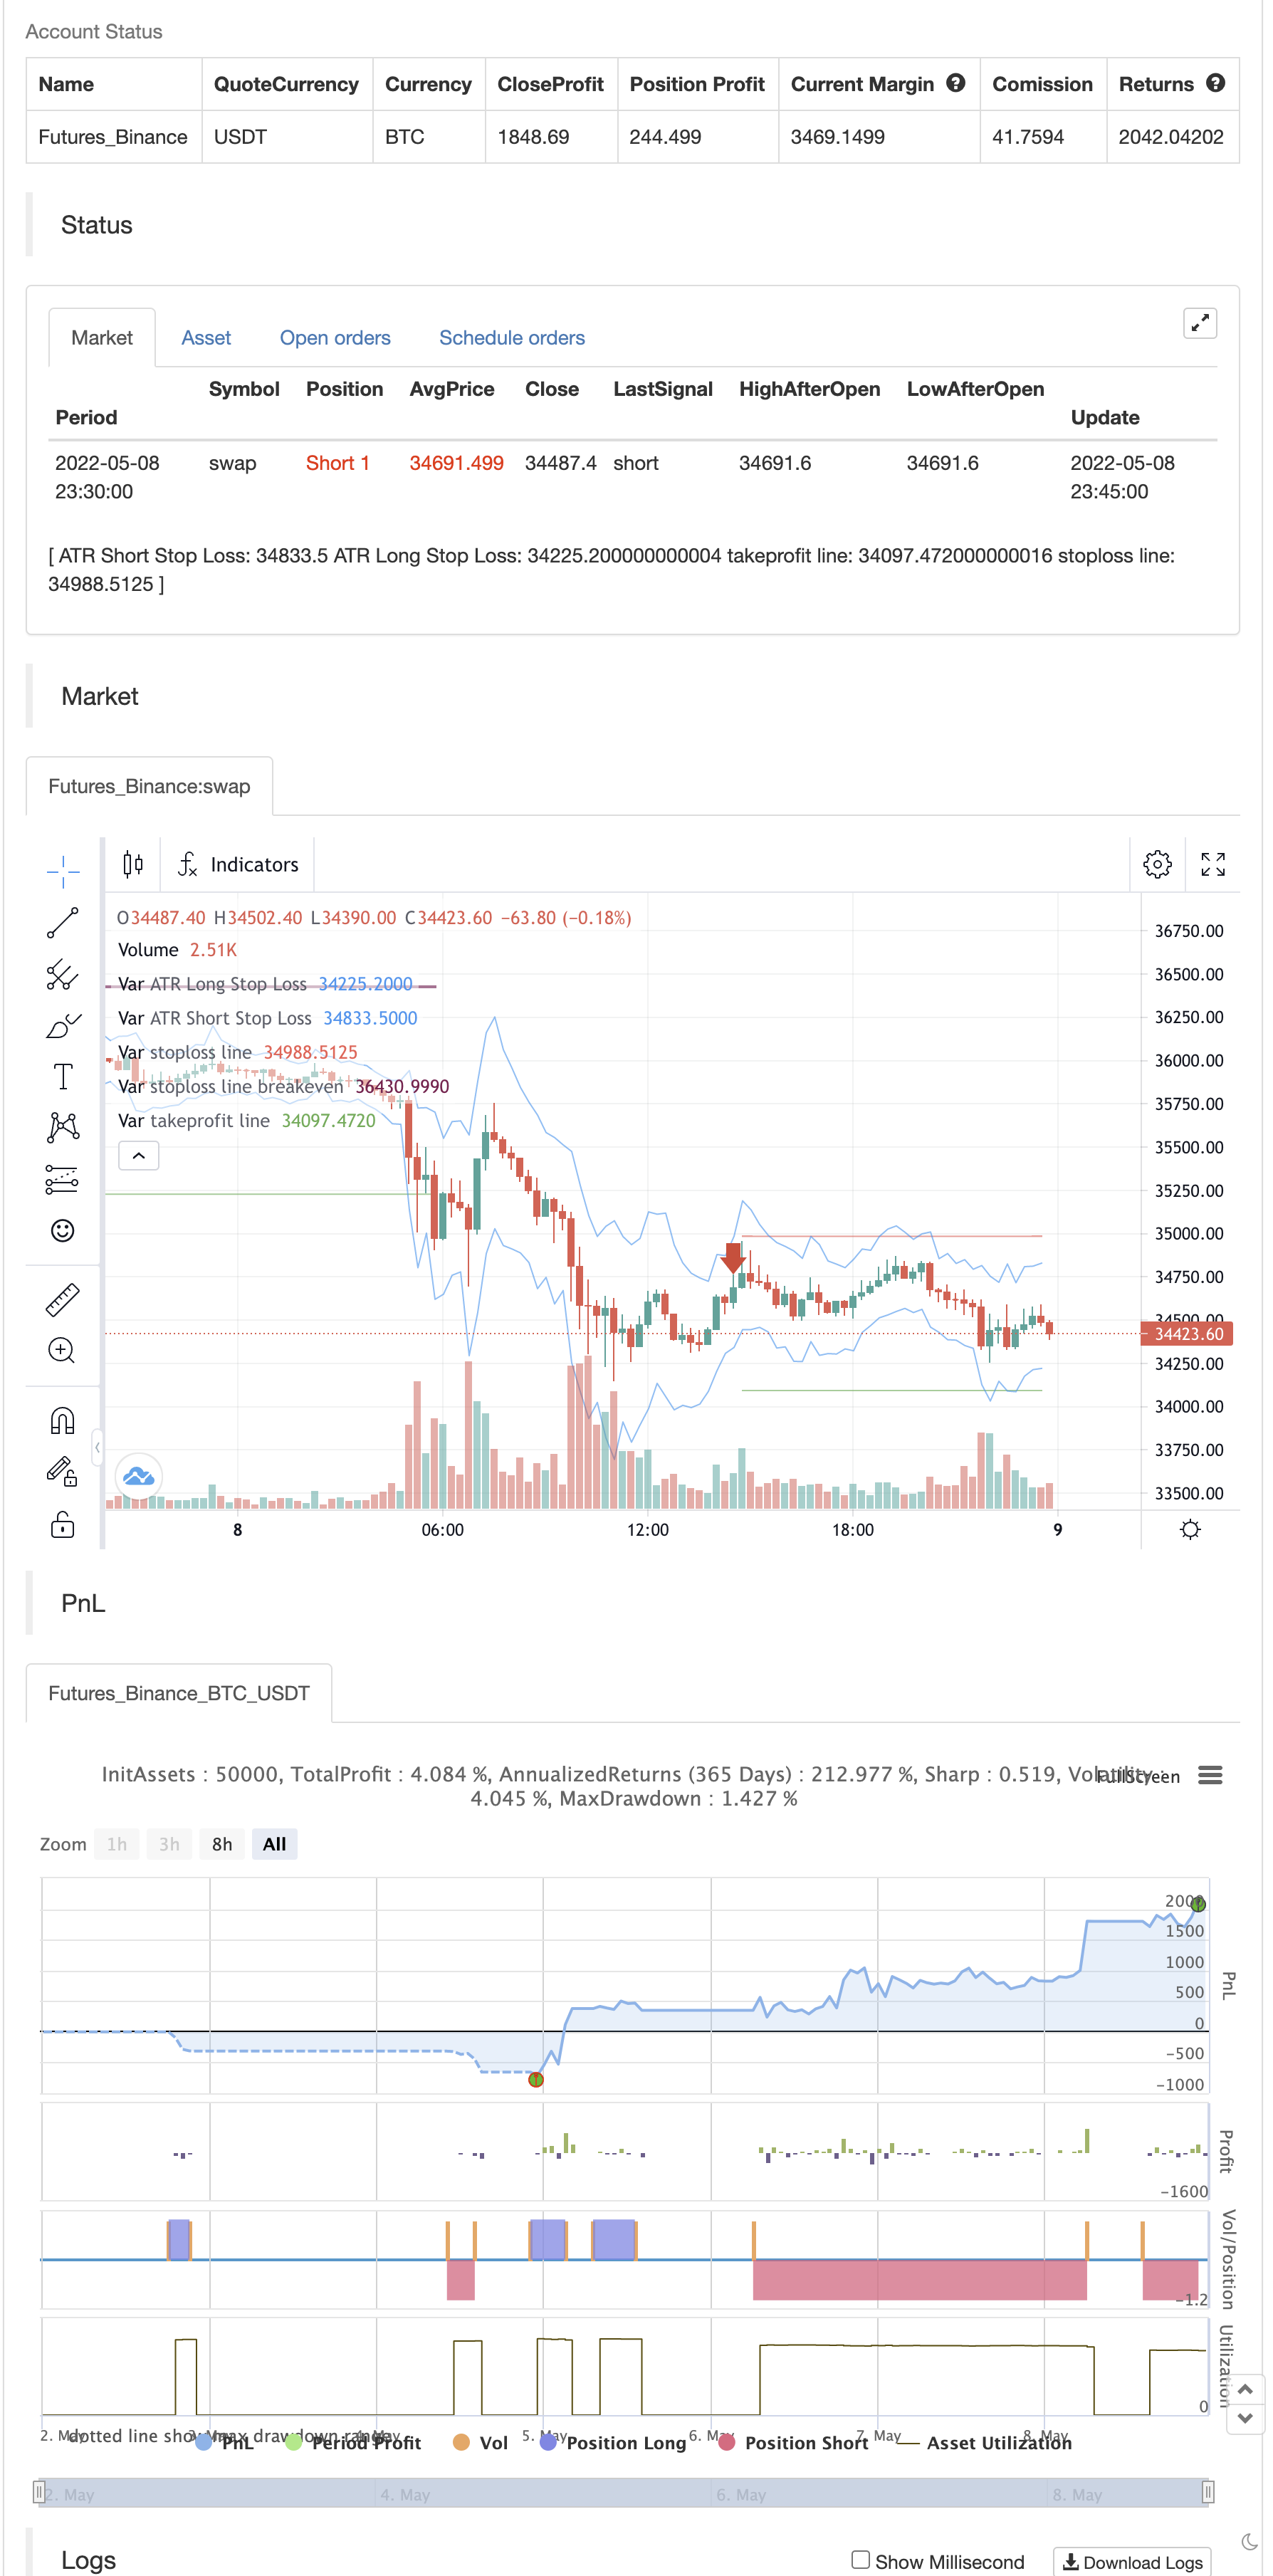
이 전략은 슈퍼트렌드, 200 EMA, 스토카스틱 및 ATR 스톱 로스 지표를 결합합니다. 구매 조건에서는 스토카스틱이 20 레벨 이하, 가격은 200 Ema 이상, 슈퍼트렌드는 녹색이어야합니다. 판매 조건에서는 반대로해야합니다. 스토카스틱은 80 레벨 이상, 가격은 200 Ema 이하, 슈퍼트렌드는 빨간색이 있어야합니다.
백테스트
// This source code is subject to the terms of the Mozilla Public License 2.0 at https://mozilla.org/MPL/2.0/
// © araamas

//@version=5
strategy("stoch supertrd atr 200ma", overlay=true, shorttitle="STOCH SUPTR ATR MA", process_orders_on_close=true, max_bars_back=5000)

ema_condition = input.bool(defval=true, title="ema needed?", tooltip="You can choose whether to include the Ema in the buy and sell conditions")
atrPeriod = input(10, "ATR Length")
factor = input.float(3.0, "Factor", step = 0.01)

[supertrend, direction] = ta.supertrend(factor, atrPeriod)

// bodyMiddle = plot((open + close) / 2, display=display.none)
// upTrend = plot(direction < 0 ? supertrend : na, "Up Trend", color = color.green, style=plot.style_linebr)
// downTrend = plot(direction < 0? na : supertrend, "Down Trend", color = color.red, style=plot.style_linebr)

period = input.int(defval=200, title="ema period")
ema = ta.ema(close, period)
// plot(ema, title="200 ema", color=color.yellow)

b = input.int(defval=14, title="length k%")
d = input.int(defval=3, title="smoothing k%")
s = input.int(defval=3, title="smoothing d%")
smooth_k = ta.sma(ta.stoch(close, high, low, b), d)
smooth_d = ta.sma(smooth_k, s)

////////////////////////////////////////////////////////////////////////////////
length = input.int(title="Length", defval=12, minval=1)
smoothing = input.string(title="Smoothing", defval="SMA", options=["RMA", "SMA", "EMA", "WMA"])
m = input(1.5, "Multiplier")
src1 = input(high)
src2 = input(low)
pline = input(true, "Show Price Lines")
col1 = input(color.blue, "ATR Text Color")
col2 = input(color.teal, "Low Text Color",inline ="1")
col3 = input(color.red, "High Text Color",inline ="2")

collong = input(color.teal, "Low Line Color",inline ="1")
colshort = input(color.red, "High Line Color",inline ="2")

ma_function(source, length) =>
	if smoothing == "RMA"
		ta.rma(source, length)
	else
		if smoothing == "SMA"
			ta.sma(source, length)
		else
			if smoothing == "EMA"
				ta.ema(source, length)
			else
				ta.wma(source, length)

a = ma_function(ta.tr(true), length) * m
x = ma_function(ta.tr(true), length) * m + src1
x2 = src2 - ma_function(ta.tr(true), length) * m

p1 = plot(x, title = "ATR Short Stop Loss", color=color.blue)
p2 = plot(x2, title = "ATR Long Stop Loss", color= color.blue)


///////////////////////////////////////////////////////////////////////////////////////////////

shortCondition = high < ema and direction == 1 and smooth_k > 80 or (ema_condition == false and direction == 1 and smooth_k > 80)
if (shortCondition) and strategy.position_size == 0
    strategy.entry("sell", strategy.short)

longCondition = low > ema and direction == -1 and smooth_k < 20 or (ema_condition == false and direction == -1 and smooth_k < 20)
if (longCondition) and strategy.position_size == 0
    strategy.entry("buy", strategy.long)

x2_val = x2[bar_index - strategy.opentrades.entry_bar_index(0)]
g = (strategy.opentrades.entry_price(0) - x2_val) * 2 // tp for buy

x_val = x[bar_index - strategy.opentrades.entry_bar_index(0)]
k = (x_val - strategy.opentrades.entry_price(0)) * 2 //tp for sell

activate_breakeven_sl_price = strategy.opentrades.entry_price(0) + (strategy.opentrades.entry_price(0) - x2_val) //price to activate sl for buy
sl_breakeven_price_activated = ta.highest(high, strategy.position_size == 0 ? nz(strategy.opentrades.entry_bar_index(0), 1):bar_index - strategy.opentrades.entry_bar_index(0)) > activate_breakeven_sl_price ? true:false //checks if 1:1 ratio has been reached

activate_breakeven_sl_price1 = strategy.opentrades.entry_price(0) - (x_val - strategy.opentrades.entry_price(0)) //price to activate sl for buy
sl_breakeven_price_activated1 = ta.lowest(high, strategy.position_size == 0 ? nz(strategy.opentrades.entry_bar_index(0), 1):bar_index - strategy.opentrades.entry_bar_index(0)) < activate_breakeven_sl_price1 ? true:false //checks if 1:1 ratio has been reached

if strategy.position_size > 0
    strategy.exit(id="buy exit", from_entry="buy",limit=strategy.opentrades.entry_price(0) + g, stop=sl_breakeven_price_activated ? strategy.opentrades.entry_price(0):x2_val)

if strategy.position_size < 0
    strategy.exit(id="sell exit", from_entry="sell",limit=strategy.opentrades.entry_price(0) - k, stop=sl_breakeven_price_activated1 ? strategy.opentrades.entry_price(0):x_val)


plot(strategy.position_size > 0 ? strategy.opentrades.entry_price(0) + g:na, color=color.green, style=plot.style_linebr, title="takeprofit line") //to plot tp line for buy
plot(strategy.position_size > 0 and sl_breakeven_price_activated == false ? x2_val:na, color=color.red, style=plot.style_linebr, title="stoploss line") //to plot sl line for buy
plot(sl_breakeven_price_activated and strategy.position_size > 0 ? strategy.opentrades.entry_price(0):na, color=color.maroon, style=plot.style_linebr, linewidth=2, title="stoploss line breakeven") //to plot breakeven sl for buy

plot(strategy.position_size < 0 ? strategy.opentrades.entry_price(0) - k:na, color=color.green, style=plot.style_linebr, title="takeprofit line") //to plot tp line for sell
plot(strategy.position_size < 0 and sl_breakeven_price_activated1 == false ? x_val:na, color=color.red, style=plot.style_linebr, title="stoploss line") //to plot sl line for sell
plot(sl_breakeven_price_activated1 and strategy.position_size < 0 ? strategy.opentrades.entry_price(0):na, color=color.maroon, style=plot.style_linebr, linewidth=2, title="stoploss line breakeven") //to plot breakeven sl for sell
관련
- RSI/MACD/ATR과 함께 강화된 EMA 크로스오버 전략
- Z-Score 트렌드 전략
- EMA의 긴 입장은 위험 관리 전략과 교차합니다
- VWAP 거래 전략
- 웨이브 트렌드 크로스 레이지 베어 전략
- AlphaTradingBot 거래 전략
- RSI와 듀얼 EMA 크로스오버 신호 양적 전략
- 엘리엇 파동 이론 4-9 충동 파동 자동 탐지 거래 전략
- KRK aDa AI 향상과 함께 스토카스틱 느린 평균 반전 전략
- EMA23/EMA50 이중 이동 평균 크로스오버 양적 거래 전략
- MACD 골든 크로스와 데스 크로스 전략
더 많은
- 크로스 플레이
- 더 작은 프랙탈 (+ 투명성)
- BB-RSI-ADX 입구점
- 헬스-4에마
- 각 공격 후보 라인 표시기
- 키준센 선과 십자가
- AMACD - 모든 이동 평균 컨버전스 디버전스
- MA 하이브리드 BY RAJ
- 다이아몬드 트렌드
- 니크 스톡
- MTF RSI & STOCH 전략
- EMA + AROON + ASH
- 모멘텀 2.0
- EHMA 범위 전략
- 이동 평균 구매 판매
- 미다스 Mk. II - 최고의 암호화 스윙
- TMA-레거시
- TV의 높고 낮은 전략
- 가장 좋은 트레이딩 뷰 전략
- 빅 스냅퍼 경고 R3.0 + Chaiking 변동성 상태 + TP RSI