변동 높은/저하 지표와 MACD 및 EMA 확인
저자:차오장, 날짜: 2022-05-11 16:28:07태그:MACD
Swing High/Low 지표와 MACD 및 EMA 확인 KaizenTraderB
저는 이 지표를 시장 구조 파기 전략과 함께 사용할 수 있도록 설계했습니다. MACD에 의해 확인된 스윙 최고와 최저를 표시합니다. 또한 방향 편차를 결정하기 위해 더 높은 시간 프레임 빠른 및 느린 EMA를 표시합니다. 또한 하락 트렌드에서 Swing Low 브레이크와 상승 트렌드에서 Swing High 브레이크를 신호하는 알림을 제공합니다. 마지막 스윙 하이와 로우에 수평선을 그립니다.
이 표시기를 입력 시간 프레임에 표시하고 설정에서 더 높은 시간 프레임을 선택합니다. 또한 스윙 하위, 하위 및 EMA의 룩백 기간을 변경할 수 있습니다.
이것을 사용할 때 나는 HTF 트렌드의 방향으로 스윙 하위/하위 브레이크를 찾고 있습니다 그 다음 EMA 트렌드 방향으로 진입하기 위해 가격 부진 수준과 유동성 영역 (비크, 오더 블록, 가격 혼잡) 사이의 인기를 찾으십시오.
백테스트
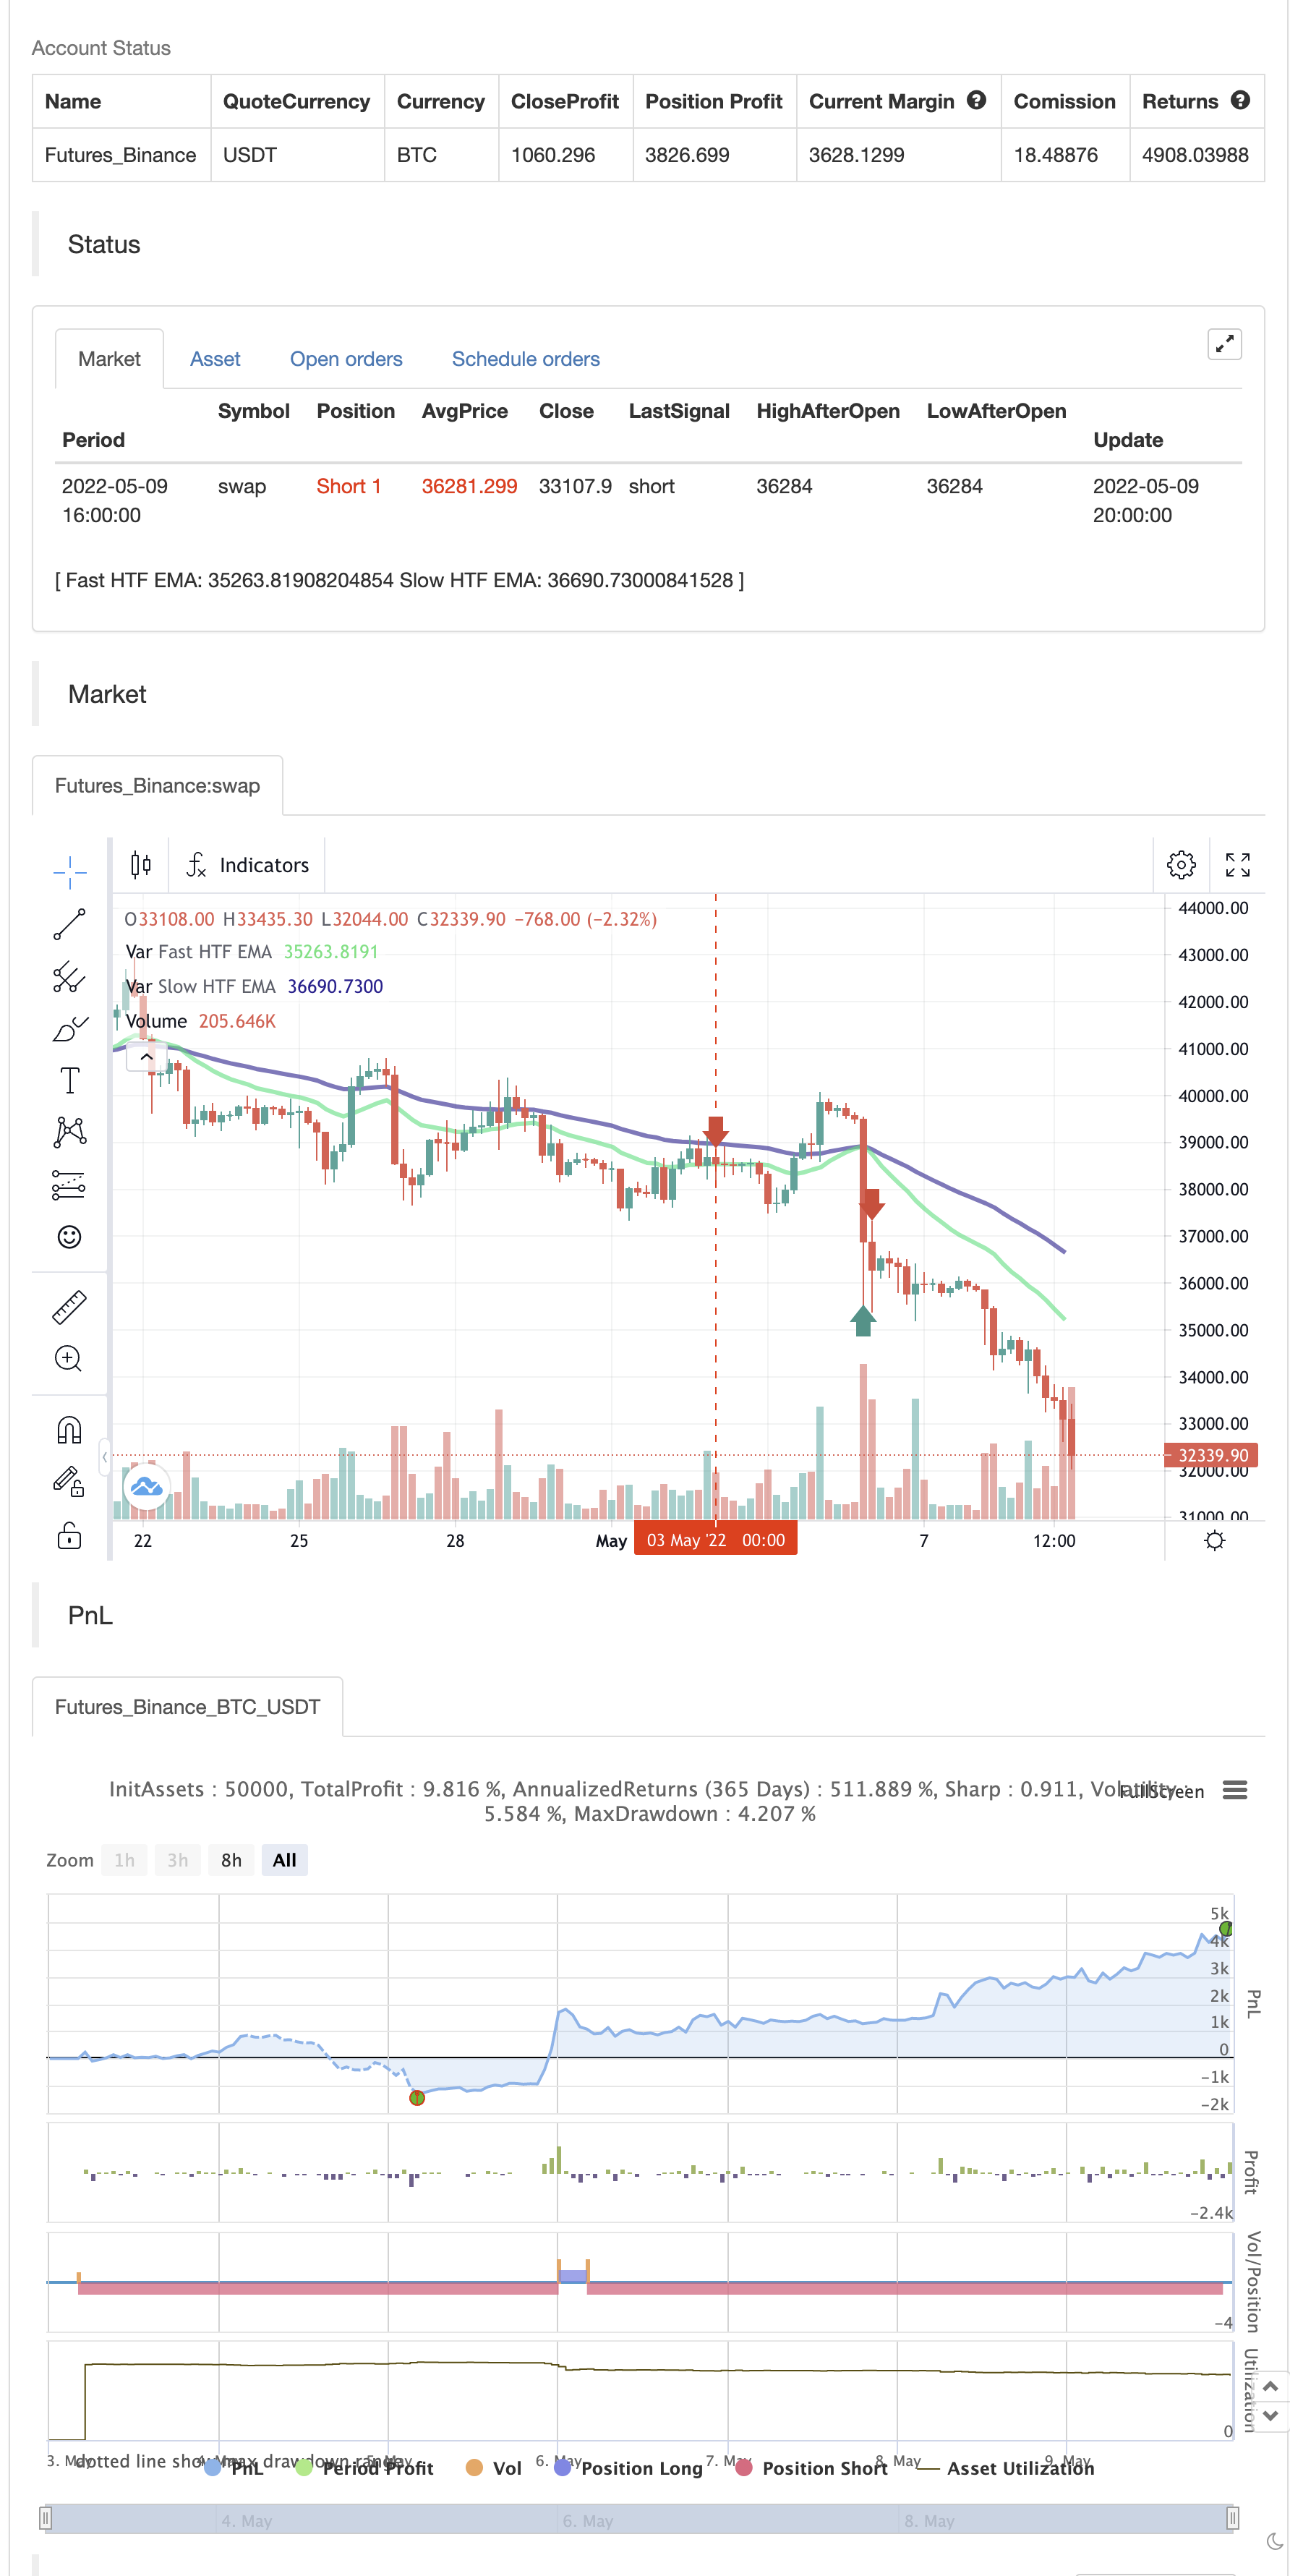
/*backtest
start: 2022-05-03 00:00:00
end: 2022-05-09 23:59:00
period: 4h
basePeriod: 15m
exchanges: [{"eid":"Futures_Binance","currency":"BTC_USDT"}]
*/

// Swing High/Low Indicator w/ MACD and EMA Confirmations by KaizenTraderB
//
//I designed this indicator to be used with a market structure break strategy.
//It labels swing highs and lows that are confirmed by the MACD.
//It also displays a higher timeframe Fast and Slow EMA to determine directional bias.
//Also provides alerts that signal Swing Low breaks in downtrends and Swing High Breaks in uptrends.
//It draws a horizontal line on the last Swing High and Low.
//
//Display this indicator on your entry timeframe and choose your Higher Timeframe in settings.
//You can also change lookback period for Swing Highs and Lows and EMA's.
//
//@version=4
study("Swing High/Low Indicator w/ MACD and HTF EMA's", overlay=true)

barsback = input(5, title='Bars back to check for a swing')
showsig = input(true, title='Show Signal Markers')
res = input(title="EMA Timeframe", defval="240")
flen = input(title="Fast EMA Length", type=input.integer, defval=20)
slen = input(title="Slow EMA Length", type=input.integer, defval=50)
showema = input(title="Show EMA's", type=input.bool, defval=true)
showentry = input(title="Show Swing Break Entry Levels", type=input.bool, defval=true)

//HTF EMA's

fema = ema(close, flen)
sema = ema(close, slen)

rp_security(_symbol, _res, _src, _gaps, _lookahead) => security(_symbol, _res, _src[barstate.isrealtime ? 1 : 0], _gaps, _lookahead)

femaSmooth = rp_security(syminfo.tickerid, res, fema, barmerge.gaps_on, barmerge.lookahead_off)
semaSmooth = rp_security(syminfo.tickerid, res, sema, barmerge.gaps_on, barmerge.lookahead_off)
plot(showema ? femaSmooth : na,"Fast HTF EMA", color.lime, 3)
plot(showema ? semaSmooth : na,"Slow HTF EMA", color.navy, 3)

downtrend = femaSmooth < semaSmooth
uptrend = femaSmooth > semaSmooth

//Swing Highs and Lows
////////////////////////////////////////////////////////////////////////////////
//Thank you Backtest-Rookies.com for the Swing Detection Indicator code

swing_detection(index)=>
    swing_high = false
    swing_low = false
    start = (index*2) - 1 // -1 so we have an even number of
    swing_point_high = high[index]
    swing_point_low = low[index]

    //Swing Highs
    for i = 0 to start
        swing_high := true
        if i < index
            if high[i] > swing_point_high
                swing_high := false
                break
        // Have to do checks before pivot and after seperately because we can get
        // two highs of the same value in a row. Notice the > and >= difference
        if i > index
            if high[i] >= swing_point_high
                swing_high := false
                break

    //Swing lows
    for i = 0 to start
        swing_low := true
        if i < index
            if low[i] < swing_point_low
                swing_low := false
                break
        // Have to do checks before pivot and after seperately because we can get
        // two lows of the same value in a row. Notice the > and >= difference
        if i > index
            if low[i] <= swing_point_low
                swing_low := false
                break

    [swing_high, swing_low]

// Check for a swing
[swing_high, swing_low] = swing_detection(barsback)
////////////////////////////////////////////////////////////////////////////////

float swing_high_price = na
float swing_low_price = na

if swing_high
    swing_high_price := high[barsback]
if swing_low
    swing_low_price := low[barsback]

[macdline, signalline, histline] = macd(close,12,26,9)

macpos = histline[barsback] > 0
macneg = histline[barsback] < 0

// Plotting

SHPrice = "SH\n" + str.tostring(swing_high_price)
SLPrice = "SL\n" + str.tostring(swing_low_price)

if swing_high and macpos and showsig
    //SHLabel = label.new(bar_index[barsback], swing_high_price, SHPrice, xloc.bar_index, yloc.abovebar, color.red, label.style_arrowdown, textcolor=color.red, size=size.normal)
    //SHLine = line.new(bar_index[barsback], swing_high_price, bar_index[barsback] + 20, swing_high_price, xloc.bar_index, extend.none, color.black, width=2)
    //line.delete(SHLine[1])

if swing_low and macneg and showsig
    //label.new(bar_index[barsback], swing_low_price, SLPrice, xloc.bar_index, yloc.belowbar, color.green, label.style_arrowup, textcolor=color.green)
    //SLLine = line.new(bar_index[barsback], swing_low_price, bar_index[barsback] + 20, swing_low_price, xloc.bar_index, extend.none, color.black, width=2)
    //line.delete(SLLine[2])

//alerts
alertcondition(uptrend and close > swing_high_price, "Swing High Break in Uptrend", "Swing High Break!")
alertcondition(downtrend and close < swing_low_price, "Swing Low Break in Downtrend", "Swing Low Break!")

if uptrend
    strategy.entry("Enter Long", strategy.long)
else if downtrend
    strategy.entry("Enter Short", strategy.short)
관련
- RSI/MACD/ATR과 함께 강화된 EMA 크로스오버 전략
- MACD와 RSI 결합된 장기 거래 전략
- 다중 지표 조합 전략 (CCI, DMI, MACD, ADX)
- 전략에 따른 다중 지표 트렌드
- CCI, DMI, MACD 하이브리드 장기 단기 전략
- 엘리엇 파동 이론 4-9 충동 파동 자동 탐지 거래 전략
- MACD 골든 크로스와 데스 크로스 전략
- MACD-V 및 피보나치 다중 시간 프레임 동적 영업 전략
- MACD BB 브레이크업 전략
- ATR 기반의 리스크 관리로 최적화된 MACD 트렌드 추적 전략
- 제로래그 MACD 긴 짧은 전략
더 많은