HALFTREND + HEMA + SMA (거짓 신호의 전략)
저자:차오장, 날짜: 2022-05-12 17:36:04태그:SMAWMAEMA
=== 소개와 크레딧 === 이 스크립트는 YouTube에서 FALSE SIGNAL의 전략을 재현하기 위해 3개의 지표의 혼합입니다. 첫 번째 지표는 SMA (단순 이동 평균) 입니다. 두 번째는 알렉스그로버가 개발한 헬스 추정치 (HEMA) 입니다. 셋째는 알렉스 오레호프 (Everget) 의 반트렌드입니다. 각 지표에 대한 크레딧은 그들에게 속합니다, 나는 단지 몇 가지 추가 옵션, 설정, 등과 함께 FALSE SIGNALs 전략을 만들기 위해 그 SMA를 수정, 또한 PineScript 5에 모든 코드를 업데이트
=== 전략 === 기본 설정은 이미 FALSE SIGNALs가 요구하는대로 변경할 필요가 없습니다. FOR LONGS (녹색 배경에는 LONG 항목이 표시됩니다.)
- HEMA는 SMA보다 높을 겁니다
- 촛불의 몸체는 HEMA 위에 완전히 있어야 합니다. (wick은 HEMA를 만질 수 있지만 이 필터를 활성화/실용할 수 있는 옵션이 있습니다.)
- 하프트렌드는 BUY 화살표를 트리거해야 합니다.
SHORTS (붉은 배경에는 SHORT 항목이 표시됩니다.)
- HEMA*는 SMA보다 낮아야 합니다.
- 촛불의 몸체는 HEMA 아래 완전히 있어야합니다 (wick은 HEMA를 만질 수 있지만이 필터를 활성화 / 비활성화하는 옵션이 있습니다.)
- 하프트렌드는 SELL 화살표를 트리거해야 합니다. * FALSE SIGNAL는 50 대신 쇼트를 위해 HEMA 기간을 40으로 변경하는 것을 제안합니다.
자세한 내용은 FALSE SIGNAL의 유튜브 채널을 확인해 주세요.
=== 일반 개선 === 파인스크립트 5로 업그레이드 몇 가지 성능 개선. SMA는 LONG만 복용해야 할 때 녹색 색을 취하고 SHORTS는 빨간색을 취합니다. HEMA는 LONG만 사용해야 할 때 AQUA 색을 취하고 SHORTS는 오렌지 색을 취합니다.
=== 개인 메모 === 높은 시간 (1h+) 는 입력 트리거에 많은 시간이 걸릴 수 있습니다, 인내하거나 낮은 시간 프레임을 사용하십시오.
이 스크립트를 구성하는 지표의 저자들과 이 전략을 만든 FALSE SINGAL에게 다시 한번 감사드립니다.
백테스트
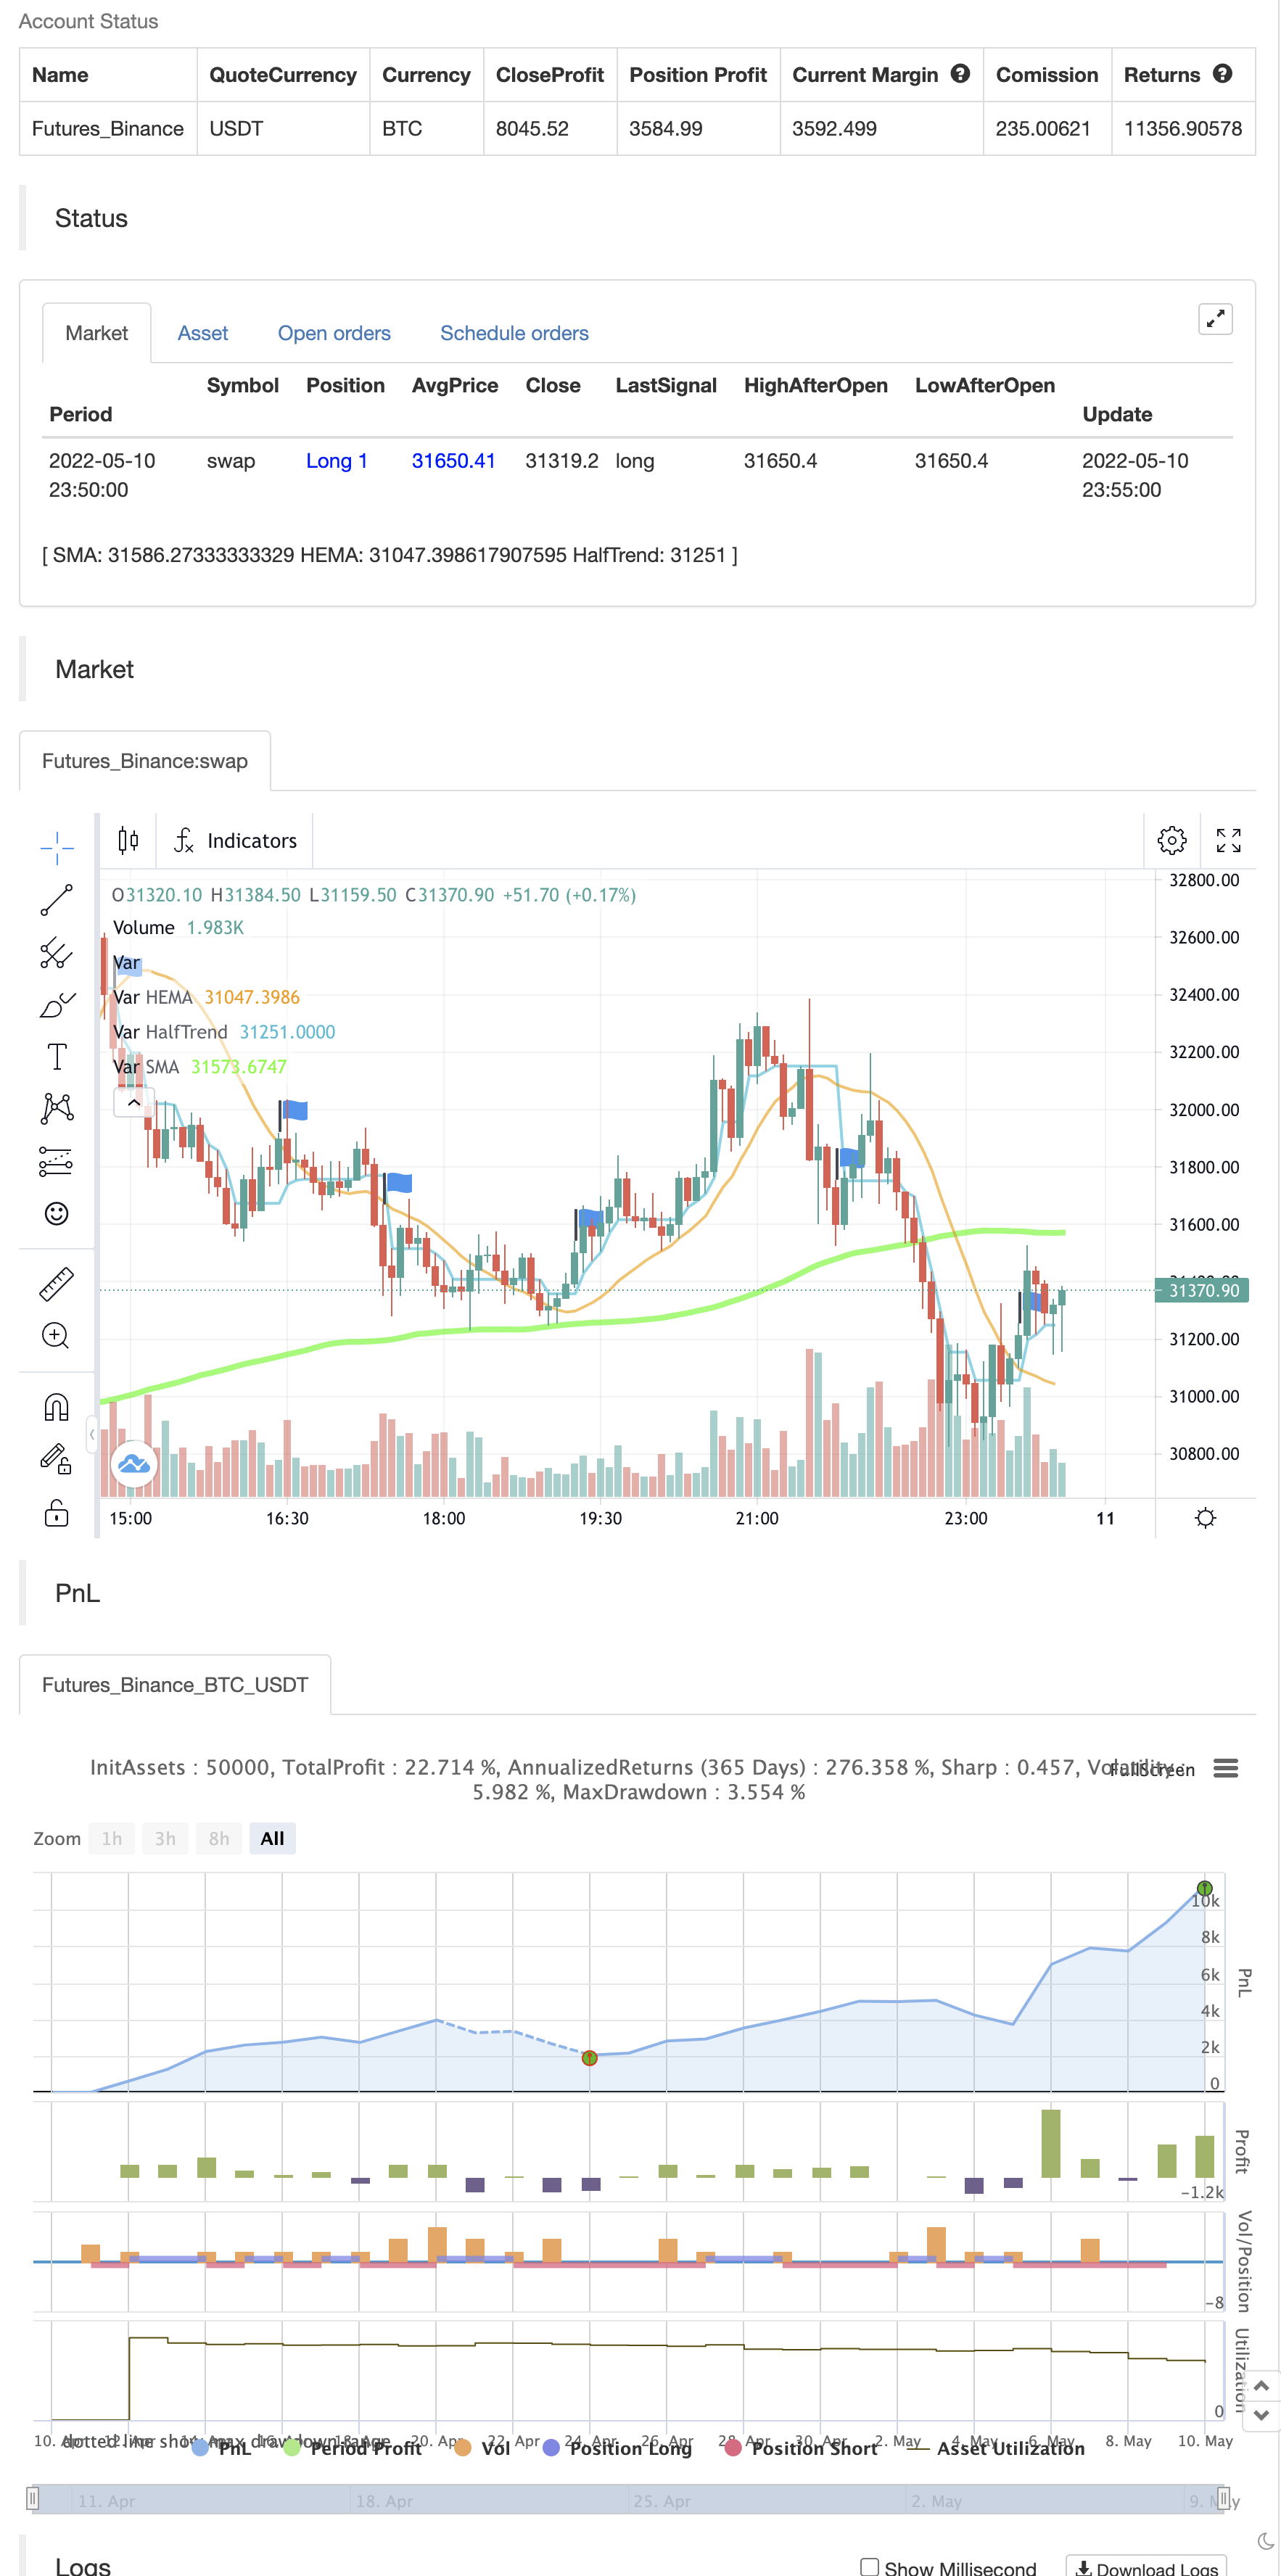
/*backtest
start: 2022-04-11 00:00:00
end: 2022-05-10 23:59:00
period: 5m
basePeriod: 1m
exchanges: [{"eid":"Futures_Binance","currency":"BTC_USDT"}]
*/

// Source code is subject to the terms of the Mozilla Public License 2.0 at https://mozilla.org/MPL/2.0/ - © José Manuel Gassin Pérez-Traverso
// Credit for each indicator belongs to its author.

//@version=5
indicator(title="HALFTREND + HEMA + SMA (FALSE SIGNAL)", shorttitle="HALFTREND + HEMA + SMA (FALSE SIGNAL)", overlay=true)


//== Constantes
c_negro               = color.rgb(0, 0, 0, 0)
c_verde_radiactivo    = color.rgb(0, 255, 0, 0)
c_verde               = color.rgb(0, 128, 0, 0)
c_verde_oscuro        = color.rgb(0, 80, 0, 0)
c_rojo_radiactivo     = color.rgb(255, 0, 0, 0)
c_rojo                = color.rgb(128, 0, 0, 0)
c_rojo_oscuro         = color.rgb(80, 0, 0, 0)
c_red_t               = color.new(color.red, 90)
c_amarillo            = color.rgb(255, 255, 0, 0)
noneColor             = color.new(color.white, 100)


//== Estrategia
GRUPO_ESTRATEGIA = "Strategy"
ESTRATEGIA_vela_completa_fuera_hema = input.bool(title="Full candle must be outside the HEMA / Wicks can touch the HEMA but body must be out", defval=false, group=GRUPO_ESTRATEGIA)

//== Simple Moving Average (SMA)
GRUPO_SMA = "Simple Moving Average (SMA)"
len = input.int(150, minval=1, title="Length", group=GRUPO_SMA)
src = input(close, title="Source", group=GRUPO_SMA)
offset = input.int(title="Offset", defval=6, minval=-500, maxval=500, group=GRUPO_SMA)
sma = ta.sma(src, len)


//== Hull Estimate (HEMA) - Source code is subject to the terms of the Mozilla Public License 2.0 at https://mozilla.org/MPL/2.0/ - © alexgrover
GRUPO_HEMA = "Hull Estimate (HEMA)"
length = input.int(title="Length", defval=50, minval=1, group=GRUPO_HEMA)
hema = 3 * ta.wma(close, length / 2) - 2 * ta.ema(close, length / 2)


//== HALFTREND - Copyright (c) 2021-present, Alex Orekhov (everget)
GRUPO_HT = "Halftrend"
amplitude = input(title='Amplitude', defval=1, group=GRUPO_HT)
channelDeviation = input(title='Channel Deviation', defval=2, group=GRUPO_HT)
showArrows = input(title='Show Arrows', defval=true, group=GRUPO_HT)
showChannels = input(title='Show Channels', defval=false, group=GRUPO_HT)

var int trend = 0
var int nextTrend = 0
var float maxLowPrice = nz(low[1], low)
var float minHighPrice = nz(high[1], high)

var float up = 0.0
var float down = 0.0
float atrHigh = 0.0
float atrLow = 0.0
float arrowUp = na
float arrowDown = na

atr2 = ta.atr(100) / 2
dev = channelDeviation * atr2

highPrice = high[math.abs(ta.highestbars(amplitude))]
lowPrice = low[math.abs(ta.lowestbars(amplitude))]
highma = ta.sma(high, amplitude)
lowma = ta.sma(low, amplitude)

if nextTrend == 1
    maxLowPrice := math.max(lowPrice, maxLowPrice)

    if highma < maxLowPrice and close < nz(low[1], low)
        trend := 1
        nextTrend := 0
        minHighPrice := highPrice
        minHighPrice
else
    minHighPrice := math.min(highPrice, minHighPrice)

    if lowma > minHighPrice and close > nz(high[1], high)
        trend := 0
        nextTrend := 1
        maxLowPrice := lowPrice
        maxLowPrice

if trend == 0
    if not na(trend[1]) and trend[1] != 0
        up := na(down[1]) ? down : down[1]
        arrowUp := up - atr2
        arrowUp
    else
        up := na(up[1]) ? maxLowPrice : math.max(maxLowPrice, up[1])
        up
    atrHigh := up + dev
    atrLow := up - dev
    atrLow
else
    if not na(trend[1]) and trend[1] != 1
        down := na(up[1]) ? up : up[1]
        arrowDown := down + atr2
        arrowDown
    else
        down := na(down[1]) ? minHighPrice : math.min(minHighPrice, down[1])
        down
    atrHigh := down + dev
    atrLow := down - dev
    atrLow

ht = trend == 0 ? up : down

var color buyColor = color.aqua
var color sellColor = color.orange

htColor = trend == 0 ? buyColor : sellColor

buySignal = not na(arrowUp) and trend == 0 and trend[1] == 1
sellSignal = not na(arrowDown) and trend == 1 and trend[1] == 0


//== Plots
// SMA
sma_color = ohlc4 > sma ? c_verde_radiactivo : c_rojo_radiactivo
plot(sma, title="SMA", color=sma_color, linewidth=4, offset=offset)

// HEMA
hema_color = hema > sma ? color.aqua : color.orange
plot(hema, title="HEMA", color=hema_color, linewidth=2)

// HALFTREND
htPlot = plot(ht, title='HalfTrend', linewidth=2, color=htColor, display=display.none)
atrHighPlot = plot(showChannels ? atrHigh : na, title='ATR High', style=plot.style_circles, color=color.new(sellColor, 0))
atrLowPlot = plot(showChannels ? atrLow : na, title='ATR Low', style=plot.style_circles, color=color.new(buyColor, 0))
fill(htPlot, atrHighPlot, title='ATR High Ribbon', color=color.new(sellColor, 90))
fill(htPlot, atrLowPlot, title='ATR Low Ribbon', color=color.new(buyColor, 90))
plotshape(showArrows and buySignal ? atrLow : na, title='Arrow Up', style=shape.triangleup, location=location.absolute, size=size.tiny, color=color.new(buyColor, 0))
plotshape(showArrows and sellSignal ? atrHigh : na, title='Arrow Down', style=shape.triangledown, location=location.absolute, size=size.tiny, color=color.new(sellColor, 0))

//== Señales estrategia
min = ESTRATEGIA_vela_completa_fuera_hema ? low : math.min(open, close)
max = ESTRATEGIA_vela_completa_fuera_hema ? high : math.max(open, close)
long_sma_y_hema  = hema > sma
short_sma_y_hema = hema < sma
long_halftrend   = buySignal
short_halftrend  = sellSignal
long_vela        = min > hema and max > hema
short_vela       = min < hema and max < hema
long = long_sma_y_hema and long_halftrend and long_vela
short = short_sma_y_hema and short_halftrend and short_vela
color_fondo = long ? color.new(color.lime, 85) : short ? color.new(color.red, 80) : noneColor
bgcolor(color_fondo)


//== Alertas
alertcondition(long, title="▶ LONG", message="[{{exchange}}:{{ticker}}] LONG ENTRY")
alertcondition(short, title="▶ SHORT", message="[{{exchange}}:{{ticker}}] SHORT ENTRY")


if long
    strategy.entry("Enter Long", strategy.long)
else if short
    strategy.entry("Enter Short", strategy.short)
관련
- 에너지 바와 함께 레드K 듀얼 바더
- 이동 평균과 볼린거 대역에 기초한 양적 거래 전략
- 이동 평균 크로스 알림, 다중 시간 프레임 (MTF)
- RedK 부피 가속 방향 에너지 비율
- 레인보우 오시레이터
- 레드K 모멘텀 바
- ESSMA
- 슈퍼 스칼퍼
- 슈퍼 점프 턴 백 볼링거 밴드
- 더 똑똑한 MACD
더 많은