후쿠이즈 오카타-EMA + 이치모쿠
저자:차오장, 날짜: 2022-05-16 17:43:51태그:EMA
이 전략은 8개의 다른 기간과 Ichimoku Cloud의 EMA를 기반으로 1시간 4시간과 매일 시간 프레임에서 더 잘 작동합니다.
이치모쿠에 대한 짧은 소개
이치모쿠 클라우드 (Ichimoku Cloud) 는 지원 및 저항 수준을 보여주는 기술 지표의 집합체이며, 추진력과 트렌드 방향을 보여줍니다. 여러 평균을 가지고 차트에 그려내서 수행합니다. 또한 이러한 수치를 사용하여 미래에 가격이 지원 또는 저항을 찾을 수있는 곳을 예측하려고하는
# EMA에 대한 간단한 소개 # 기하급수적 이동 평균 (Exponential Moving Average, EMA) 은 가장 최근의 데이터 포인트에 더 큰 무게와 중요성을 부여하는 이동 평균 (MA) 의 일종이다. 기하급수적 이동 평균은 기하급수적으로 가중된 이동 평균으로도 불린다. 기하급수적으로 가중된 이동 평균은 단순한 이동 평균 (Simple Moving Average, SMA) 보다 최근 가격 변화에 더 크게 반응하며, 기간 내 모든 관찰에 동일한 무게를 적용한다.
#어떻게 사용# 전략은 입력 포인트를 자체적으로 줄 것입니다, 당신은 수동으로 모니터링하고 이익을 취할 수 있습니다 (보증), 또는 당신은 출구 설정을 사용할 수 있습니다.
EMA (Color) = 상승 추세 EMA (그레이) = 하락 추세
#조건# 구매 = 모든 Ema (색) 구름 위에. SELL= 모든 Ema는 회색이 됩니다.
백테스트
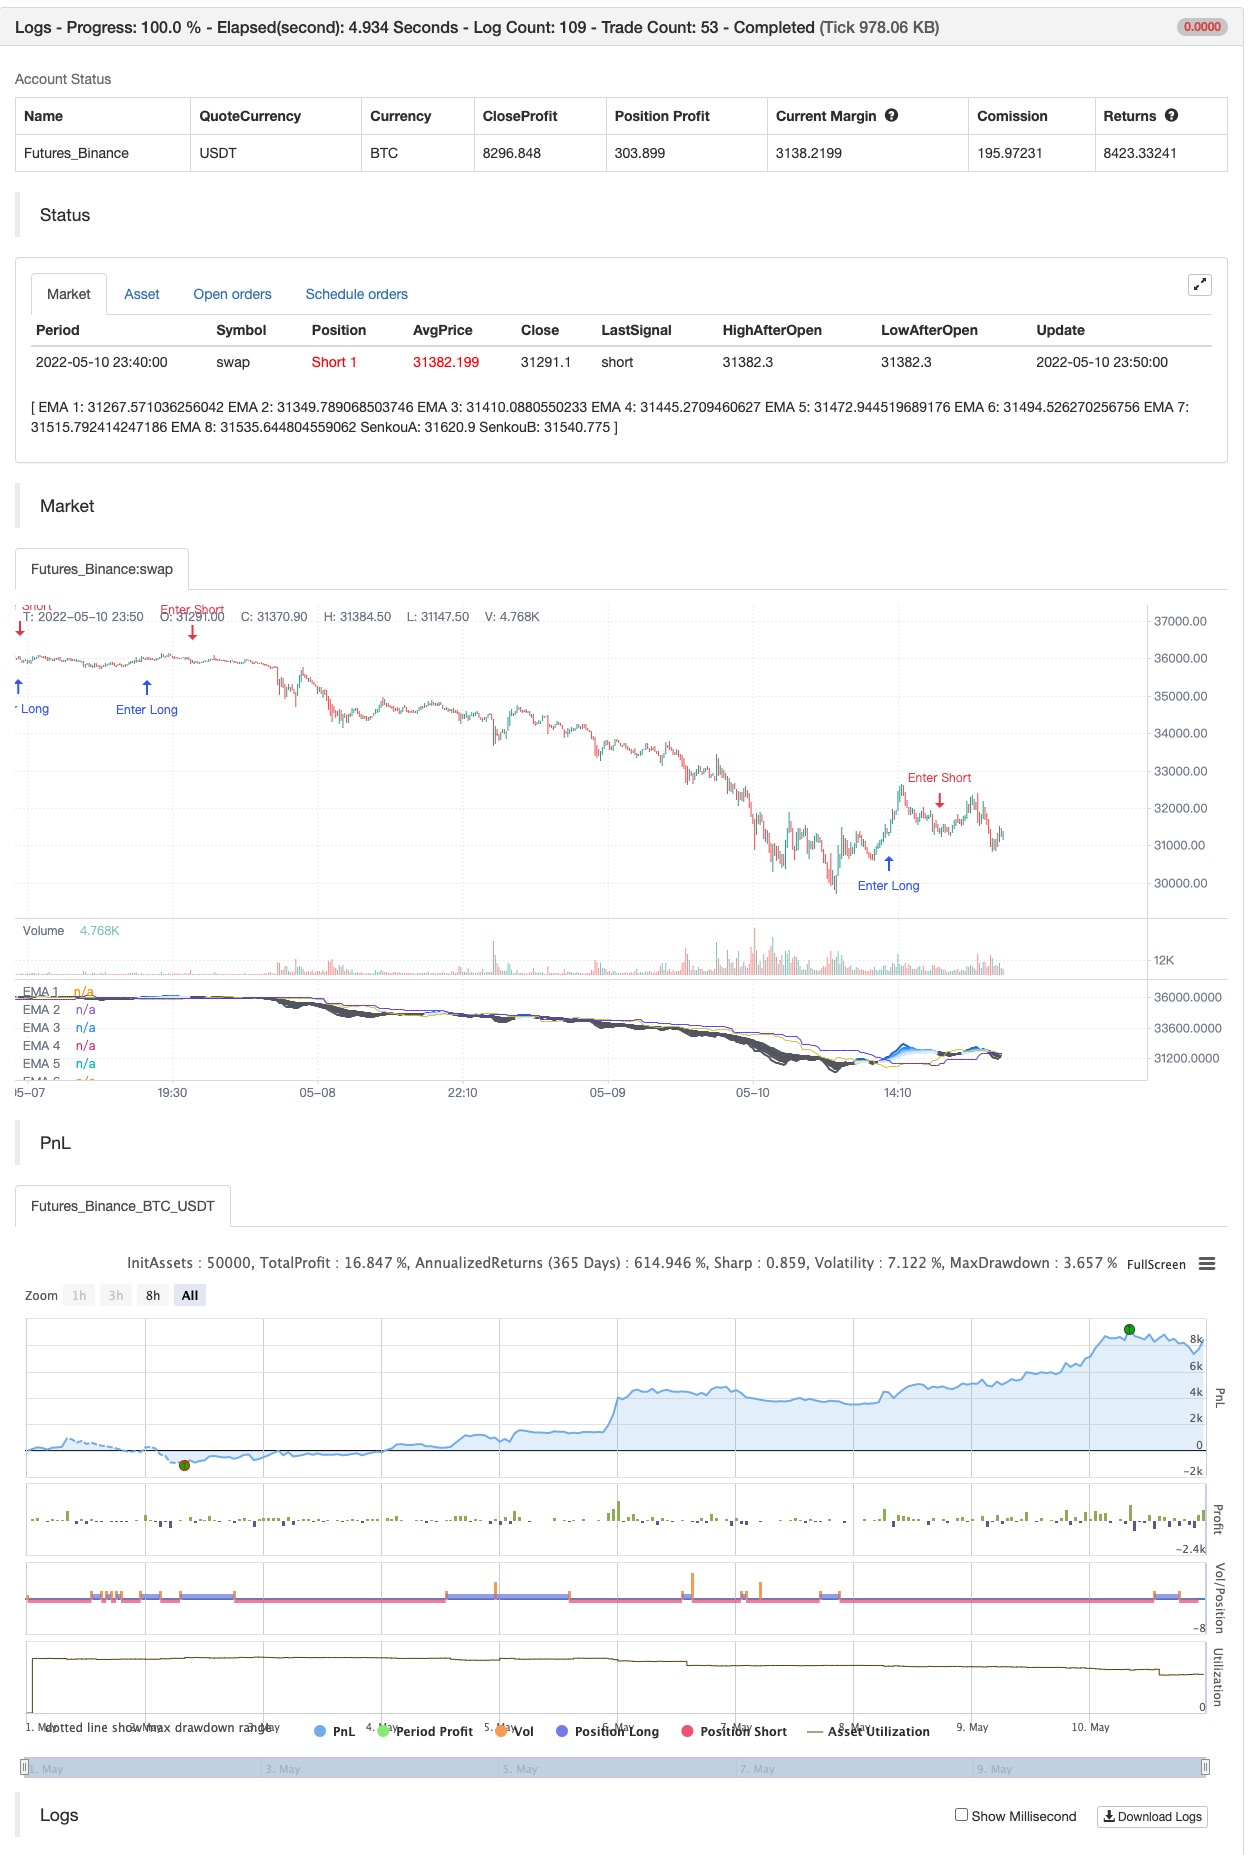
/*backtest
start: 2022-05-01 00:00:00
end: 2022-05-10 23:59:00
period: 10m
basePeriod: 1m
exchanges: [{"eid":"Futures_Binance","currency":"BTC_USDT"}]
*/

//@version=5
//Fukuiz

//strategy(title='Fukuiz Octa-EMA + Ichimoku', shorttitle='Fuku octa strategy', overlay=true, process_orders_on_close=true,
//     default_qty_type= strategy.cash , default_qty_value=1000, currency=currency.USD, initial_capital=10000 ,commission_type = strategy.commission.percent,commission_value=0.25)


//OCTA EMA ##################################################


// Functions
f_emaRibbon(_src, _e1, _e2, _e3, _e4, _e5, _e6, _e7, _e8) =>
    _ema1 = ta.ema(_src, _e1)
    _ema2 = ta.ema(_src, _e2)
    _ema3 = ta.ema(_src, _e3)
    _ema4 = ta.ema(_src, _e4)
    _ema5 = ta.ema(_src, _e5)
    _ema6 = ta.ema(_src, _e6)
    _ema7 = ta.ema(_src, _e7)
    _ema8 = ta.ema(_src, _e8)
    [_ema1, _ema2, _ema3, _ema4, _ema5, _ema6, _ema7, _ema8]

showRibbon = input(true, 'Show Ribbon (EMA)')
ema1Len = input(5, title='EMA 1 Length')
ema2Len = input(11, title='EMA 2 Length')
ema3Len = input(15, title='EMA 3 Length')
ema4Len = input(18, title='EMA 4 Length')
ema5Len = input(21, title='EMA 5 Length')
ema6Len = input(24, title='EMA 6 Length')
ema7Len = input(28, title='EMA 7 Length')
ema8Len = input(34, title='EMA 8 Length')

[ema1, ema2, ema3, ema4, ema5, ema6, ema7, ema8] = f_emaRibbon(close, ema1Len, ema2Len, ema3Len, ema4Len, ema5Len, ema6Len, ema7Len, ema8Len)

//Plot

ribbonDir = ema8 < ema2
p1 = plot(ema1, color=showRibbon ? ribbonDir ? #1573d4 : color.new(#5d606b, 15) : na, linewidth=2, title='EMA 1')
p2 = plot(ema2, color=showRibbon ? ribbonDir ? #3096ff : color.new(#5d606b, 15) : na, linewidth=2, title='EMA 2')
plot(ema3, color=showRibbon ? ribbonDir ? #57abff : color.new(#5d606b, 15) : na, linewidth=2, title='EMA 3')
plot(ema4, color=showRibbon ? ribbonDir ? #85c2ff : color.new(#5d606b, 15) : na, linewidth=2, title='EMA 4')
plot(ema5, color=showRibbon ? ribbonDir ? #9bcdff : color.new(#5d606b, 30) : na, linewidth=2, title='EMA 5')
plot(ema6, color=showRibbon ? ribbonDir ? #b3d9ff : color.new(#5d606b, 30) : na, linewidth=2, title='EMA 6')
plot(ema7, color=showRibbon ? ribbonDir ? #c9e5ff : color.new(#5d606b, 30) : na, linewidth=2, title='EMA 7')
p8 = plot(ema8, color=showRibbon ? ribbonDir ? #dfecfb : color.new(#5d606b, 30) : na, linewidth=2, title='EMA 8')
fill(p1, p2, color.new(#1573d4, 85))
fill(p2, p8, color.new(#1573d4, 85))

//ichimoku##################################################

//color
colorblue = #3300CC
colorred = #993300
colorwhite = #FFFFFF
colorgreen = #CCCC33
colorpink = #CC6699
colorpurple = #6633FF

//switch
switch1 = input(false, title='Chikou')
switch2 = input(false, title='Tenkan')
switch3 = input(false, title='Kijun')

middleDonchian(Length) =>
    lower = ta.lowest(Length)
    upper = ta.highest(Length)
    math.avg(upper, lower)

//Functions
conversionPeriods = input.int(9, minval=1)
basePeriods = input.int(26, minval=1)
laggingSpan2Periods = input.int(52, minval=1)
displacement = input.int(26, minval=1)
Tenkan = middleDonchian(conversionPeriods)
Kijun = middleDonchian(basePeriods)
xChikou = close
SenkouA = middleDonchian(laggingSpan2Periods)
SenkouB = (Tenkan[basePeriods] + Kijun[basePeriods]) / 2

//Plot
A = plot(SenkouA[displacement], color=color.new(colorpurple, 0), title='SenkouA')
B = plot(SenkouB, color=color.new(colorgreen, 0), title='SenkouB')
plot(switch1 ? xChikou : na, color=color.new(colorpink, 0), title='Chikou', offset=-displacement)
plot(switch2 ? Tenkan : na, color=color.new(colorred, 0), title='Tenkan')
plot(switch3 ? Kijun : na, color=color.new(colorblue, 0), title='Kijun')
fill(A, B, color=color.new(colorgreen, 90), title='Ichimoku Cloud')

//Buy and Sell signals
fukuiz = math.avg(ema2, ema8)
white = ema2 > ema8
gray = ema2 < ema8
buycond = white and white[1] == 0
sellcond = gray and gray[1] == 0
bullish = ta.barssince(buycond) < ta.barssince(sellcond)
bearish = ta.barssince(sellcond) < ta.barssince(buycond)
buy = bearish[1] and buycond and fukuiz > SenkouA[displacement] and fukuiz > SenkouB
sell = bullish[1] and sellcond and fukuiz > SenkouA[displacement] and fukuiz > SenkouB
sell2=ema2 < ema8
buy2 = white and fukuiz > SenkouA[displacement] and fukuiz > SenkouB

//$$$$$$$$$$$$$$$$$$$$$$$$$$$$$$$$$$$$$$$$$$$$$$$$$$$$$$$$$$$$$$$$$$$$$$
//Back test

startYear = input.int(defval=2017, title='Start Year', minval=2000, maxval=3000)
startMonth = input.int(defval=1, title='Start Month', minval=1, maxval=12)
startDay = input.int(defval=1, title='Start Day', minval=1, maxval=31)
endYear = input.int(defval=2023, title='End Year', minval=2000 ,maxval=3000)
endMonth = input.int(defval=12, title='End Month', minval=1, maxval=12)
endDay = input.int(defval=31, title='End Day', minval=1, maxval=31)

start = timestamp(startYear, startMonth, startDay, 00, 00)
end = timestamp(endYear, endMonth, endDay, 23, 59)
period() => time >= start and time <= end ? true : false

if buy2
    strategy.entry("Enter Long", strategy.long)
else if sell2
    strategy.entry("Enter Short", strategy.short)
관련
- 연속 MACD 금색과 죽음의 십자가에 기초한 거래 전략
- 향상된 볼링거 밴드 RSI 거래 전략
- 트리플 EMA 크로스오버 전략
- 기하급수적인 이동평균 크로스오버 레버리지 전략
- GM-8 & ADX 이중 이동 평균 전략
- RSI/MACD/ATR과 함께 강화된 EMA 크로스오버 전략
- Z-Score 트렌드 전략
- EMA의 긴 입장은 위험 관리 전략과 교차합니다
- VWAP 거래 전략
- 웨이브 트렌드 크로스 레이지 베어 전략
- AlphaTradingBot 거래 전략
더 많은