이동 평균 크로스 알림, 다중 시간 프레임 (MTF)
저자:차오장, 날짜: 2022-05-24 11:23:02태그:SMAEMAWMA
두 개의 이동 평균이 교차할 때 확인합니다.
SMA = 단순한 이동 평균 EMA = 기하급수적인 이동 평균 (디폴트) WMA = 가중화 이동 평균 선형 = 선형 회귀
이동 평균은 HL2, HLC3 또는 OHLC4를 가격 소스로 사용하여 주간 또는 4 시간 시간 프레임과 같은 다른 시간 프레임에서 그래프화 할 수 있습니다. 또한 가격이 상승하거나 하락 할 때 이동 평균이 서로 교차 할 때 배경 색상 알림과 화살표가 있습니다. 그리고 이동 평균은 트렌드 방향 (상향 또는 하향) 에 따라 색깔이 있습니다.
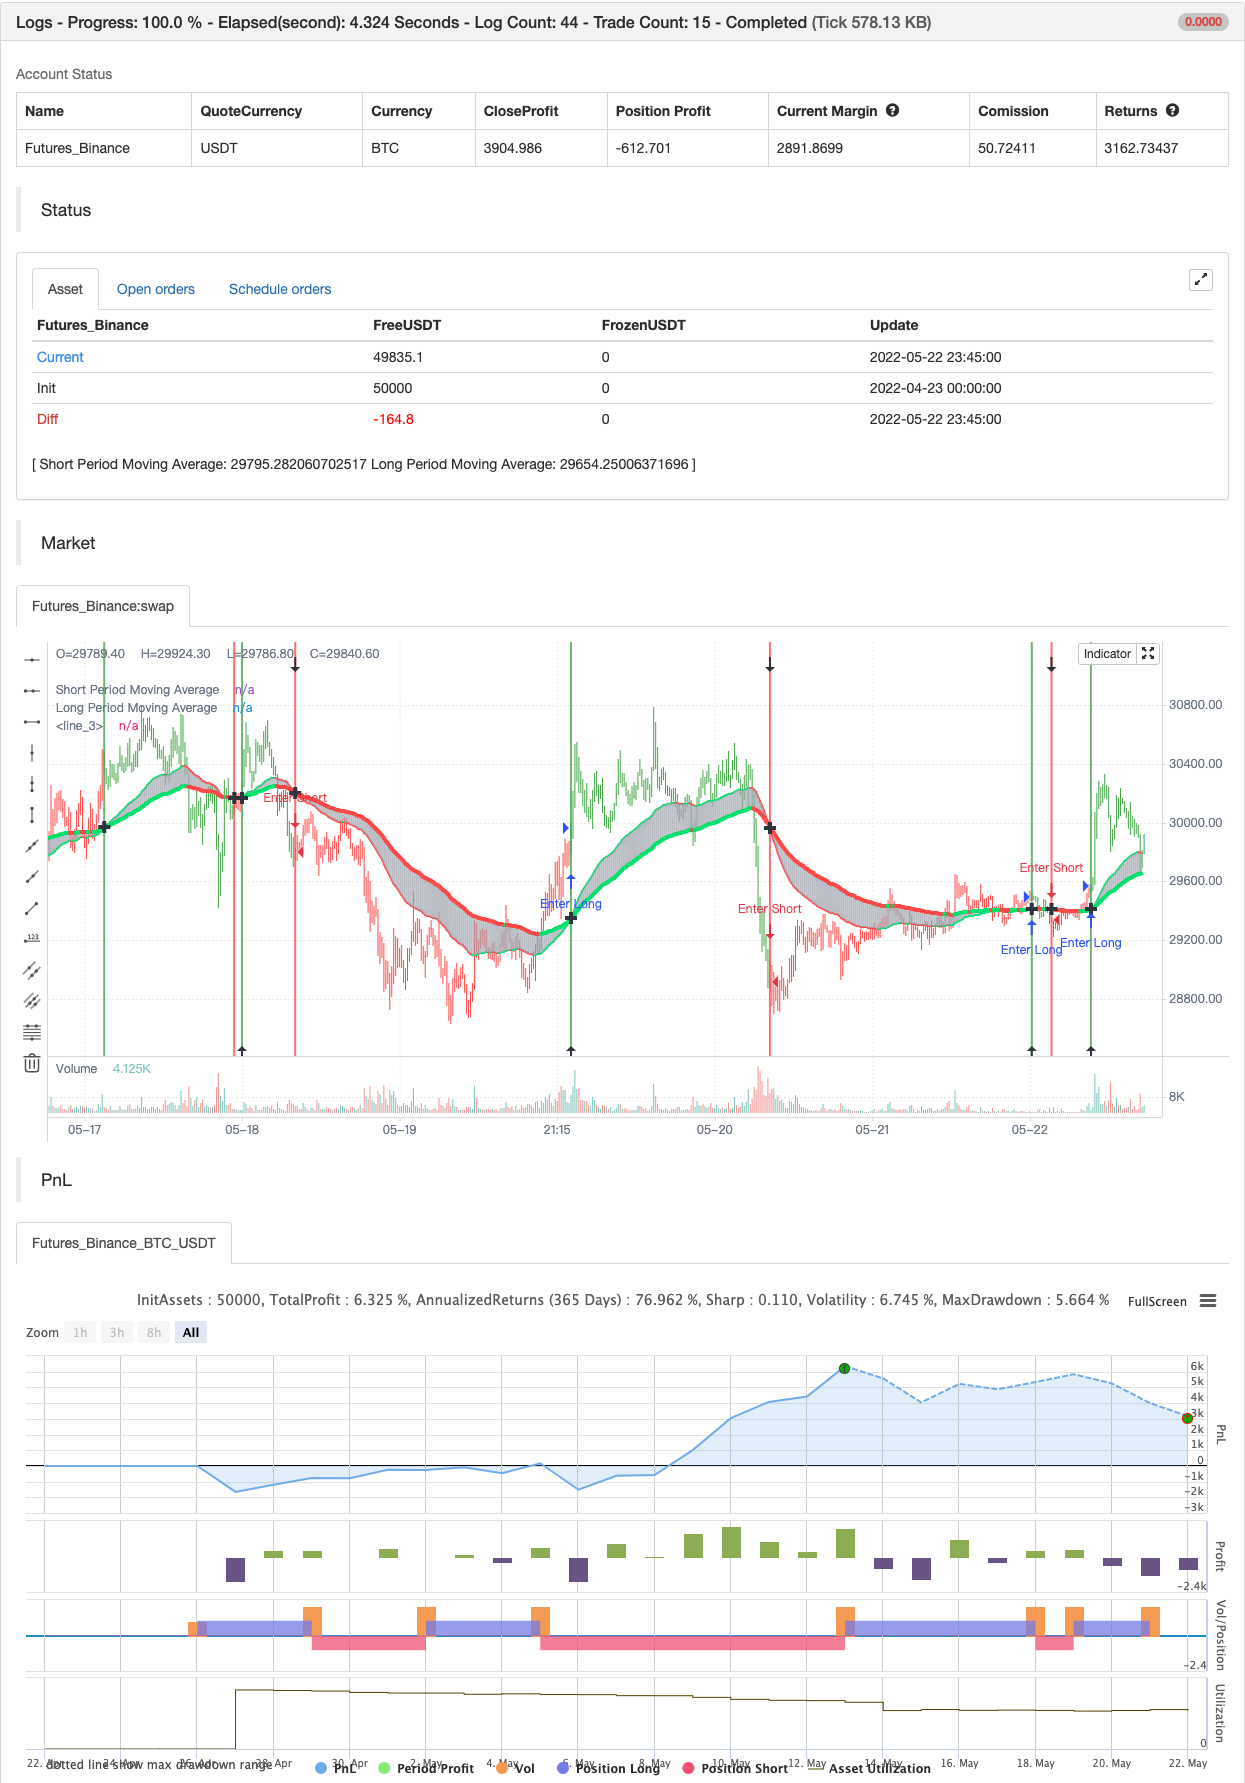
백테스트
/*backtest
start: 2022-04-23 00:00:00
end: 2022-05-22 23:59:00
period: 15m
basePeriod: 5m
exchanges: [{"eid":"Futures_Binance","currency":"BTC_USDT"}]
*/

study("Moving Average Cross Alert, Multi-Timeframe Option (MTF) (by ChartArt)", shorttitle="CA_-_MA_cross", overlay=true)

// ChartArt's Moving Average Cross Indicator
//
// Version 1.0
// Idea by ChartArt on September 15, 2015.
//
// This indicator shows when two moving averages cross.
// With the option to choose between four moving
// average calculations:
// (SMA = simple moving average)
// (EMA = exponential moving average)
// (WMA = weighted moving average)
// (Linear = Linear regression)
//
// The moving averages can be plotted from different
// timeframes, like the weekly or 4 hour timeframe.
// With the possibility to use HL2, HLC3 or OHLC4 prices.
//
// In addition there is a background color alert
// and arrows when the moving averages cross each other.
// And the moving averages are colored depending if
// they are trending up or down.
//
// List of my work:
// https://www.tradingview.com/u/ChartArt/

//@version=4
// Multi-timeframe and price input
pricetype = input(close, title="Price Source For The Moving Averages")
useCurrentRes = input(true, title="Use Current Timeframe As Resolution?")
resCustom = input(title="Use Different Timeframe? Then Uncheck The Box Above", defval="W")
res = useCurrentRes ? timeframe.period : resCustom
price = security(syminfo.tickerid, res, pricetype)

// MA period input
shortperiod = input(50, title="Short Period Moving Average")
longperiod = input(100, title="Long Period Moving Average")

// MA calculation
smoothinput = input(2, minval=1, maxval=4, title='Moving Average Calculation: (1 = SMA), (2 = EMA), (3 = WMA), (4 = Linear)')
short = smoothinput == 1 ? sma(price, shortperiod) :
   smoothinput == 2 ? ema(price, shortperiod) :
   smoothinput == 3 ? wma(price, shortperiod) :
   smoothinput == 4 ? linreg(price, shortperiod,0) :
   na
long = smoothinput == 1 ? sma(price, longperiod) :
   smoothinput == 2 ? ema(price, longperiod) :
   smoothinput == 3 ? wma(price, longperiod) :
   smoothinput == 4 ? linreg(price, longperiod,0) :
   na

// MA trend direction color
shortcolor = short > short[1] ? lime : short < short[1] ? red : blue
longcolor = long > long[1] ? lime : long < long[1] ? red : blue

// MA output
MA1 = plot(short, title="Short Period Moving Average", style=linebr, linewidth=2, color=shortcolor)
MA2 = plot(long, title="Long Period Moving Average", style=linebr, linewidth=4, color=longcolor)
fill(MA1, MA2, color=silver, transp=50)

// MA trend bar color
TrendingUp() => short > long
TrendingDown() => short < long
barcolor(TrendingUp() ? green : TrendingDown() ? red : blue)

// MA cross alert
MAcrossing = cross(short, long) ? short : na
plot(MAcrossing, style = cross, linewidth = 4,color=black)

// MA cross background color alert
Uptrend() => TrendingUp() and TrendingDown()[1]
Downtrend() => TrendingDown() and TrendingUp()[1]
bgcolor(Uptrend() ? green : Downtrend() ? red : na,transp=50)

// Buy and sell alert
Buy = Uptrend() and close > close[1]
Sell = Downtrend() and close < close[1]
plotshape(Buy, color=black, style=shape.arrowup, text="Buy", location=location.bottom)
plotshape(Sell, color=black, style=shape.arrowdown, text="Sell", location=location.top)


if Buy
    strategy.entry("Enter Long", strategy.long)
else if Sell
    strategy.entry("Enter Short", strategy.short)
관련
- RedK 부피 가속 방향 에너지 비율
- 이동 평균과 볼린거 대역에 기초한 양적 거래 전략
- 에너지 바와 함께 레드K 듀얼 바더
- HALFTREND + HEMA + SMA (거짓 신호의 전략)
- 레인보우 오시레이터
- 레드K 모멘텀 바
- 슈퍼 스칼퍼
- ESSMA
- 슈퍼 점프 턴 백 볼링거 밴드
- 더 똑똑한 MACD
더 많은
- 삼각수당 (작은 통화의 거래 가격 차이)
- bybit 역계약 동적 격자 (特異格子)
- MT4 MT5 + 동적 변수 NOT-REPAINT
- 매트릭스 시리즈
- 슈퍼 스칼퍼 - 5분 15분
- 상대적 강도 지수 - 격차 - 자유
- 선형 회귀 ++
- 에너지 바와 함께 레드K 듀얼 바더
- 통합 구역 - 라이브
- 양적 질적 평가
- MACD 재충전 전략
- 슈퍼트렌드 이동 평균
- 거래 ABC
- 15MIN BTCUSDTPERP BOT
논 엔트로피 V2 - 수퍼트렌드 ATR TRAILING STOP LOSS
- 부피 흐름 v3
- ma & rsi - ogcheckers와 함께 암호화 선물 시간 스칼핑
- ATR 평평화
- 주문 블록 검색어