스칼핑 스윙 거래 도구 R1-4
저자:차오장, 날짜: 2022-05-25 15:58:26태그:EMAPAC
설명:
이 연구 프로젝트는
이 도구에는 다음의 지표가 포함됩니다.
- 다음의 EMA는 자동으로 유치됩니다. 녹색 = EMA89 (15min TF) = EMA75 (1min TF) 파란색 = EMA200 (15min TF) = EMA180 (1min TF) 검은색 = EMA633 (15min TF) = EMA540 (1min TF)
- 10EMA (전산) 높은/저하 + 가까운 가격 행동 채널 (PAC), PAC 채널 디스플레이가 기본적으로 비활성화되어 있습니다.
- 선택적으로 프랙탈 및 선택적 프랙탈 레벨을 표시
- 선택적으로 HH, LH, LL, HL 탐색기
- 색상 코딩된 바 높은 조명 PAC를 기반으로: 파란색 = PAC 위에 닫힌 바 빨간색 = PAC 아래로 닫힌 바 회색 = PAC 내부에 닫힌 바 라임 라인 = 바 클로즈의 EMA10
- 피보트 포인트 (선택되면 프랙탈을 자동으로 비활성화) 는 선택적 라벨이 있습니다.
- EMA5-12 채널은 기본적으로 표시됩니다.
- EMA12-36 리본은 기본적으로 표시됩니다.
- 선택적으로 EMA12-36 리본 대신 EMA36와 PAC를 표시합니다.
설정 및 팁: 나는 여기에 완전한 설명을 제공 할 수 없습니다, 풀백 트레이딩은 완전한 거래 방법론을 포함하고 있기 때문에, 그 주제에 대한 여러 기사와 책이 있습니다.
두 개의 패널로 설정 트레이딩 뷰 차트, 첫 번째 패널을 15분, 두 번째 패널을 1분으로 설정.
차트를 하이킨 아시 촛불로 설정하세요 (선택)
저는 또한 차트에
백테스트
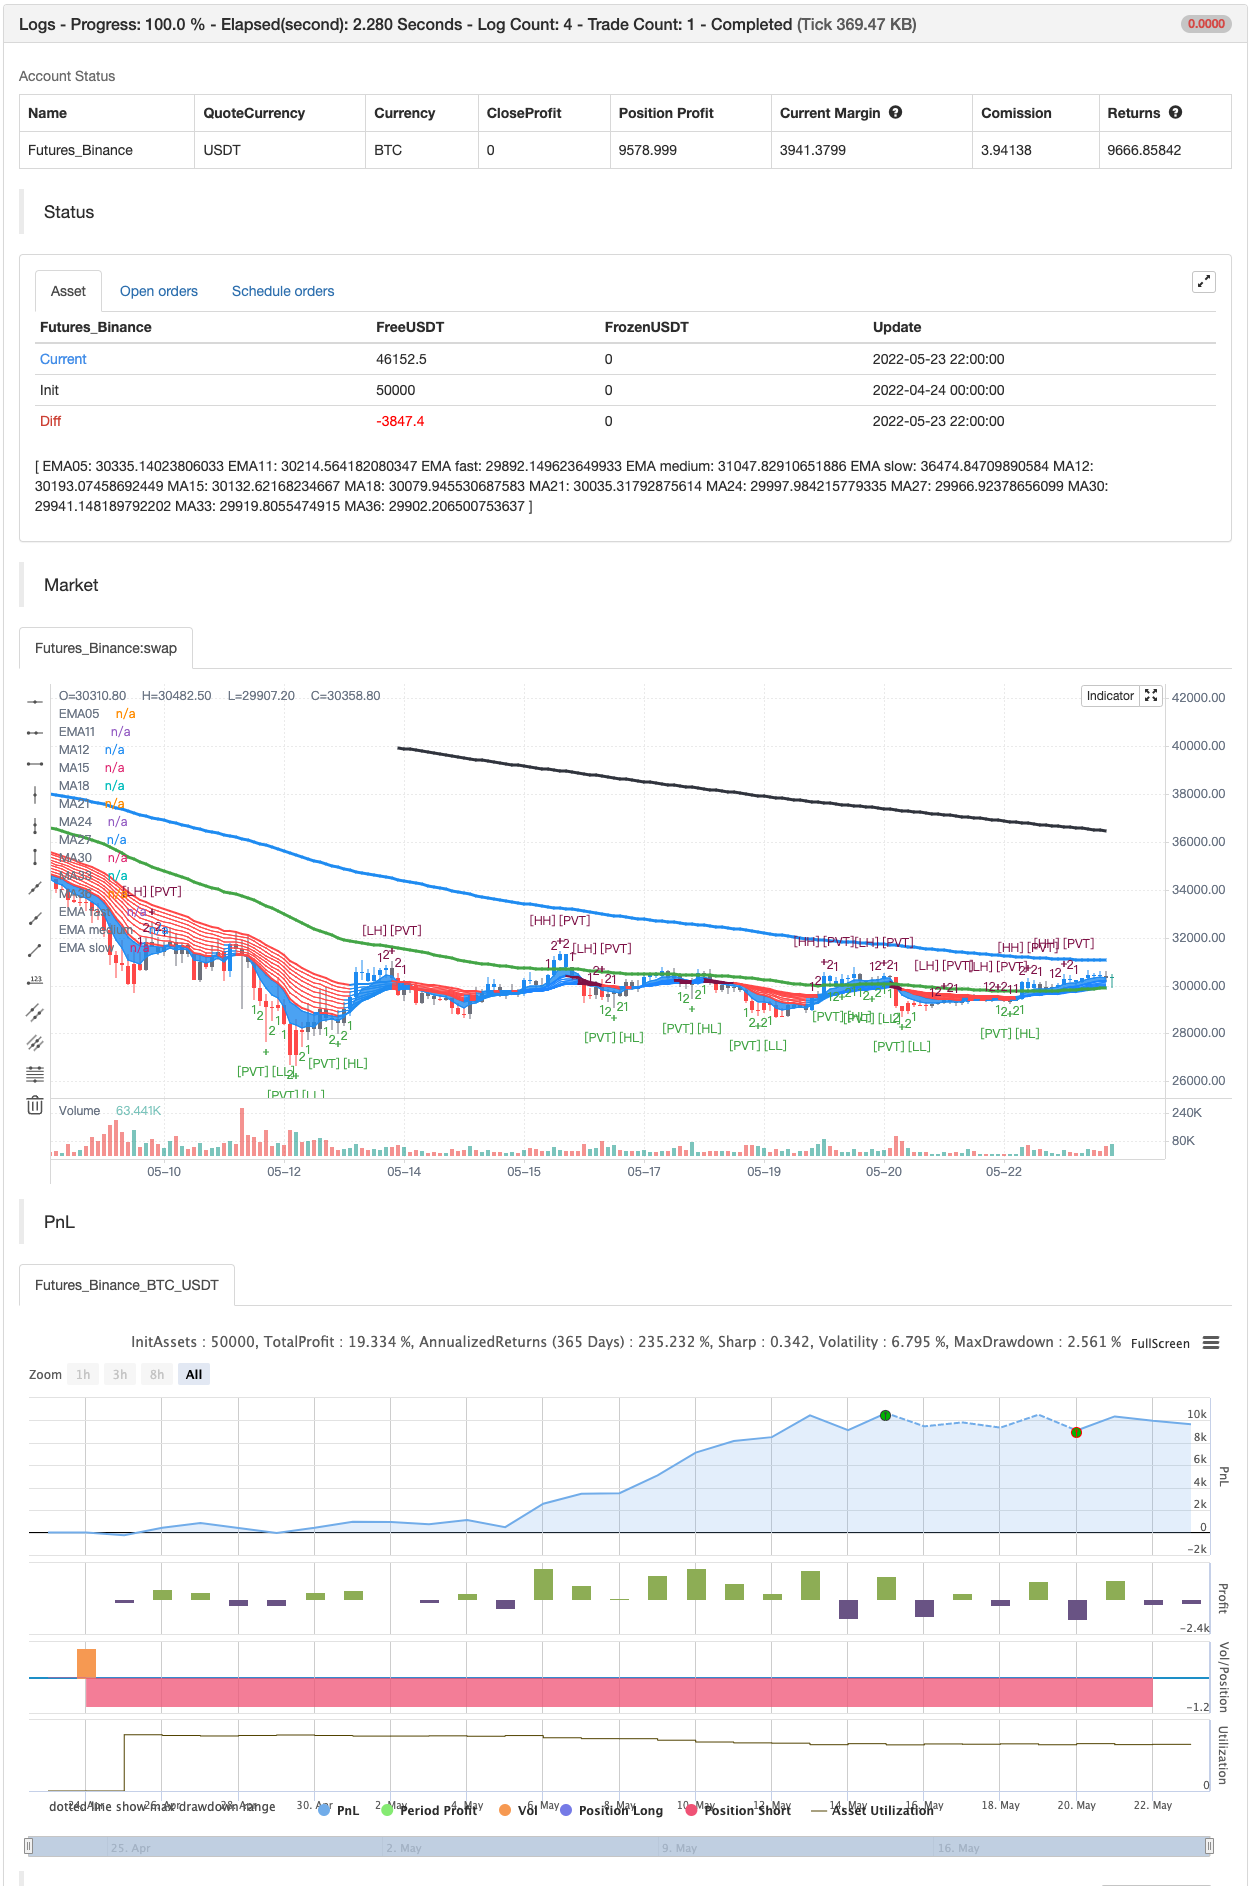
/*backtest
start: 2022-04-24 00:00:00
end: 2022-05-23 23:59:00
period: 2h
basePeriod: 15m
exchanges: [{"eid":"Futures_Binance","currency":"BTC_USDT"}]
*/

//@version=3
//

study(title = "Scalping Swing Trading Tool R1-6 by JustUncleL", shorttitle = "SCALPSWING R1-6", overlay = true)

//
// Revision:        1
// Original Author: JustUncleL
//
// Description:
//    This study project is a Scalping Swing trading Tool designed for a two pane TradingView chart layout:
//    - the first pane set to 15min Time Frame;
//    - the second pane set to 1min Time Frame(TF).
//    The tools incorporates the majority of the indicators needed to analyse and scalp Trends for Swings,
//    PullBacks and reversals on 15min charts and 1min charts. The set up optionally utilies Heikin Ashi
//    candle charts.
//
//    NOTE: A Pullback is synomous to Retracement, generally a Pullback refers to a large Retracement of 100pips
//    or more. In the context of this Tool and any comments related to it, a Pullback will be the
//    same as a Retracement.
//
//    Incorporated within this tool are the following indicators:
//    1. The following EMAs:
//       - Green = EMA89  (15min TF) = EMA75  (1min TF)
//       - Blue  = EMA200 (15min TF) = EMA180 (1min TF)
//       - Black = EMA633 (15min TF) = EMA540 (1min TF)
//    2. The 10EMA (default) High/Low+Close Price Action Channel (PAC).
//    3. Fractals
//    4. HH, LH, LL, HL finder to help with drawing Trend lines and mini Trend Lines.
//    5. Coloured coded Bar high lighting based on the PAC:
//       - blue = bar closed  above PAC
//       - red  = bar closed below PAC
//       - gray = bar closed inside PAC
//       - red line = EMA36 of bar close
//    6. Optionally display Pivot points (disables Fractals automatically when selected).
//    7. Display EMA5-12 Channel
//    8. Display EMA12-36 Ribbon
//    9. Optionally display EMA36 and PAC instead of EMA12-36 Ribbon.
//
// Setup and hints:
//
//  - Set to two pane TradingView chart, set first pane to 15Min and second to 1min.
//  - Set the chart to Heikin Ashi Candles in both panes (optional).
//  - I also add "Sweetspot Gold2" indicator to the chart as well to help with support and resistance
//    finding and shows where the important "00" and "0" lines are.
//  - Use the EMA200 on the 15min pane as the anchor. So when prices above EMA200 we only trade long (buy)
//    and when prices below the EMA200 we only trade short (sell).
//  - On the 15min chart draw any obvious Vertical Trend Lines (VTL), use Pivots point as a guide.
//  - On the 15min chart what we’re looking for price to Pullback into the EMA5-12 Channel or EMA12-36 ribbon
//    we Trendlines uitilising the Pivot points or Fractals to guide your TL drawing.
//  - On the 15min chart look for the trend to resume and break through the drawn TL. The bar color needs to
//    change back to the trend direction colour to confirm as a break.
//  - Now this break can be traded as a 15min trade or now look to the 1min chart.
//  - On the 1min chart draw any Pullback into any of the EMAs.
//  - On the 1min chart look for the trend to resume and break through the drawn TL. The bar color needs to
//    change back to the trend direction colour to confirm as a break.
//  - Now this break can be traded as a 1min trade.
//  - So we are looking for continuation signals in terms of a strong, momentumdriven pullbacks of the EMA36.
//  - The other EMAs are there to check for other Pullbacks when EMA36 is broken.
//  - There is also an option to select Pristine (ie Ideal) filtered Fractals, which look like tents or V shape
//    5-candle patterns. These are actually used to calculate the Pivot points as well.
//  - Other than the SweetSpot Gold2 indicator, you should not need any other indicator to scalp
//    for pullbacks.
//
// Revisions:
//  R1 by JustUncleL
//  - Original version.
//
//  R1-6 23-June-2019
//  - Updated to version 3 of Pinescript
//  - Added optional PAC swing alerts, with optional 200ema filter (PAC has to above/below 200ema)
//  - Added alarms for swing arrows
//  - Removed security calls for sources, problematic
//
//
// References:
//  - [RS]Fractals V8 by RicardoSantos
//  - Price Action Trading System v0.3 by JustUncleL
//  - SweetSpot Gold2 R1 by JustUncleL
//  - http://www.swing-trade-stocks.com/pullbacks.html
//  - https://www.forexstrategiesresources.com/scalping-forex-strategies/106-1-min-scalping-with-34-exponential-moving-average-channel/
//

// === INPUTS ===
ShowPAC_    = input(true, title="Show Price Action Channel (PAC)")
scolor      = input(true, title="Show coloured Bars close relative on PAC")
HiLoLen     = input(10,minval=2,title="High Low PAC Length")
ShowPACexit = input(false, title="Show PAC Swing Alerts")
UseBigArrows = input(false, title="Use Big Arrows for Swing Alerts")
filterEMA200 = input(true,  title="Filter PAC Alerts with 200ema")
ShowEMA12_Channel= input(true)
ShowEMA36_Ribbon = input(true)
ShowPAC = HiLoLen>30 ? ShowEMA36_Ribbon? false: ShowPAC_: ShowEMA12_Channel? false : ShowPAC_
ShowPivots  = input(true)
ShowPivotLabels = input(true)
// Disable Fractal drawing if Pivots enabled
ShowHHLL_   = input(false)
ShowHHLL    = ShowPivots?false:ShowHHLL_
ShowFractals_= input(true)
ShowFractals = ShowPivots?false:ShowFractals_
ShowFractalLevels =input(false)
//ShowFractalLevels = ShowPivots?false:ShowFractalLevels_
filterBW_   = input(false, title="Filter for Pristine (Ideal) Fractals")
// Need Williams Filter for Pivots.
filterBW    = ShowPivots?true:filterBW_

// --- CONSTANTS ---
DodgerBlue  = #1E90FF
//
// --- SOURCES ---
close_ = close //security(ticker, period, close,  barmerge.gaps_off, barmerge.lookahead_on)
open_ = open //security(ticker, period, open, barmerge.gaps_off, barmerge.lookahead_on)
high_ = high //security(ticker, period, high, barmerge.gaps_off, barmerge.lookahead_on)
low_ = low //security(ticker, period, low, barmerge.gaps_off, barmerge.lookahead_on)

exitClose = close_ //UseHAexit ? security(heikinashi(tickerid), period, close) : close_
exitOpen  = open_ //UseHAexit ? security(heikinashi(tickerid), period, open)  : open_

//
// === /INPUTS ===

//  ||---   Fractal Recognition Functions:  ---------------------------------------------------------------||
isRegularFractal(mode) =>
    ret = mode == 1 ? high_[5] < high_[4] and high_[4] < high_[3] and high_[3] > high_[2] and high_[2] > high_[1] :
          mode == -1 ? low_[5] > low_[4] and low_[4] > low_[3] and low_[3] < low_[2] and low_[2] < low_[1] : false

isBWFractal(mode) =>
    ret = mode == 1 ? high_[5] < high_[3] and high_[4] < high_[3] and high_[3] > high_[2] and high_[3] > high_[1] :
          mode == -1 ? low_[5] > low_[3] and low_[4] > low_[3] and low_[3] < low_[2] and low_[3] < low_[1] : false
//  ||-----------------------------------------------------------------------------------------------------||

// MA Colour finder for EMA Ribbon plot.
maColor(maBase, ma, maRef) =>
      change(ma)>=0 and maBase>maRef ? DodgerBlue
     :change(ma)<0 and maBase>maRef ? maroon
     :change(ma)<=0 and maBase<maRef ? red
     :change(ma)>=0 and maBase<maRef ? blue
     :gray

// === /FUNCTIONS ===

// === SERIES SETUP ===

// Price action channel
pacC        = ema(close_,HiLoLen)
pacL        = ema(low_,HiLoLen)
pacU        = ema(high_,HiLoLen)

// All other EMAs
EMA05       = ema(close_, 05)
EMA11       = ema(close_, 11)
EMA12       = ema(close_, 12)
EMA15       = ema(close_, 15)
EMA18       = ema(close_, 18)
EMA21       = ema(close_, 21)
EMA24       = ema(close_, 24)
EMA27       = ema(close_, 27)
EMA30       = ema(close_, 30)
EMA33       = ema(close_, 33)
EMA36       = ema(close_, 36)
EMA75       = ema(close_, 75)
EMA89       = ema(close_, 89)
EMA180      = ema(close_, 180)
EMA200      = ema(close_, 200)
EMA540      = ema(close_, 540)
EMA633      = ema(close_, 633)

// === /SERIES ===

// === PLOTTING ===
//
// If selected, Plot the Price Action Channel (PAC) base on EMA high,low and close
L=plot(ShowPAC ?pacL:na, color=gray, linewidth=1, title="High PAC EMA",transp=50)
U=plot(ShowPAC ?pacU:na, color=gray, linewidth=1, title="Low PAC EMA",transp=50)
C=plot(ShowPAC ?pacC:na, color=lime, linewidth=1, title="Close PAC EMA",transp=0)
fill(L,U, color=gray,transp=92,title="Fill HiLo PAC")

// Colour bars according to the close position relative to the PAC selected.
bColour     = close>=pacU? blue : close<=pacL? red : gray
barcolor(scolor?bColour:na, title = "Bar Colours")

// Draw the EMA12 ribbon
ema05=plot(ShowEMA12_Channel?EMA05:na,  color=blue,linewidth=1,transp=92,title="EMA05")
ema11=plot(ShowEMA12_Channel?EMA11:na,  color=blue,linewidth=1,transp=92,title="EMA11")
fill(ema05,ema11, color=blue,transp=92,title="Fill EMA5-12")
//
// If this is the 1min Time Frame select 15* EMAs
emaFast   = timeframe.isintraday?  EMA75  : EMA89
emaMedium = timeframe.isintraday?  EMA180 : EMA200
emaSlow   = timeframe.isintraday?  EMA540 : EMA633

plot(emaFast,  color=green,linewidth=3,transp=20,title="EMA fast")
plot(emaMedium, color=blue,linewidth=3,transp=20,title="EMA medium")
plot(emaSlow, color=black,linewidth=3,transp=20,title="EMA slow")

// Draw the EMA36 ribbon
plot( ShowEMA36_Ribbon?EMA12:na, color=maColor(EMA12,EMA12,EMA36), style=line, title="MA12", linewidth=2,transp=20)
plot( ShowEMA36_Ribbon?EMA15:na, color=maColor(EMA12,EMA15,EMA36), style=line, title="MA15", linewidth=1,transp=20)
plot( ShowEMA36_Ribbon?EMA18:na, color=maColor(EMA12,EMA18,EMA36), style=line, title="MA18", linewidth=1,transp=20)
plot( ShowEMA36_Ribbon?EMA21:na, color=maColor(EMA12,EMA21,EMA36), style=line, title="MA21", linewidth=1,transp=20)
plot( ShowEMA36_Ribbon?EMA24:na, color=maColor(EMA12,EMA24,EMA36), style=line, title="MA24", linewidth=1,transp=20)
plot( ShowEMA36_Ribbon?EMA27:na, color=maColor(EMA12,EMA27,EMA36), style=line, title="MA27", linewidth=1,transp=20)
plot( ShowEMA36_Ribbon?EMA30:na, color=maColor(EMA12,EMA30,EMA36), style=line, title="MA30", linewidth=1,transp=20)
plot( ShowEMA36_Ribbon?EMA33:na, color=maColor(EMA12,EMA33,EMA36), style=line, title="MA33", linewidth=1,transp=20)
plot( EMA36, color=ShowEMA36_Ribbon?maColor(EMA12,EMA36,EMA36):red, style=line, title="MA36", linewidth=2,transp=20)
// === /SERIES ===

// === PLOTTING ===


//  ||---   Fractal Recognition:
//  ||-----------------------------------------------------------------------------------------------------||
filteredtopf = filterBW ? isRegularFractal(1) : isBWFractal(1)
filteredbotf = filterBW ? isRegularFractal(-1) : isBWFractal(-1)

plotshape(ShowFractals? filteredtopf :na, title='Filtered Top Fractals', style=shape.triangledown, location=location.abovebar, color=red, offset=-3,transp=0)
plotshape(ShowFractals? filteredbotf :na, title='Filtered Bottom Fractals', style=shape.triangleup, location=location.belowbar, color=lime, offset=-3,transp=0)

topfractals = na
botfractals = na
topfractals := filteredtopf ? high_[3] : topfractals[1]
botfractals := filteredbotf ? low_[3] : botfractals[1]

topfcolor = na
botfcolor = na
topfcolor := topfractals != topfractals[1] ? na : green
botfcolor := botfractals != botfractals[1] ? na : red

plot(ShowFractalLevels? topfractals : na, color=topfcolor, transp=0, linewidth=2)
plot(ShowFractalLevels? botfractals : na, color=botfcolor, transp=0, linewidth=2)


//  ||-----------------------------------------------------------------------------------------------------||
//  ||---   Higher Highs, Lower Highs, Higher Lows, Lower Lows  -------------------------------------------||
higherhigh = filteredtopf == false ? false : ( valuewhen(filteredtopf == true, high_[3], 1) < valuewhen(filteredtopf == true, high_[3], 0) and
                                               (ShowPivots or valuewhen(filteredtopf == true, high_[3], 2) < valuewhen(filteredtopf == true, high_[3], 0)))
lowerhigh = filteredtopf == false ? false : ( valuewhen(filteredtopf == true, high_[3], 1) > valuewhen(filteredtopf == true, high_[3], 0)  and
                                              (ShowPivots or valuewhen(filteredtopf == true, high_[3], 2) > valuewhen(filteredtopf == true, high_[3], 0)))
higherlow = filteredbotf == false ? false : ( valuewhen(filteredbotf == true, low_[3], 1) < valuewhen(filteredbotf == true, low_[3], 0) and
                                              (ShowPivots or valuewhen(filteredbotf == true, low_[3], 2) < valuewhen(filteredbotf == true, low_[3], 0)))
lowerlow = filteredbotf == false ? false : ( valuewhen(filteredbotf == true, low_[3], 1) > valuewhen(filteredbotf == true, low_[3], 0) and
                                              (ShowPivots or valuewhen(filteredbotf == true, low_[3], 2) > valuewhen(filteredbotf == true, low_[3], 0)))

// If selected show HH/LL on top/below candles.
plotshape(ShowHHLL ? higherhigh : na, title='HH', style=shape.square, location=location.abovebar, color=maroon, text="[HH]", offset=-3,transp=0)
plotshape(ShowHHLL ? lowerhigh : na, title='LH', style=shape.square, location=location.abovebar, color=maroon, text="[LH]", offset=-3,transp=0)
plotshape(ShowHHLL ? higherlow : na, title='HL', style=shape.square, location=location.belowbar, color=green, text="[HL]", offset=-3,transp=0)
plotshape(ShowHHLL ? lowerlow : na, title='LL', style=shape.square, location=location.belowbar, color=green, text="[LL]", offset=-3,transp=0)

// If selected display Pivot points
plotshape(ShowPivots and ShowPivotLabels? higherhigh : na, title='Higher High', style=shape.cross, location=location.abovebar, color=maroon, text="[HH]\n[PVT]", offset=-3,transp=0)
plotshape(ShowPivots and not ShowPivotLabels? higherhigh : na, title='Higher High+', style=shape.cross, location=location.abovebar, color=maroon, offset=-3,transp=0)
//
plotshape(ShowPivots  and ShowPivotLabels? lowerhigh : na, title='Lower High', style=shape.cross, location=location.abovebar, color=maroon, text="[LH]\n[PVT]", offset=-3,transp=0)
plotshape(ShowPivots  and not ShowPivotLabels? lowerhigh : na, title='Lower High+', style=shape.cross, location=location.abovebar, color=maroon, offset=-3,transp=0)
//
plotshape(ShowPivots  and ShowPivotLabels? higherlow : na, title='Higher Low', style=shape.cross, location=location.belowbar, color=green, text="[PVT]\n[HL]", offset=-3,transp=0)
plotshape(ShowPivots  and not ShowPivotLabels? higherlow : na, title='Higher Low+', style=shape.cross, location=location.belowbar, color=green, offset=-3,transp=0)
//
plotshape(ShowPivots  and ShowPivotLabels? lowerlow : na, title='Lower Low', style=shape.cross, location=location.belowbar, color=green, text="[PVT]\n[LL]", offset=-3,transp=0)
plotshape(ShowPivots  and not ShowPivotLabels? lowerlow : na, title='Lower Low+', style=shape.cross, location=location.belowbar, color=green, offset=-3,transp=0)
//
// Number candles on Pivot patterns.
plotchar(ShowPivots ? filteredtopf: na, title='High 1u', location=location.abovebar, color=maroon, char="1", offset=-5,transp=0)
plotchar(ShowPivots ? filteredtopf: na, title='High 2u', location=location.abovebar, color=maroon, char="2", offset=-4,transp=0)
plotchar(ShowPivots ? filteredtopf: na, title='High 2d', location=location.abovebar, color=maroon, char="2", offset=-2,transp=0)
plotchar(ShowPivots ? filteredtopf: na, title='High 1d', location=location.abovebar, color=maroon, char="1", offset=-1,transp=0)
//
plotchar(ShowPivots ? filteredbotf: na, title='Low 1d', location=location.belowbar, color=green, char="1", offset=-5,transp=0)
plotchar(ShowPivots ? filteredbotf: na, title='Low 2d', location=location.belowbar, color=green, char="2", offset=-4,transp=0)
plotchar(ShowPivots ? filteredbotf: na, title='Low 2u', location=location.belowbar, color=green, char="2", offset=-2,transp=0)
plotchar(ShowPivots ? filteredbotf: na, title='Low 1u', location=location.belowbar, color=green, char="1", offset=-1,transp=0)


// === /PLOTTING ===

// === ALERTS ===

// Check for 1st Heikin Ashi Bar exit the PAC
isup =    exitClose>exitOpen and exitClose>pacU and exitClose[1]<pacU[1] and (not filterEMA200 or pacC>emaMedium)
isdown =  exitClose<exitOpen and exitClose<pacL and exitClose[1]>pacL[1] and (not filterEMA200 or pacC<emaMedium)

// Check have alert
//up_alert = isup and (not filterEMA200 or (pacC>EMAmedm) ) ? na(up_alert[1]) ? 1 : up_alert[1]+1 : 0
//dn_alert = isdown and (not filterEMA200 or (pacC<EMAmedm) ) ? na(dn_alert[1]) ? 1 : dn_alert[1]+1 : 0
up_alert = 0
dn_alert = 0
up_alert := isup  ? na(up_alert[1]) ? 1 : up_alert[1]+1 : 0
dn_alert := isdown ? na(dn_alert[1]) ? 1 : dn_alert[1]+1 : 0
//
//plotarrow(ShowPACexit and UseBigArrows? up_alert[1]==1? 1 : dn_alert[1]==1? -1 : na : na, colorup=aqua, colordown=fuchsia, transp=20,minheight=10,maxheight=60, title="SCALPSWING Alert Arrows")
plotshape(ShowPACexit and not UseBigArrows? up_alert[1]==1? true : na : na, title='SCALPSWING Buy Arrow', location=location.belowbar, color=green,   style=shape.arrowup, text="BUY", textcolor=green,transp=0)
plotshape(ShowPACexit and not UseBigArrows? dn_alert[1]==1? true : na : na, title='SCALPSWING Sell Arrow', location=location.abovebar, color=red, style=shape.arrowdown, text="SELL",textcolor=red,transp=0)


// generate an alert if required.
alertcondition(up_alert==1, title="SCAPSWING alert Up", message="SWING_UP")
alertcondition(dn_alert==1, title="SCAPSWING alert Down", message="SWING_DN")

// === /ALERTS ===

// === eof

if isup
    strategy.entry("Enter Long", strategy.long)
else if isdown
    strategy.entry("Enter Short", strategy.short)
- Scalping PullBack 도구 R1
- 3EMA
- CM 스링 샷 시스템
- Strat를 구매/판매
- 스톡 슈퍼트르드 ATR 200ma
- 범주 필터 구매 및 판매 5분 [전략]
- 크로스 플레이
- 시드 보스
- 역동 망치 - 확장 옵션
- Z-Score 트렌드 전략
- 파라볼 SAR 구매 및 판매
- 피보트 기반 후속 최대 & 최소
- 닉 라이팍 후속 역전 (NRTR)
- ZigZag PA 전략 V4.1
- 내일 구매/판매
- 깨진 프랙탈: 누군가의 깨진 꿈은 당신의 이익입니다!
- 이윤 극대화 PMax
- 흠 이 없는 승리 전략
- 스토카스틱 + RSI, 이중 전략
- 스윙 헐/rsi/EMA 전략
- 가장 좋은 삼키기 + 탈출 전략
- Bollinger Awesome 알렛 R1
- 다중 거래소 통합 플러그인
- 삼각수당 (작은 통화의 거래 가격 차이)
- bybit 역계약 동적 격자 (特異格子)
- MT4 MT5 + 동적 변수 NOT-REPAINT
- 매트릭스 시리즈
- 슈퍼 스칼퍼 - 5분 15분
- 상대적 강도 지수 - 격차 - 자유
- 선형 회귀 ++