RSI와 이동평균을 기반으로 한 다중 시간 프레임 거래 전략

1
Follow
1781
Followers
개요
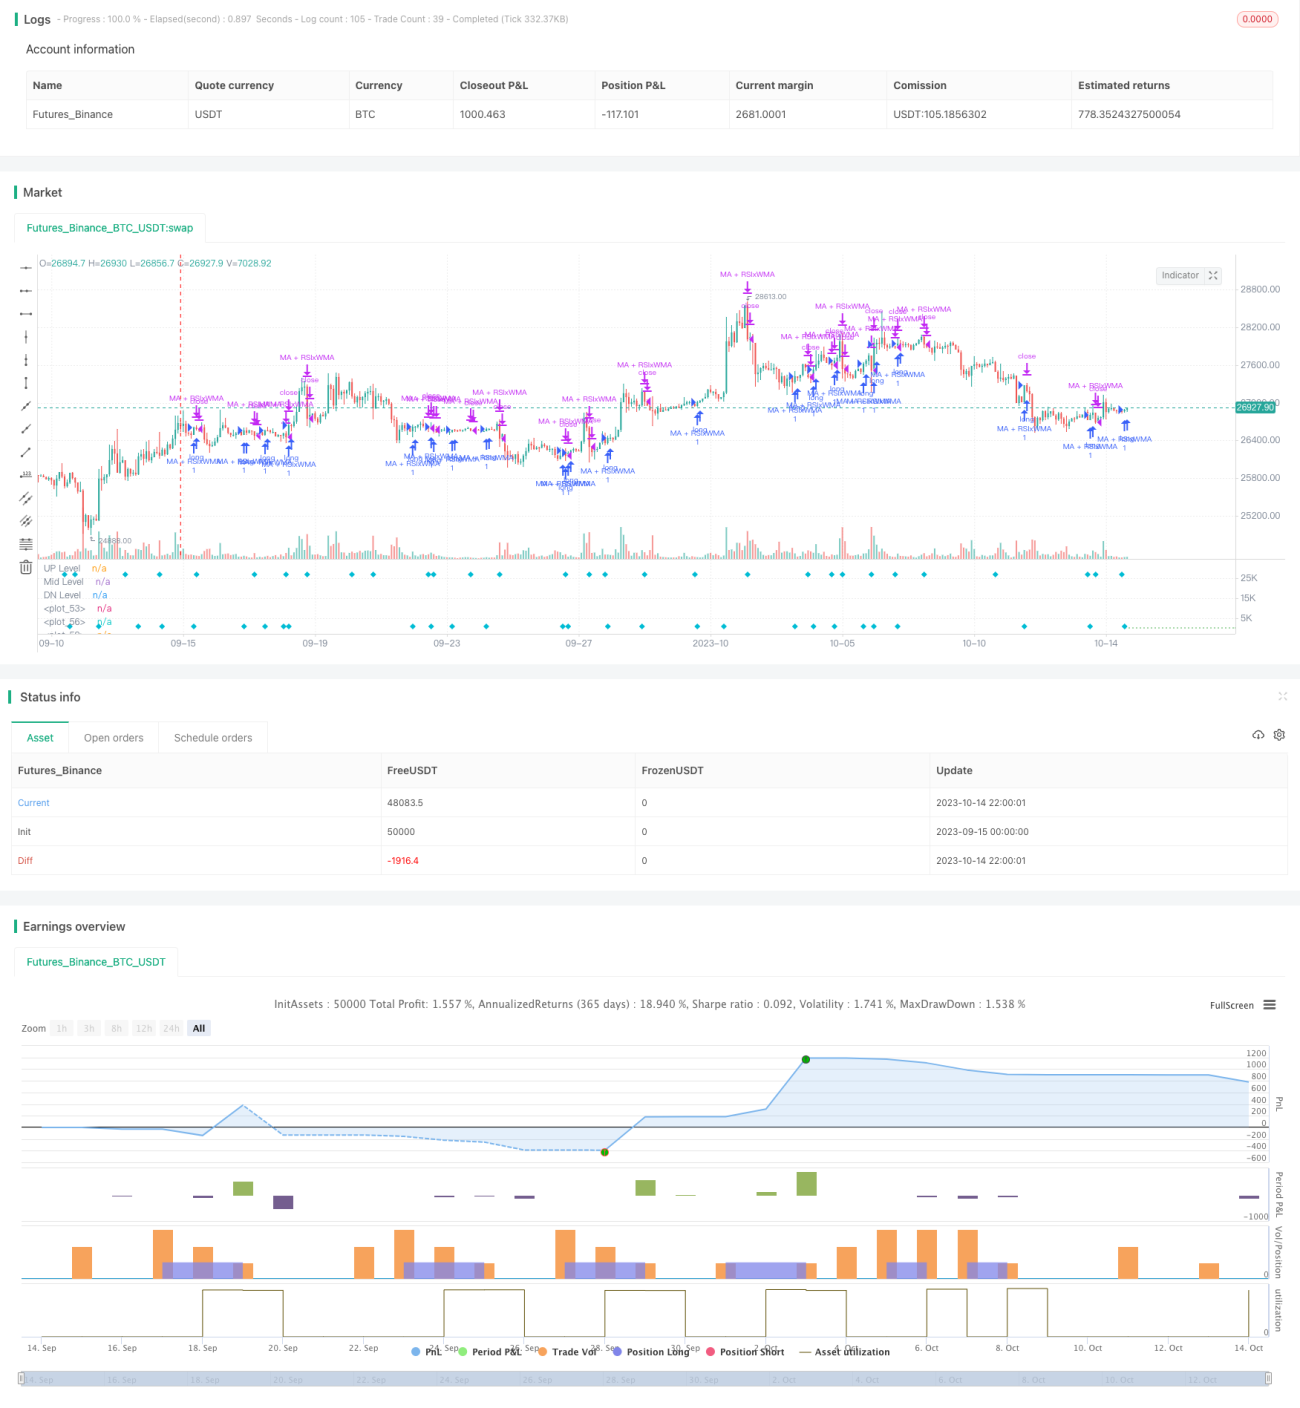
이 전략의 핵심 아이디어는 상대적으로 강한 지수 ((RSI) 와 다른 시간 주기의 이동 평균을 사용하여 동시 트렌드 역점을 식별하고 중·장선 트렌드를 동시에 잡기 위해 단선 거래를 하는 것입니다. 이 전략은 여러 가지 거래 신호를 통합하여 거래 성공률을 높이기 위해 고안되었습니다.
전략 원칙
- RSI 지표, 그리고 빠른 라인 EMA와 느린 라인 WMA 이동 평균을 계산한다.
- RSI 지표가 WMA 이동 평균을 돌파하면 구매/판매 신호가 발생한다.
- EMA 패스트 라인이 WMA 패스트 라인을 뚫을 때, 구매/판매 신호를 생성한다.
- RSI와 EMA가 동시에 WMA를 돌파하면 강력한 구매/판매 신호가 발생한다.
- 또한, 주전 신호를 강화할 수 있습니다.
- 손해 중지, 정지 조건을 설정하십시오.
이 전략은 여러 가지 기술 지표의 돌파 신호를 통합하여, 다양한 매개 변수 설정의 이동 평균을 사용하여 다양한 주기의 트렌드를 식별하여 전략의 신뢰성을 향상시킵니다. RSI 지표는 과매매 상태를 판단하고, EMA 단선은 단기 트렌드를 판단하고, WMA 느린 선은 중기 트렌드를 판단하고, 가격과 보조 평균의 돌파 검증 트렌드를 판단합니다. 여러 가지 신호의 통합은 전략의 효과를 향상시킵니다.
우위 분석
- RSI의 역동성을 활용하여, 오버 바이 오버 셀 영역에서 역동 기회를 잡을 수 있습니다.
- 이동 평균을 트렌드 필터로 사용하여 가짜 돌파구를 피하십시오.
- 여러 시간 주기를 결합하여, 장선 트렌드를 추적할 수 있고, 단선 기회를 잡을 수 있다.
- 다양한 지표 신호를 통합하여 거래 성공률을 높일 수 있습니다.
- 손해 차단 전략을 설정하여 위험을 능동적으로 제어할 수 있습니다.
위험 분석
- RSI 지표는 가짜 신호를 발생하기 쉽고, 이동 평균 필터링이 필요합니다.
- 대주기 추세 아래의 반발은 반전 거래 신호를 유발할 수 있으며, 신중하게 처리해야 한다.
- RSI 주기의 길이, 이동 평균 주기의 등과 같은 최적화 파라미터 설정이 필요합니다.
- 하지만, 정지점 설정은 조심해야 합니다.
위험은 변수 최적화, 엄격한 중지 손실 전략, 그리고 대주기 경향을 고려하는 방법과 같은 방법을 통해 감소시킬 수 있습니다.
최적화 방향
- RSI 파라미터를 최적화하여 최적의 주기의 길이를 찾습니다.
- 다른 종류의 이동 평균 조합을 테스트하십시오.
- ATR, 동적으로 조정되는 스톱 손실 스톱 포지션을 추가하십시오.
- 거래량 관리 모듈을 추가합니다.
- 기계 학습 기술을 사용하여 매개 변수 최적화 및 신호 품질 평가를 수행합니다.
요약하다
이 전략은 트렌드 추적과 극점 반전 거래 아이디어를 통합하고, 다중 시간 프레임 분석과 여러 지표의 통합 사용을 추가하여 거래 성공률을 높이는 것을 목표로합니다. 위험을 잘 제어하고, 파라미터 설정을 최적화하고, 적절한 시기에 대주기 트렌드가 거래에 미치는 영향을 고려하는 것이 중요합니다.
Source
Pine
Strategy parameters
Related strategies
Comment
All comments (0)
No data
- 1