추세 추종 최대 이동 평균 교차 전략

1
Follow
1781
Followers
개요
이 전략은 두 개의 다른 기간의 이동 평균의 교차를 사용하여 거래합니다. 이 전략은 트렌드 추적 유형 전략에 속합니다. 이 전략은 단기 및 장기 이동 평균의 교차 구매 신호와 판매 신호를 사용하여 트렌드 상황에서 거래합니다.
전략 원칙
이 전략은 9주기 단기 이동 평균 SMA와 50주기 장기 이동 평균 LMA를 사용한다. 단기 이동 평균이 아래에서 장기 이동 평균을 통과하면 구매 신호가 발생하며, 단기 이동 평균이 위에서 아래로 장기 이동 평균을 통과하면 판매 신호가 발생한다.
동시에, 전략은 RSI 지표가 트렌드 강도를 판단하는 것을 도입한다. RSI가 설정된 임계 (기본 55) 보다 크면 거래 신호가 생성된다. 이것은 RSI가 초매매 범위에 있을 때 잘못된 신호를 생성하는 것을 피할 수 있다.
전략 매 거래의 자본은 총 자본의 30%이며, 매번 하나의 주문만 할 수 있다. 0.1%의 거래 수수료를 고려한다.
우위 분석
- 이 전략은 이동 평균의 교차로 형성된 트렌드 신호를 활용하여 트렌드 상황을 효과적으로 추적할 수 있다.
- RSI를 도입하면 트렌드 강도를 판단할 수 있고, 트렌드가 막히면 잘못된 신호가 발생하지 않도록 할 수 있다.
- 기본 파라미터를 최적화하면 다양한 시장에서 안정적인 수익을 얻을 수 있다.
- 재정을 합리적으로 관리하고, 단독으로 큰 손실을 피하십시오.
위험 분석
- 이 전략은 시장이 충격적일 때 잘못된 신호를 내보이며 수익을 올릴 수 없습니다.
- 트렌드를 추적하는 전략은 명확한 트렌드가 없으면 수익을 얻을 수 없습니다.
- 잘못된 매개 변수 설정은 거래 빈도를 높여 거래 비용을 증가시킬 수 있습니다.
- 갑작스러운 사건의 영향을 고려하지 않고, 조기에 중단되지 않을 수 있습니다.
최적화 변수, 다른 지표의 조합으로 수익 기회를 판단, 엄격한 자금 관리, 손실을 설정하여 위험을 줄일 수 있습니다.
최적화 방향
- 다양한 이동 평균 조합을 테스트하여 최적의 변수를 찾을 수 있다.
- MACD 등과 같은 다른 지표의 추세를 판단할 수 있다.
- 동적 중지 손실을 설정하여 단독 손실을 제어 할 수 있습니다.
- 다른 시장에 따라 재원 관리 비율을 조정할 수 있습니다.
- 트렌드의 강점을 거래량 지표와 함께 판단할 수 있다.
요약하다
이 전략은 간단한 이동 평균 교차 시스템을 통해 트렌드 기회를 잡습니다. 기본 파라미터는 최적화되어 수익이 안정되어 자동 거래에 적합합니다. 다른 보조 지표, 최적화 파라미터를 도입하여 손실을 막는 방법을 개선함으로써 전략의 안정성과 수익률을 더욱 높일 수 있습니다.
Source
Pine
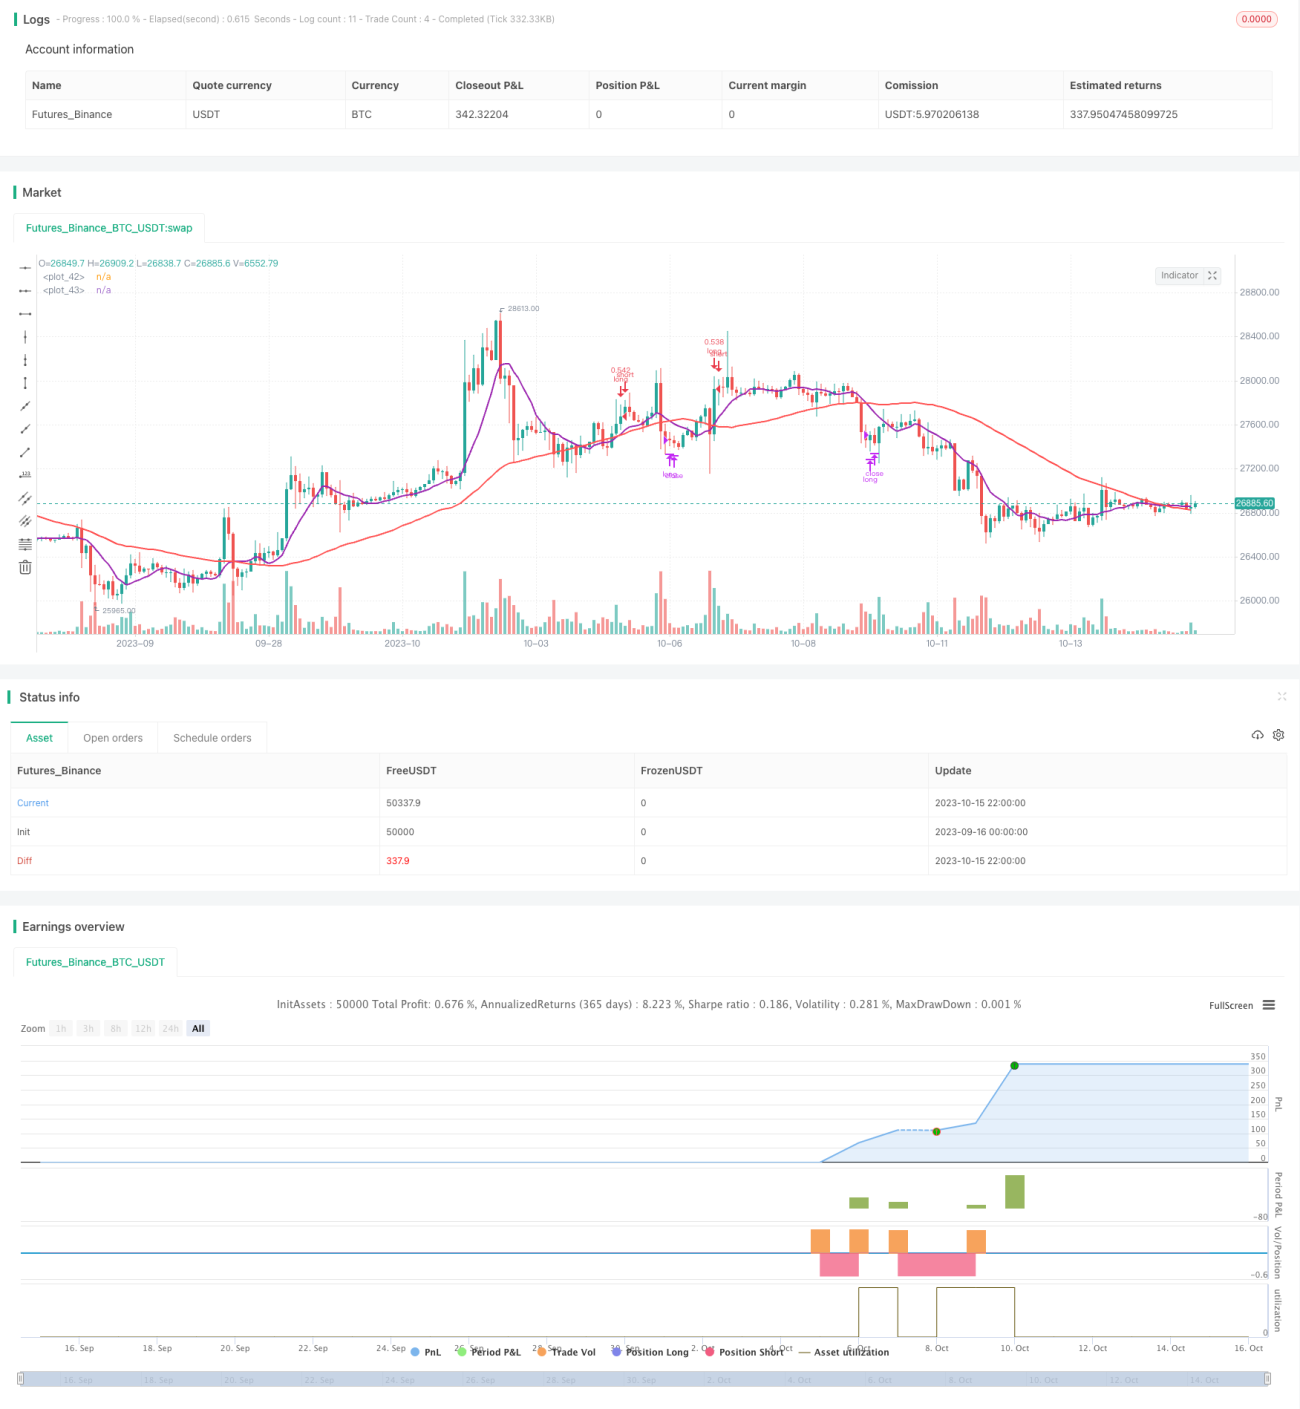
/*backtest
start: 2023-09-16 00:00:00
end: 2023-10-16 00:00:00
period: 2h
basePeriod: 15m
exchanges: [{"eid":"Futures_Binance","currency":"BTC_USDT"}]
*/

// This source code is subject to the terms of the Mozilla Public License 2.0 at https://mozilla.org/MPL/2.0/
// © relevantLeader16058

//@version=4Strategy parameters
Related strategies
Comment
All comments (0)
No data
- 1