모멘텀을 따르는 샤프 트렌드 사이클 전략

1
Follow
1778
Followers
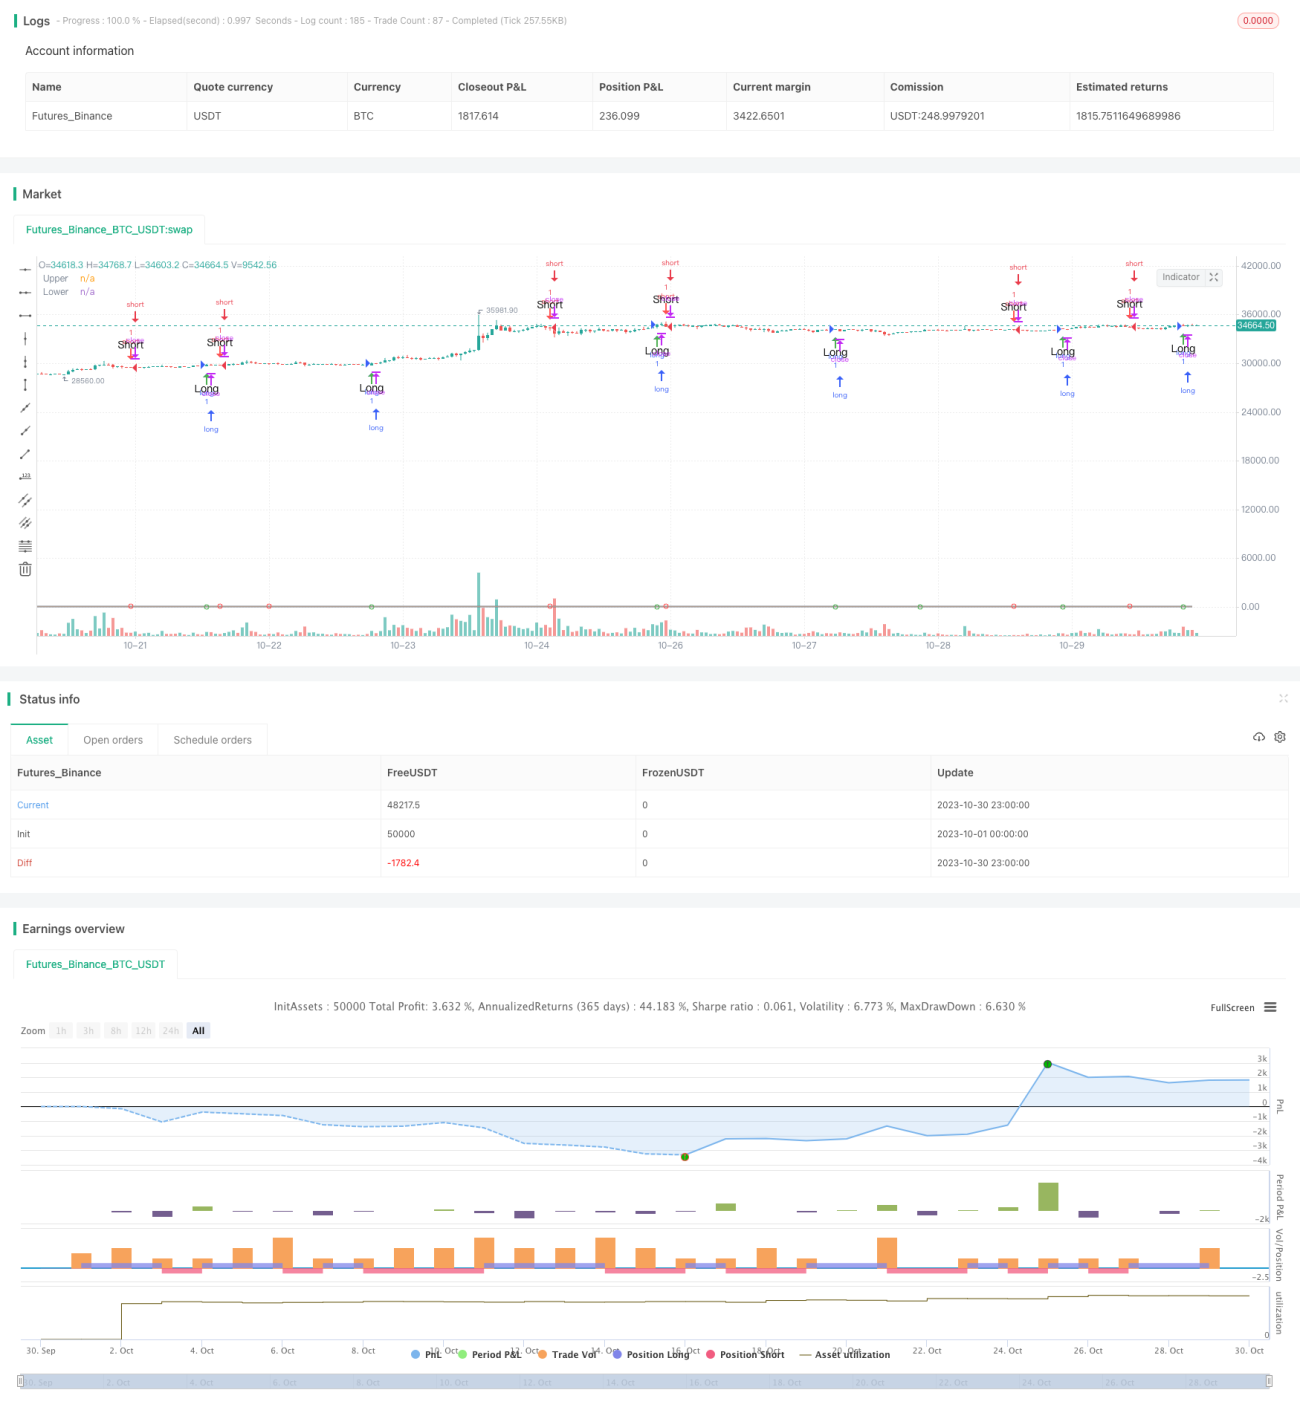
개요
이 전략은 슈아프 트렌드 순환 지표에 기반하고, 스토치 RSI의 오버 바이 오버 셀 원칙을 결합하여 동력 지표를 통해 트렌드를 판단하고 추적합니다. 가격이 오버 바이 영역에서 오버 바이 영역으로 돌파 할 때, 더 많은 것을하십시오. 가격이 오버 바이 영역에서 오버 바이 영역으로 넘어갈 때, 공백을하십시오. 이 전략은 가격 트렌드의 변화 지점을 포착하여 포지션을 동적으로 조정하고, 가격 움직임을 추적합니다.
전략 원칙
-
- Fast Length의 기본값이 23이고, Slow Length의 기본값이 50인 MACD를 계산한다. MACD는 단기 및 장기 이동 평균의 차이를 반영하여 가격 움직임을 판단한다.
-
- MACD에 Stoch RSI 처리를 하여 K값을 생성합니다. 여기서 사이클 <unk>은 10의 기본값으로 MACD의 동적 지표의 과매매 과매매를 나타냅니다.
-
- K값에 가중된 이동 평균으로, D값을 형성하고, 그 중 1st %D Length의 기본값은 3이며, K값의 노이스를 제거한다.
-
- D값에 대해 다시 스토치 RSI 처리를 하여 초기 STC값을 형성하고, 2nd %D Length의 기본값은 3이며, 정확한 오버 바이 오버 소드 신호를 형성한다.
-
- 초기 STC 값에 가중된 이동 평균으로 최종 STC 값이 주어지며, 범위는 0-100이다. STC가 75보다 높으면 과매도 지역이며, 25보다 낮으면 과매도 지역이다.
-
- STC가 아래에서 위쪽으로 25을 넘으면 더하고; STC가 위쪽에서 아래로 75을 넘으면 공백한다.
전략적 이점
-
- STC 지표는 Stoch RSI의 디자인을 결합하여 오버 바이 오버 셀 영역을 명확하게 식별하여 강력한 트렌드 신호를 형성합니다.
-
- 이중 스토치 RSI 필터링을 통해 가짜 돌파구를 효과적으로 필터링 할 수 있습니다.
-
- STC는 0-100 표준화 범위를 형성하여 기계화된 거래 신호를 형성할 수 있다.
-
- 이 전략은 시각화된 브레이크 마크와 텍스트 팝업 경보를 구현하여 거래 기회를 명확하고 직관적으로 포착할 수 있다.
-
- 전략은 너무 민감한 거래를 피하기 위해 무의미한 거래를 효과적으로 제어 할 수있는 최적화된 파라미터 조합을 사용합니다.
전략적 위험
-
- STC 지표는 변수에 민감하며, 다른 통화와 시간 주기에는 시장 특성에 맞게 변수 조합을 조정할 필요가 있다.
-
- 파격적인 거래 전략은 쉽게 조작될 수 있으며, 위험을 통제하기 위해 스톱로스를 설정해야 한다.
-
- 유동성이 낮은 시장의 가짜 돌파는 잘못된 신호를 유발할 수 있으며, 합성 거래량과 같은 지표가 필터링되어야 합니다.
-
- 이 전략은 STC 지표만을 기반으로 다른 요소와 결합하여 트렌드 확정을 판단하여 역전 손실을 피합니다.
-
- 이 지역에서는 잘못된 신호를 피하기 위해 중요한 저항 지점에 주의를 기울여야 합니다.
전략 최적화 방향
-
- MACD의 변수 조합을 최적화하여 다른 주기 및 통화에 적합하도록 한다.
-
- 스토흐 RSI의 K값과 D값 변수를 최적화하고, STC 곡선을 평평하게 한다.
-
- 거래량 지표의 결합으로 유동성이 낮은 시장의 가짜 돌파구를 피하십시오.
-
- 트렌드 신호를 확인하는 다른 지표 판단을 추가합니다. 예를 들어, 브린 띠 <unk>.
-
- 이동 상쇄 또는 ATR 상쇄와 같은 상쇄 메커니즘을 추가합니다.
-
- 진입 위치를 조정합니다. 예를 들어, 트렌드 확인을 보장하기 위해 돌파구 후 회전 진입.
요약하다
샤프 트렌드 사이클 전략은 동력 지표를 통해 과매매 지역을 판단하고, 이를 통해 가격의 단기 트렌드 변화를 판단한다. 이 전략은 간단하고 명확하며, 다른 시장의 파라미터에 따라 조정할 수 있지만, 수축의 위험도 존재한다. 보조 지표 판단과 상쇄를 통해 최적화하여 강한 추세에서 더 나은 효과를 발휘할 수 있다.
Source
Pine
/*backtest
start: 2023-10-01 00:00:00
end: 2023-10-31 00:00:00
period: 1h
basePeriod: 15m
exchanges: [{"eid":"Futures_Binance","currency":"BTC_USDT"}]
*/

//@version=3
// Copyright (c) 2018-present, Alex Orekhov (everget)
// Schaff Trend Cycle script may be freely distributed under the MIT license.
strategy("Schaff Trend Cycle", shorttitle="STC Backtest", overlay=true)Strategy parameters
Related strategies
Comment
All comments (0)
No data
- 1