개요
이 전략은 쌍평등선을 기반으로 한 흔들림 거래 전략이다. 그것은 빠른 이동 평균과 느린 이동 평균의 교차를 구매 및 판매 신호로 사용합니다. 빠른 이동 평균이 아래에서 느린 이동 평균을 통과 할 때 구매 신호를 생성하고 빠른 이동 평균이 위에서 아래에서 느린 이동 평균을 통과 할 때 판매 신호를 생성합니다. 이 전략은 흔들림 상황에 적용되며, 가격의 단기 변동으로 이익을 얻을 수 있습니다.
전략 원칙
이 전략은 length 6의 RMA를 빠른 이동 평균으로, length 4의 HMA를 느린 이동 평균으로 사용한다. 전략은 빠른 선과 느린 선의 교차로 가격 추세를 판단하고 거래 신호를 생성한다.
빠른 선이 아래에서 느린 선을 통과하면, 이는 가격이 단기간에 하락으로 변하는 것을 의미하며, 칩 전환의 시점으로, 따라서 전략은 이 때 구매 신호를 생성합니다. 빠른 선이 위에서 아래에서 느린 선을 통과하면, 이는 가격이 단기간에 하락으로 변하는 것을 의미하며, 이는 칩 전환의 시점으로, 따라서 전략은 이 때 판매 신호를 생성합니다.
또한, 전략은 장기적인 경향 판단을 검출하여 역거래를 피한다. 장기적인 경향 판단이 동시에 그 신호를 찬성할 때만 실제 구매 및 판매 신호를 생성한다.
전략적 이점
이 전략은 다음과 같은 장점을 가지고 있습니다.
- 이중 평평선 교차 판단을 사용하여, 단기 가격 역점을 효과적으로 식별할 수 있다.
- 빠른 선과 느린 선의 길이가 합리적으로 조합되어 보다 정확한 거래 신호를 생성할 수 있다.
- 장기 및 단기 트렌드 판단과 함께, 대부분의 노이즈 트레이딩 신호를 필터링 할 수 있습니다.
- 스톱 스톱 로직을 구현하여 위험을 능동적으로 회피할 수 있다.
- “이거래는 쉽게 이해할 수 있고 실행할 수 있습니다.
위험과 해결책
이 전략에는 몇 가지 위험도 있습니다.
쌍평선 전략은 여러 번 작은 이윤을 창출하지만 한 번 큰 손실을 초래하는 경우가 많습니다. 해결책은 중지 중지 손실 수준을 적절하게 조정하는 것입니다.
위기 상황에서 거래 신호가 자주 발생하여 과도한 거래가 발생할 수 있습니다. 해결책은 거래 조건을 적절하게 완화하고 거래를 줄이는 것입니다.
정책 매개 변수는 지나치게 최적화되기 쉽고, 실디 효과는 좋지 않을 수 있다. 해결책은 매개 변수 안정성 테스트이다.
전략은 트렌드 상황에서 잘 작동하지 않습니다. 해결책은 트렌드 판단 모듈을 추가하거나 트렌드 전략과 결합하여 사용하는 것입니다.
최적화 방향
이 전략은 다음과 같은 방향으로 더 개선될 수 있습니다.
평균선 지표를 업데이트하고, Kalman 등의 적응 필터를 사용한다.
기계학습 모듈을 추가하여 AI 훈련으로 매매 지점을 결정합니다.
자금 관리 모듈을 추가하여 위험 통제를 더 자동화합니다.
고주파 요소와 결합하여 더 강력한 거래 신호를 찾습니다.
다종종의 시장 간 중매.
요약하다
이 쌍평선 흔들림 전략은 전체적으로 전형적이고 실용적인 양적 거래 전략이다. 그것은 강한 적응력을 가지고 있으며, 초보자들이 전략 개발에 대한 지식을 많이 배울 수 있다. 동시에, 그것은 더 많은 양적 기법을 더 결합하여 더 나은 전략 효과를 얻을 수 있도록 개선 할 수있는 큰 공간도 있습니다.
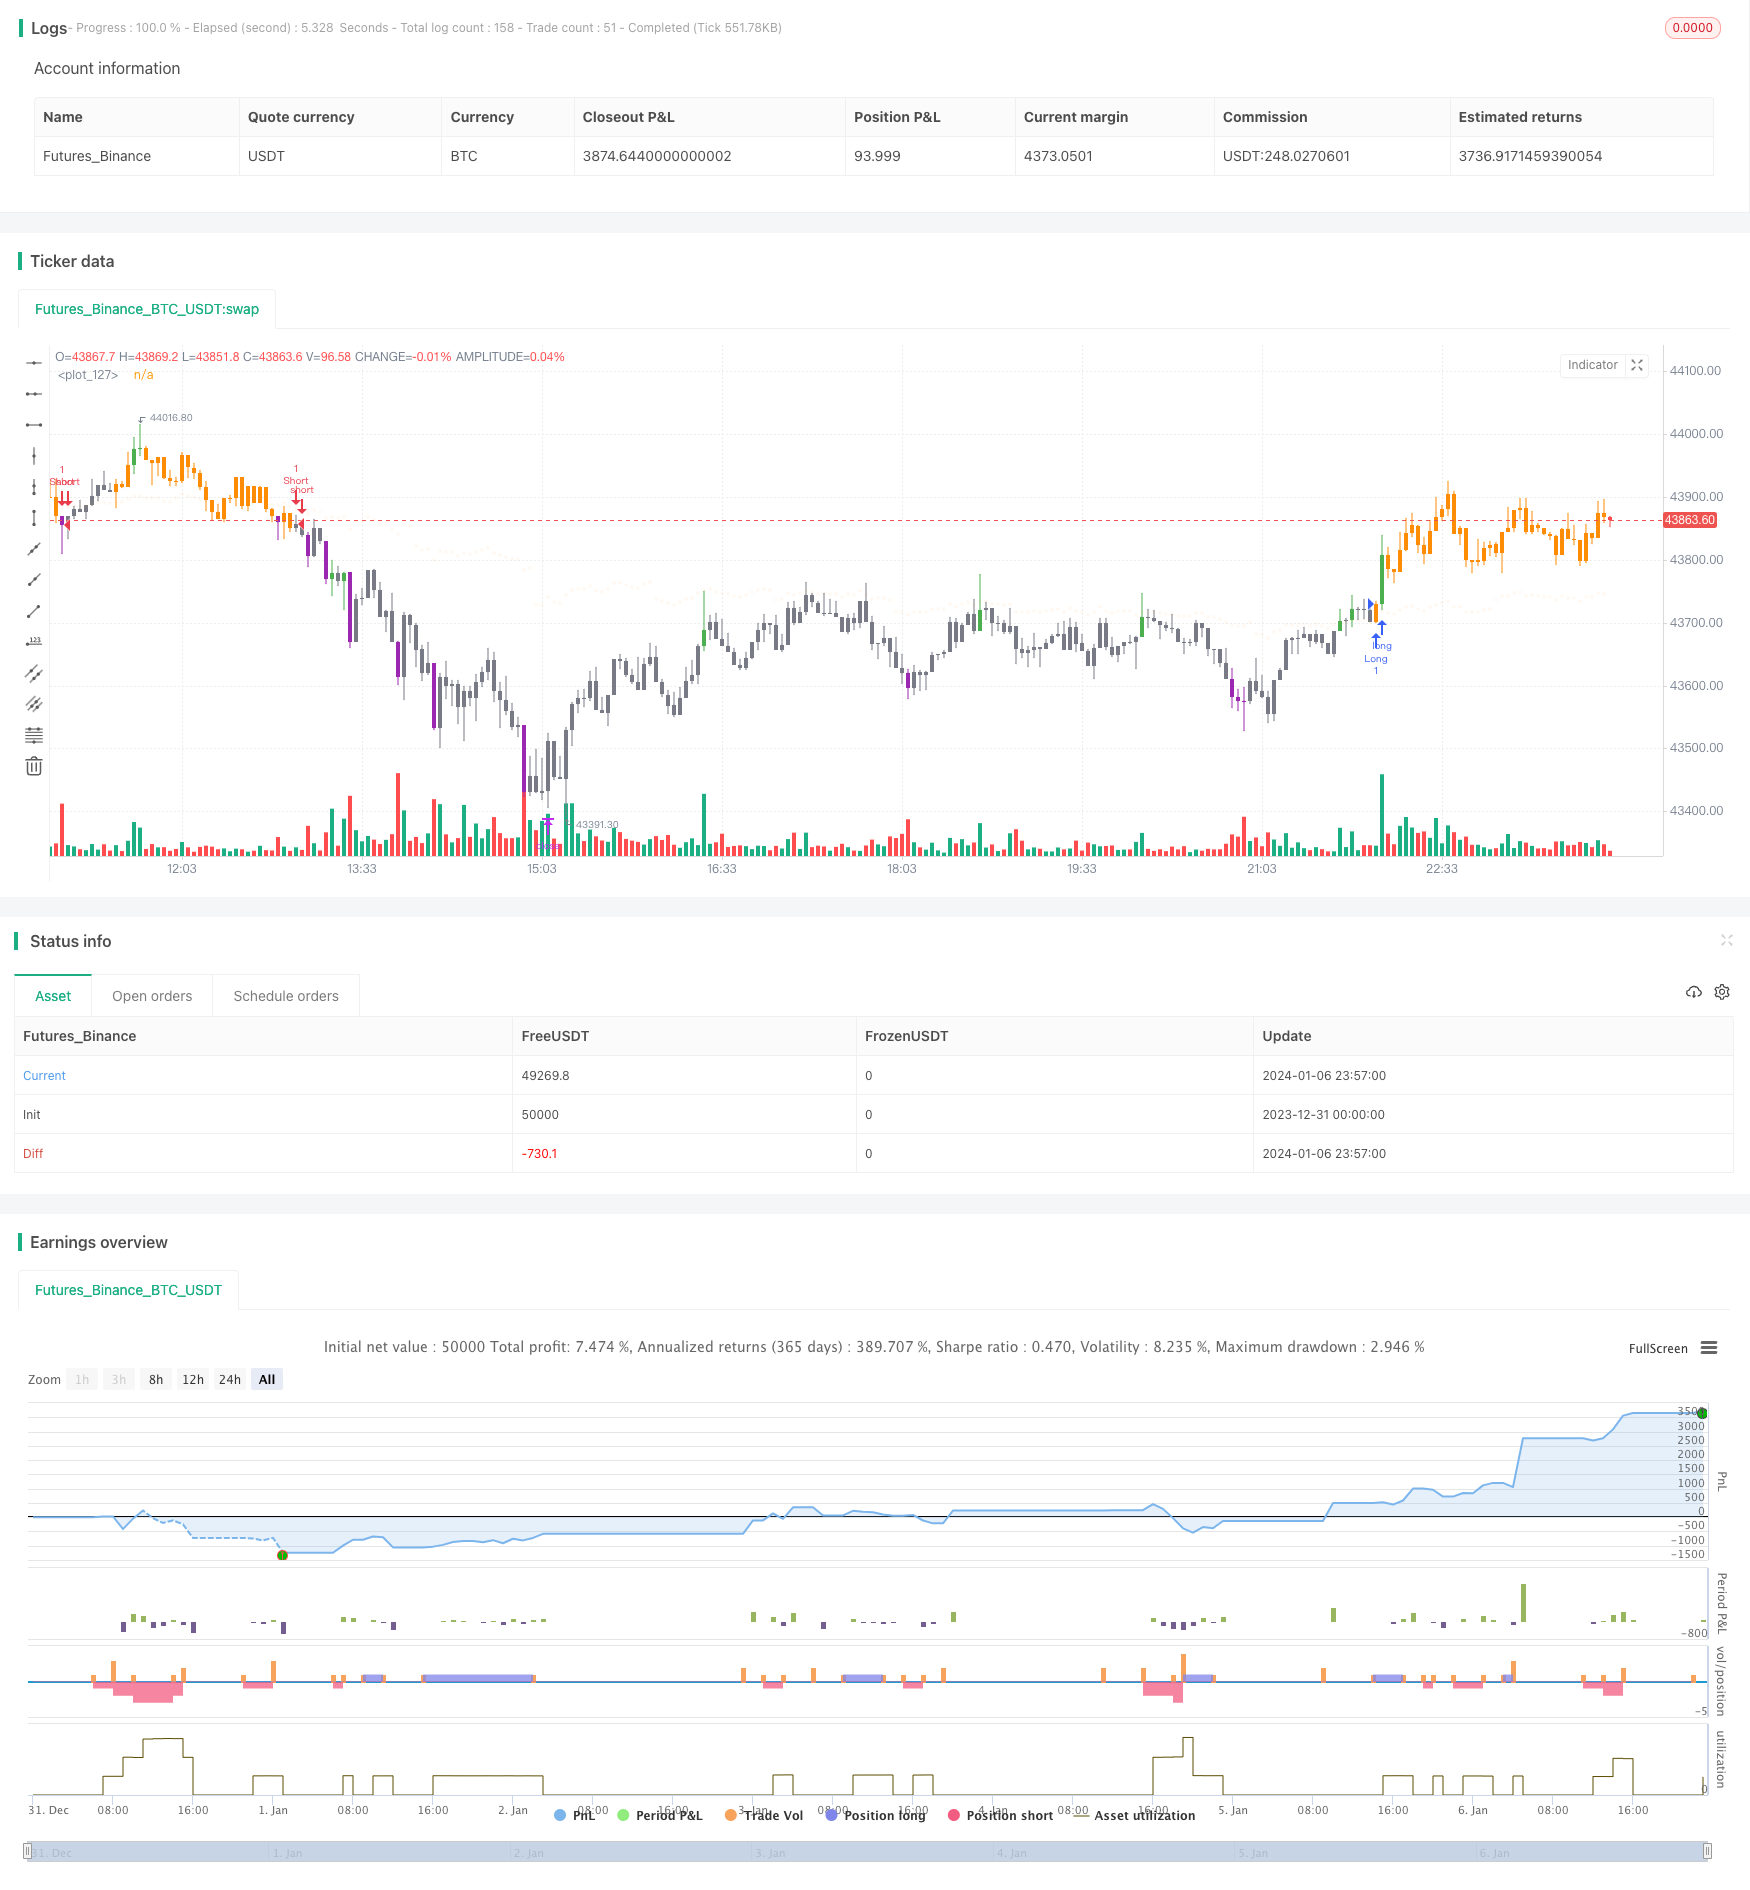
/*backtest
start: 2023-12-31 00:00:00
end: 2024-01-07 00:00:00
period: 3m
basePeriod: 1m
exchanges: [{"eid":"Futures_Binance","currency":"BTC_USDT"}]
*/

// This source code is subject to the terms of the Mozilla Public License 2.0 at https://mozilla.org/MPL/2.0/
// © dc_analytics
// https://datacryptoanalytics.com/


//@version=5
strategy("Scalping Trading", overlay=true)

//  INPUTS  //
bar_color       = input(true, title='Bar Color', group='⚙ Settings',tooltip='Color chart bars.', inline = "1")
mostrar         = input(true, 'Show Alerts', group='⚙ Settings', inline = "1")
tempo           = input.timeframe('60', group='⚙ Settings', title='🕗 Timeframe', options=['1', '5', '15', '30', '60', '120', '240', '360', '720', 'D', 'W'])

i_position      = input.string("Bottom Center", title = "⚙ D-Panel Location",
 options = ["Top Right", "Bottom Center", "Bottom Right"], group='⚙ D-Panel Settings️',
 tooltip='Choose the location of the information table on the chart.(D-Panel) ')

position        = i_position == "Top Right" ? position.top_right : i_position == "Bottom Center" ? position.bottom_center : position.bottom_right

i_tam           = input.string('Big', title = '⚙ D-Painel Size',
 options = ["Tiny", "Small", "Big"], group='⚙ D-Panel Settings️',tooltip='Choose the size of the information panel (D-Panel).')

tamanho         = i_tam == "Tiny" ? size.tiny : i_tam == "Small" ? size.small : size.normal

show_tp_sl      = input(true, title='Show Take Profit/Stop Loss', group='⚙ Settings',tooltip='Show Take Profit/Stop Loss.')
TP              = input.float(defval=4500, title='Take Profit:',group='⚙ Risk Management',tooltip='Choose amount of profit')
SL              = input.float(defval=2500, title='Stop Loss:', group='⚙ Risk Management',tooltip='Choose amount of loss')
//  END INPUTS  //


//  DECLARATIONS  //
t_up    = '📈'
t_down  = '📉'

c_buy   = 'Long ⇡'
c_sell  = 'Short ⇣'

// _DECLARATION TREND
t_sma       = ta.hma(close, 200)
tend_sma    = ta.sma(close, 12)

tendencia   = request.security(syminfo.tickerid, timeframe.period, t_sma, barmerge.gaps_off, barmerge.lookahead_off)
tend_tabela = request.security(syminfo.tickerid, timeframe.period, tend_sma, barmerge.gaps_off, barmerge.lookahead_off)
// _END DECLARATION TREND

circle = plot.style_circles
//  END DECLARATIONS  //


//  COLORS  //
color gray   = color.gray
color red    = color.new(#ff8c05, 0)
color orange = color.new(#ff8c05, 0)
color silver = color.silver
color up_vol = color.new(color.green, 0)
color dn_vol = color.new(color.purple, 0)

color orange_tranp  = color.new(#ff8c05, 95)
// END COLORS //

//  SCANNER MARKET MAKERS  //
periodo  = input.int(20, 'Period Volume', group='⚙️ Scanner Market Makers Settings')
fator    = input.float(1.85, 'Proportion to the mean: (1.25 = 125% of the mean)', minval=0, group='⚙️ Scanner Market Makers Settings')
vol_up   = close > open
vol_down = open > close
vol      = volume
pesado   = volume > ta.ema(volume, periodo) * fator

palette  = pesado and vol_up ? gray : pesado and vol_down ? orange : vol_up ? silver : gray
//  END SCANNER MARKET MAKERS  //


//  LOGIC ONE  //
s = ta.rma(close, 6)
v = ta.hma(close, 4)

//  TREND
t_baixa     = tendencia > tendencia[1]
t_alta      = tendencia < tendencia[1]

te_d        = tend_tabela > tend_tabela[1]
trend       = te_d ? t_up : t_down
//  END TREND

a = request.security(syminfo.tickerid, tempo, s)
b = request.security(syminfo.tickerid, tempo, ohlc4)

c_dn   = a > b and a[1] < b[1]
c_up   = b > a and b[1] < a[1]

compra = mostrar and c_up ? a : na
venda  = mostrar and c_dn ? a : na

s_sell = venda and t_alta
s_buy  = compra and t_baixa
c_vela = b > a and te_d ? gray : orange

s_up = false
s_dw = false

b_sinal = not s_up and s_buy
s_sinal = not s_dw and s_sell

if b_sinal
    s_dw := false
    s_up := true
    s_up

if s_sinal
    s_dw := true
    s_up := false
    s_up

// END LOGIC ONE //


//  DATA TABLE  //
c = b > a ? orange : gray
c_sinal = b > a ? c_buy : c_sell
//  END DATA TABLE  //


//  PLOT/BARCOLOR  //
c_barcolor = pesado and vol_up ? up_vol : pesado and vol_down ? dn_vol : vol_up ? c : c

barcolor(bar_color ? c_barcolor : na)
plot(a, color=orange_tranp, style=circle)
//  END PLOT/BARCOLOR  //


//  TABLE  //
var dash = table.new(position=position, columns=2, rows=3, border_width=1)
if barstate.islast
    table.cell(table_id=dash, column=1, row=2, text='Scalping DCA', bgcolor=orange)
    table.cell(table_id=dash, column=1, row=0, text='Trade: ' + c_sinal)
    table.cell(table_id=dash, column=1, row=1, text='Trend: ' + trend)
//  END TABLE  //


//  SETTINGS STRATEGY  //
exitPrice = strategy.closedtrades.exit_price(strategy.closedtrades - 1)

// OPEN ORDER
if (b_sinal)
    strategy.order("Long", strategy.long , comment = "Entry: " + str.tostring(close, "#.####"))
//    strategy.exit("EXIT", trail_points = 1000, trail_offset = 0, comment_trailing = "Close with Profit: " + str.tostring(close, "#.####"))
//    strategy.entry("long", strategy.long)

if (s_sinal)
    strategy.order("Short", strategy.short , comment = "Entry: " + str.tostring(close, "#.####"))
//    strategy.exit("EXIT", trail_points = 1000, trail_offset = 0, comment_trailing = "Close with Profit: " + str.tostring(close, "#.####"))
//    strategy.entry("short", strategy.short)

//  TP/SL ORDERS
if strategy.position_size > 0
    strategy.exit('Long_Close', 'Long',profit = TP , loss=SL, qty_percent=100, comment_profit = "Profit Long: " + str.tostring(exitPrice, "#.####"), comment_loss = "Stop Long: " + str.tostring(exitPrice, "#.####"))
//if  strategy.position_size > 0
//    strategy.exit("Long", "Long", stop = longSL, limit = longTP, comment_profit = "Profit Long: " + str.tostring(exitPrice, "#.####"), comment_loss = "Stop Long: " + str.tostring(exitPrice, "#.####"))

if strategy.position_size < 0
    strategy.exit('Short_Close', 'Short',profit = TP, loss=SL, qty_percent=100, comment_profit = "Profit Short: " + str.tostring(exitPrice, "#.####"), comment_loss = "Stop Short: " + str.tostring(exitPrice, "#.####"))
//if strategy.position_size < 0
//    strategy.exit("Short", "Short", stop = shortSL, limit = shortTP, comment_profit = "Profit Short: "+ str.tostring(exitPrice, "#.####"), comment_loss = "Stop Short: " + str.tostring(exitPrice, "#.####"))

//  END SETTINGS STRATEGY  //

// LOGS
// if strategy.opentrades > 10
//     log.warning("{0} positions opened in the same direction in a row. Try adjusting `bracketTickSizeInput`", strategy.opentrades)

// last10Perc = strategy.initial_capital / 10 > strategy.equity
// if (last10Perc and not last10Perc[1])
//     log.error("The strategy has lost 90% of the initial capital!")