개요
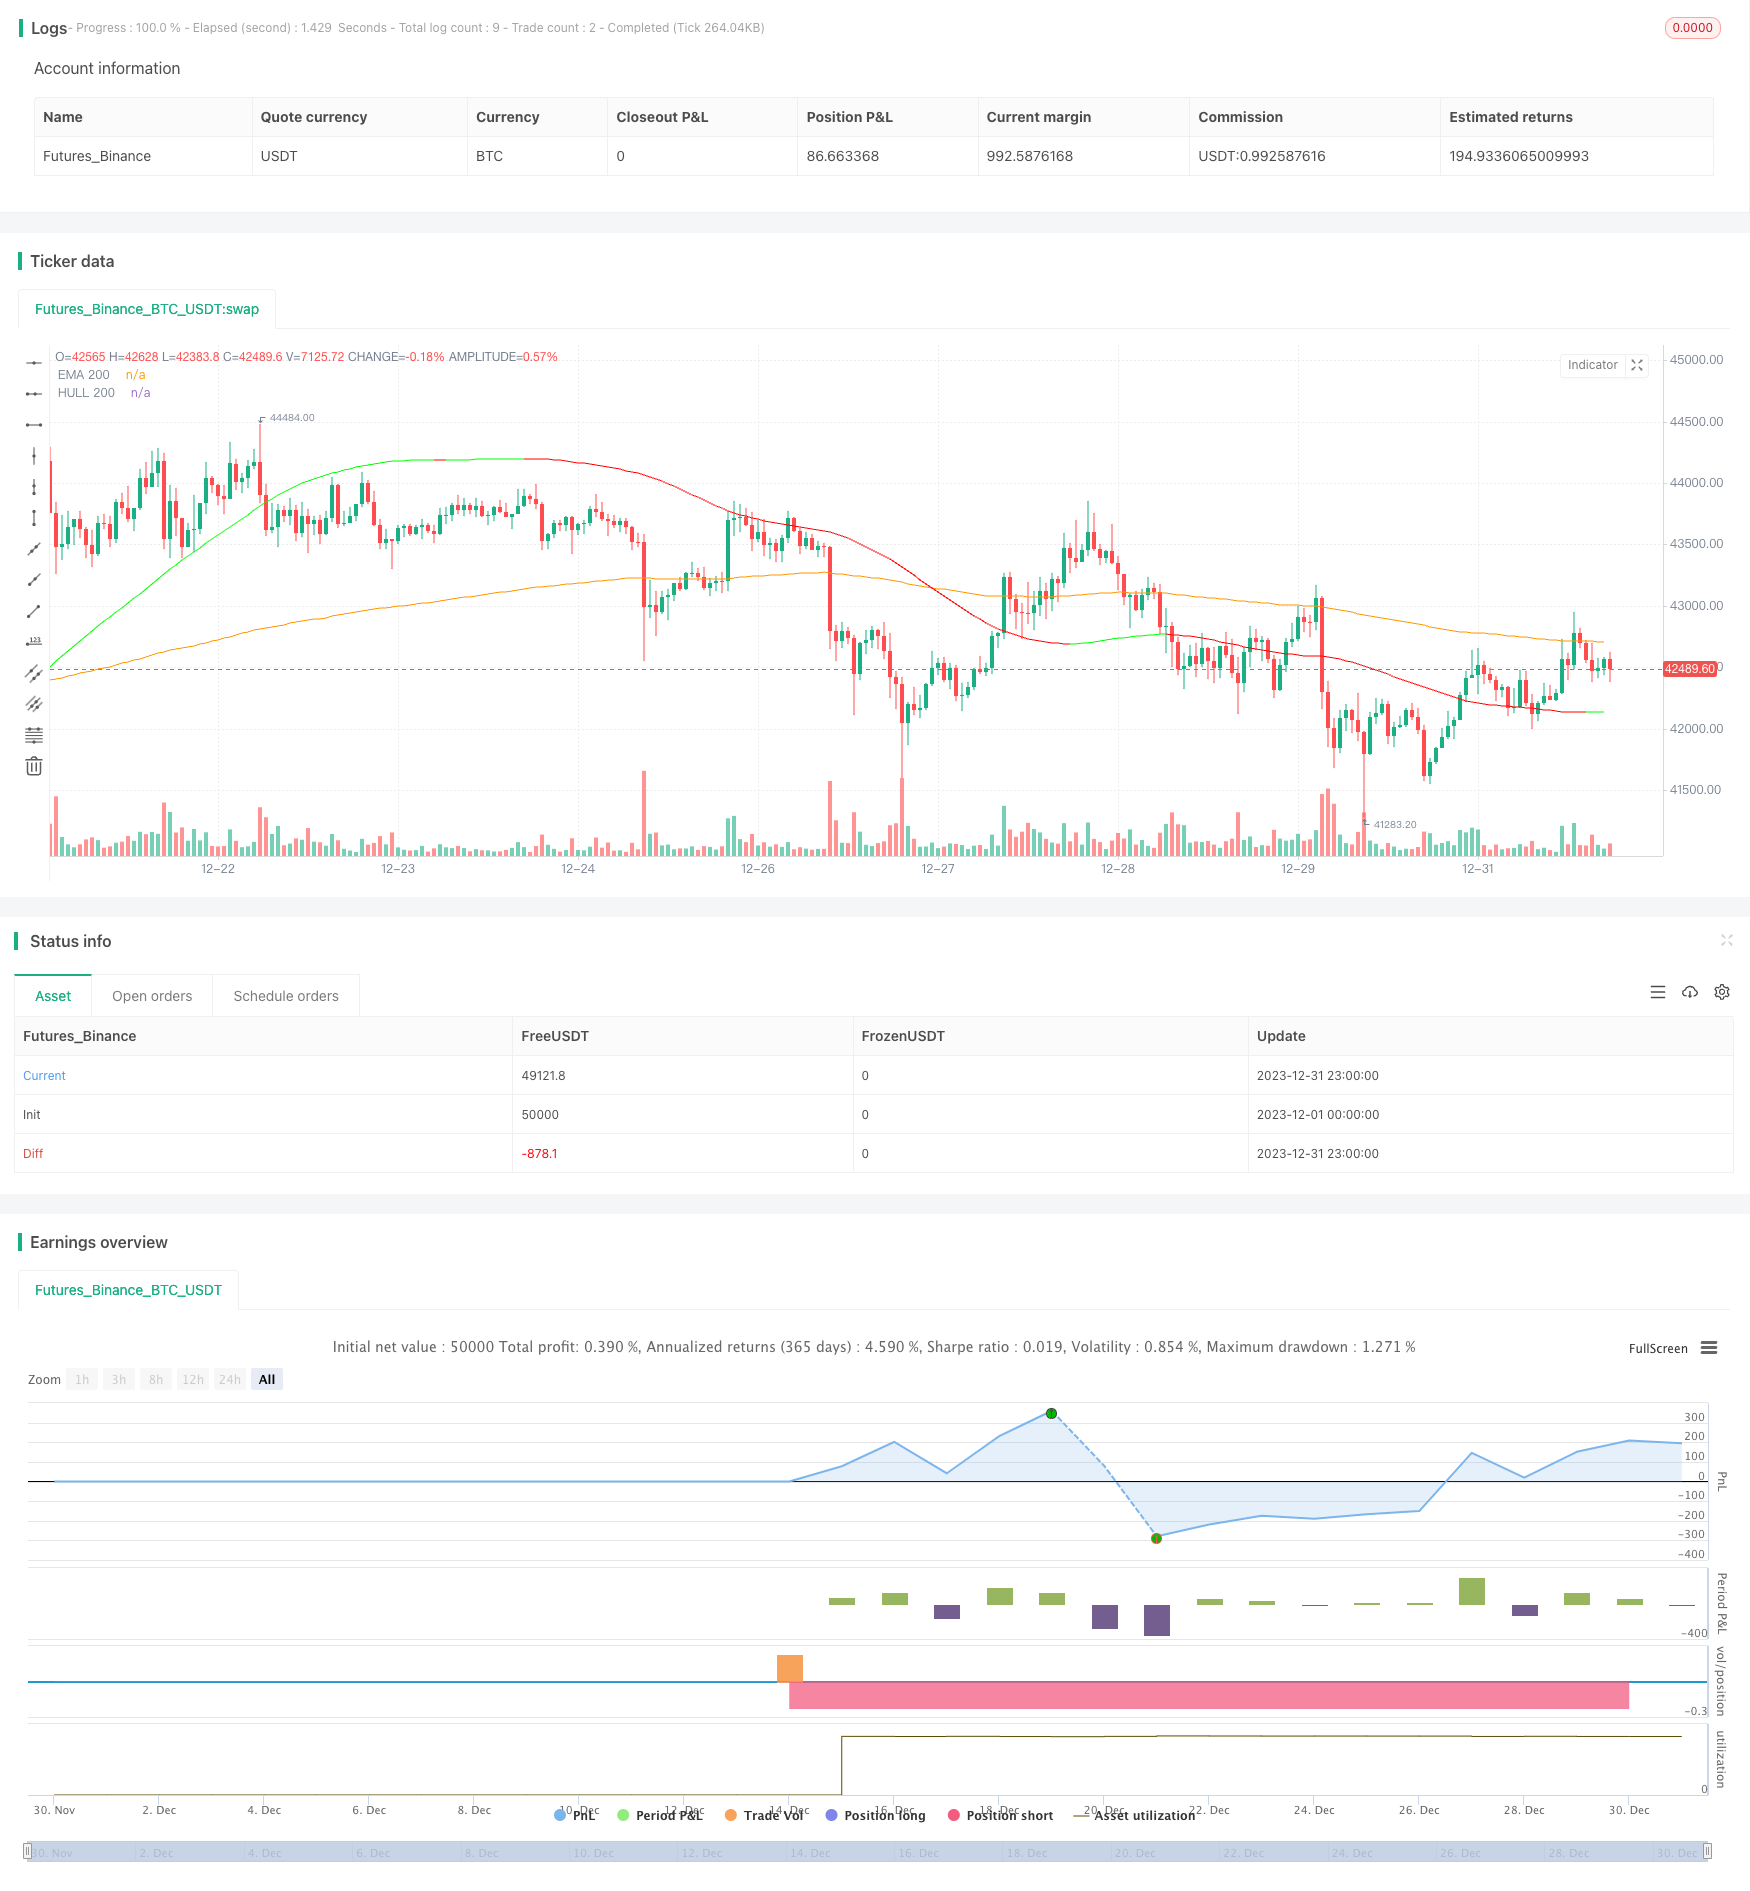
이 전략은 주로 이동 평균 HMA와 EMA가 형성되는 평행선 평정을 사용하여 구매 시점을 판단한다. HMA에서 EMA를 착용할 때 평정이 종료된 것으로 간주되어 새로운 상승 추세가 형성되므로 HMA에서 EMA를 착용하는 동시에 구매한다.
이 전략은 동시에 RSI 지표와 결합하여 과매매 과매매 상황을 탐지한다. RSI가 70보다 낮으면 구매를 허용하고, RSI가 80보다 높으면 부분 중단을 고려한다.
전략 원칙
이 전략은 200주기의 EMA와 HMA를 사용하여 평행선 시스템을 구축한다. 이 중 HMA 지표는 EMA 개선을 기반으로 설계된 보다 민감한 이동 평균 지표이다. HMA에 EMA를 착용하면, 정리 단계가 종료되고 주가가 상승하기 시작한다는 것을 나타냅니다. 이 시점에 RSI 지표가 과매매가 없는 경우, 구매 신호가 발생한다.
이미 포지션이 구축된 상태에서 주가가 다시 떨어지면, HMA는 다시 EMA를 부수하여 새로운 정리가 시작되는 것을 표시하면, 전체 포지션이 청산된다. 한편, RSI가 80을 부수면, 손실을 방지하기 위해 20%를 부분적으로 중지한다.
이 전략의 거래 논리는 비교적 간단하며, 주로 HMA와 EMA의 다공간 교차로, RSI의 고저위 판단과 결합하여 보다 안정적인 거래 전략을 형성한다.
우위 분석
이 전략의 가장 큰 장점은 EMA와 HMA의 평형 거래 형태를 활용하여 대부분의 가짜 브레이크를 필터링하여 수익률을 높일 수 있다는 것입니다. 또한 RSI 지표의 보조는 위험을 효과적으로 제어 할 수 있습니다. 이 두 가지의 조합은 이 전략이 평형 흔들림 시장에 매우 적합합니다.
또한, 이 전략은 단지 3개의 지표를 사용하며 논리적으로 간단하다. 이것은 그것의 매개 변수를 최적화하고 재검토하는 것을 편리하게 하고, 전략의 검증과 개선을 돕는다.
위험 분석
이 전략이 장점이 있기는 하지만, 주의해야 할 몇 가지 위험도 있다. 예를 들어, 지분 보유 기간이 비교적 길어지고, 충분한 자금 지원이 필요하다. 수평 정리 시기가 발생하면, 손실을 빨리 막아낼 수 없고, 손실이 확대될 가능성이 있다.
또한, 이 전략은 주로 평평선 지표에 의존하며, 가격이 비정상적인 돌파구가 발생하면, 손해 방지 조치가 제대로 작동하지 않을 수 있으며, 더 큰 위험을 초래할 수 있다. 또한, 매개 변수 설정은 전략의 성과에 영향을 미치며, 최적의 매개 변수를 찾기 위해 많은 테스트가 필요합니다.
최적화 방향
위와 같은 위험을 고려하여, 이 전략은 다음과 같은 측면에서 최적화될 수 있습니다.
변동률 지표와 결합하여 시장 변동에 따라 동적으로 위치를 조정합니다.
트렌드 지표 판단을 높여 불필요한 역거래를 피하십시오.
이동 평균의 변수를 최적화하여 현재의 시장 특성에 더 가깝게 만듭니다.
시간 손실을 방지하여 단일 손실의 과잉 문제를 최대한 방지하십시오.
요약하다
이 전략은 전체적으로 비교적 고전적인 단순 정리된 흔들림 전략이다. 이 전략은 주로 주식 지수와 인기 있는 개인 주식의 단선 및 중기 거래에 적용되며, 비교적 안정적인 알파 값을 얻을 수 있다. 매개 변수의 최적화 및 위트 컨트롤 조치의 강화와 함께 이 전략의 성과는 큰 향상 공간을 가지고 있다.
/*backtest
start: 2023-12-01 00:00:00
end: 2023-12-31 23:59:59
period: 1h
basePeriod: 15m
exchanges: [{"eid":"Futures_Binance","currency":"BTC_USDT"}]
*/

// This source code is subject to the terms of the Mozilla Public License 2.0 at https://mozilla.org/MPL/2.0/
// © mohanee

//@version=4
strategy(title="EMA_HMA_RSI_Strategy", overlay=true, pyramiding=2,     default_qty_type=strategy.cash, default_qty_value=10000, initial_capital=10000, currency=currency.USD)  //default_qty_value=10, default_qty_type=strategy.fixed,

//longCondition = crossover(sma(close, 14), sma(close, 28))
//if (longCondition)
    //strategy.entry("My Long Entry Id", strategy.long)

//shortCondition = crossunder(sma(close, 14), sma(close, 28))
//if (shortCondition)
  //  strategy.entry("My Short Entry Id", strategy.short)

//HMA
HMA(src1, length1) =>  wma(2 * wma(src1, length1/2) - wma(src1, length1), round(sqrt(length1)))

var stopLossVal=0.00

//variables BEGIN
length=input(200,title="EMA and HMA Length")   //square root of 13

rsiLength=input(13, title="RSI Length")

takePartialProfits = input(true, title="Take Partial Profits (if this selected, RSI 13 higher reading over 80 is considered for partial closing ) ")

stopLoss = input(title="Stop Loss%", defval=8, minval=1)
//variables  END

//RSI
rsi13=rsi(close,rsiLength)


ema200=ema(close,length)
hma200=HMA(close,length)

//exitOnAroonOscCrossingDown = input(true, title="Exit when Aroon Osc cross down zero ")


// Drawings

//Aroon oscillator

arronUpper = 100 * (highestbars(high, length+1) + length)/length
aroonLower = 100 * (lowestbars(low, length+1) + length)/length

aroonOsc  = arronUpper - aroonLower

aroonMidpoint = 0
//oscPlot = plot(aroonOsc, color=color.green)
//midLine= plot(aroonMidpoint, color=color.green)
//topLine = plot(90,style=plot.style_circles, color=color.green)
//bottomLine = plot(-90,style=plot.style_circles, color=color.red)

//fill(oscPlot, midLine, color=aroonOsc>0?color.green:color.red, transp=50)
//fill(topLine,bottomLine, color=color.blue)
//fill(topLine,oscPlot, color=aroonOsc>90?color.purple:na, transp=25)


// RSI
//plot(rsi13, title="RSI", linewidth=2, color=color.purple)
//hline(50, title="Middle Line", linestyle=hline.style_dotted)
//obLevel = hline(80, title="Overbought", linestyle=hline.style_dotted)
//osLevel = hline(30, title="Oversold", linestyle=hline.style_dotted)
//fill(obLevel, osLevel, title="Background", color=rsi13 >=30 ? color.green:color.purple, transp=65)  // longTermRSI >=50

hullColor = hma200 > hma200[2] ? #00ff00 : #ff0000

plot(hma200, title="HULL 200", color=hullColor,  transp=25)
plot(ema200, title="EMA 200", color=color.orange)

//Entry--
strategy.initial_capital = 50000
strategy.entry(id="Long Entry", comment="LE", qty=(strategy.initial_capital * 0.10)/close, long=true,  when=strategy.position_size<1 and hma200 < ema200   and  hma200 > hma200[2]  and rsi13<70 )     //  // aroonOsc<0

//Add
if(strategy.position_size>=1 and  close < strategy.position_avg_price and  ( crossover(rsi13,30) or  crossover(rsi13,40) ) )   // hma200 < ema200   and  hma200 > hma200[2]   and hma200[2] < hma200[3] )  //and crossover(rsi13,30)  aroonOsc<0    //and hma200 > hma200[2]  and hma200[2] <= hma200[3]  //crossover(rsi13,30)
    qty1=(strategy.initial_capital * 0.10)/close
    //stopLossVal:= abs(strategy.position_size)>1 ?  ( (close > close[1] and close > open and close>strategy.position_avg_price) ? close[1]*(1-stopLoss*0.01) : stopLossVal ) : 0.00
    strategy.entry(id="Long Entry", comment="Add", qty=qty1, long=true )     //crossover(close,ema34)  //and close>ema34  //crossover(rsi5Val,rsiBuyLine)  --   SL="+tostring(stopLossVal, "####.##")


//stopLossVal:= abs(strategy.position_size)>1 ? strategy.position_avg_price*(1-0.5) : 0.00

stopLossVal:= abs(strategy.position_size)>1 ?  ( (close > close[1] and close > open and close>strategy.position_avg_price) ? close[1]*(1-stopLoss*0.01) : stopLossVal ) : 0.00
//stopLossVal:= abs(strategy.position_size)>1 ?  strategy.position_avg_price*(1-stopLoss*0.01) :  0.00

barcolor(color=strategy.position_size>=1? rsi13>80 ? color.purple: color.blue:na)

//close partial
if(takePartialProfits==true)
    strategy.close(id="Long Entry", comment="Partial X  points="+tostring(close - strategy.position_avg_price, "####.##"),  qty_percent=20 , when=abs(strategy.position_size)>=1 and crossunder(rsi13, 80)  and close > strategy.position_avg_price  )   //close<ema55 and rsi5Val<20 //ema34<ema55


//close All
//if(exitOnAroonOscCrossingDown)
  //  strategy.close(id="Long Entry", comment="Exit All points="+tostring(close - strategy.position_avg_price, "####.##"),  when=abs(strategy.position_size)>=1 and crossunder(aroonOsc, 0) )   //close<ema55 and rsi5Val<20 //ema34<ema55  //close<ema89

//close All on stop loss
strategy.close(id="Long Entry", comment="Stoploss X points="+tostring(close - strategy.position_avg_price, "####.##"),  when=abs(strategy.position_size)>=1 and close < stopLossVal  )  //close<ema55 and rsi5Val<20 //ema34<ema55  //close<ema89

strategy.close(id="Long Entry", comment="hmaXema X points="+tostring(close - strategy.position_avg_price, "####.##"),  when=abs(strategy.position_size)>=1 and close > strategy.position_avg_price  and  crossunder(hma200,ema200)  )  //close<ema55 and rsi5Val<20 //ema34<ema55  //close<ema89