개요
이 전략은 상대적으로 약한 지수 ((RSI) 지수를 기반으로, Nifty 지수 거래에 사용되는 양적 투자 전략을 설계했습니다. 이 전략은 RSI 지수를 사용하여 과매매 기회를 식별하고, 저매매를 달성하고, 초과 수익을 추구합니다.
전략 원칙
이 전략은 2단계 RSI를 거래 신호로 설정한다. RSI가 20을 넘으면 더 많이 하고, RSI가 70을 넘으면 평소한다. 이렇게 지수의 단기 조정 기회를 잡는다.
구체적인 원칙은: RSI가 20보다 낮으면 과매매 상태이며, 자산이 과소평가되어 있음을 나타냅니다. 이는 곧 반등을 예고합니다. RSI가 20을 넘으면 더 많이합니다. RSI가 70보다 높으면 과매매 상태이며, 자산이 과대평가되어 있음을 나타냅니다.
우위 분석
이 전략은 단기 오버 바이 오버 셀 기회를 식별하는 지표를 이용한 양적 전략이다. 복잡한 기계 학습 및 통계적 중개 전략에 비해 이 전략의 장점은 주로 다음과 같다.
- 원칙은 간단하고 명확하며, 이해하기 쉽고, 검증하기 쉽습니다.
- 지표 변수가 적고, 최적화 및 조정이 쉽다.
- 단기적 초과 수익을 추구하는 것, 교차 거래에 따른 것
- 다양한 기대에 맞게 맞춤형 거래 기간
위험 분석
이 전략에는 다음과 같은 위험들이 있습니다.
- 장기적 추세에 대응할 수 없고, 큰 상황을 놓칠 수 있습니다.
- 너무 많은 변수 최적화에 의존하여 과다 적합성의 위험이 있습니다.
- 손실을 통제할 수 없는 무손실 메커니즘
- 거래 빈도, 포지션 보유 시간, 거래 비용 증가
위와 같은 위험을 통제하기 위해, 다음과 같은 측면에서 최적화할 수 있습니다:
- 추세와 같은 지표와 결합하여 장기적인 상황을 파악합니다.
- 워크 포워드 분석 (Walk Forward Analysis) 을 사용하여 과합을 방지합니다.
- 스톱포인트 설정, 시간적 스톱포인트 설정
- 거래 매개 변수를 적절하게 조정하고 거래 빈도를 제어합니다.
최적화 방향
이 전략은 다음의 몇 가지 측면에서 최적화될 수 있습니다.
- RSI 변수를 최적화하여 최적의 변수 조합을 찾습니다.
- 최대 회수량을 통제하기 위한 손해 방지 제도를 늘립니다.
- 이동 평균과 같은 지표와 함께 장기적인 추세를 판단하는 것
- 포지션 관리 모듈을 추가하여 포지션 분배를 최적화합니다.
- 양적 저작권 기능을 추가하고, 자동으로 변수를 조정합니다.
요약하다
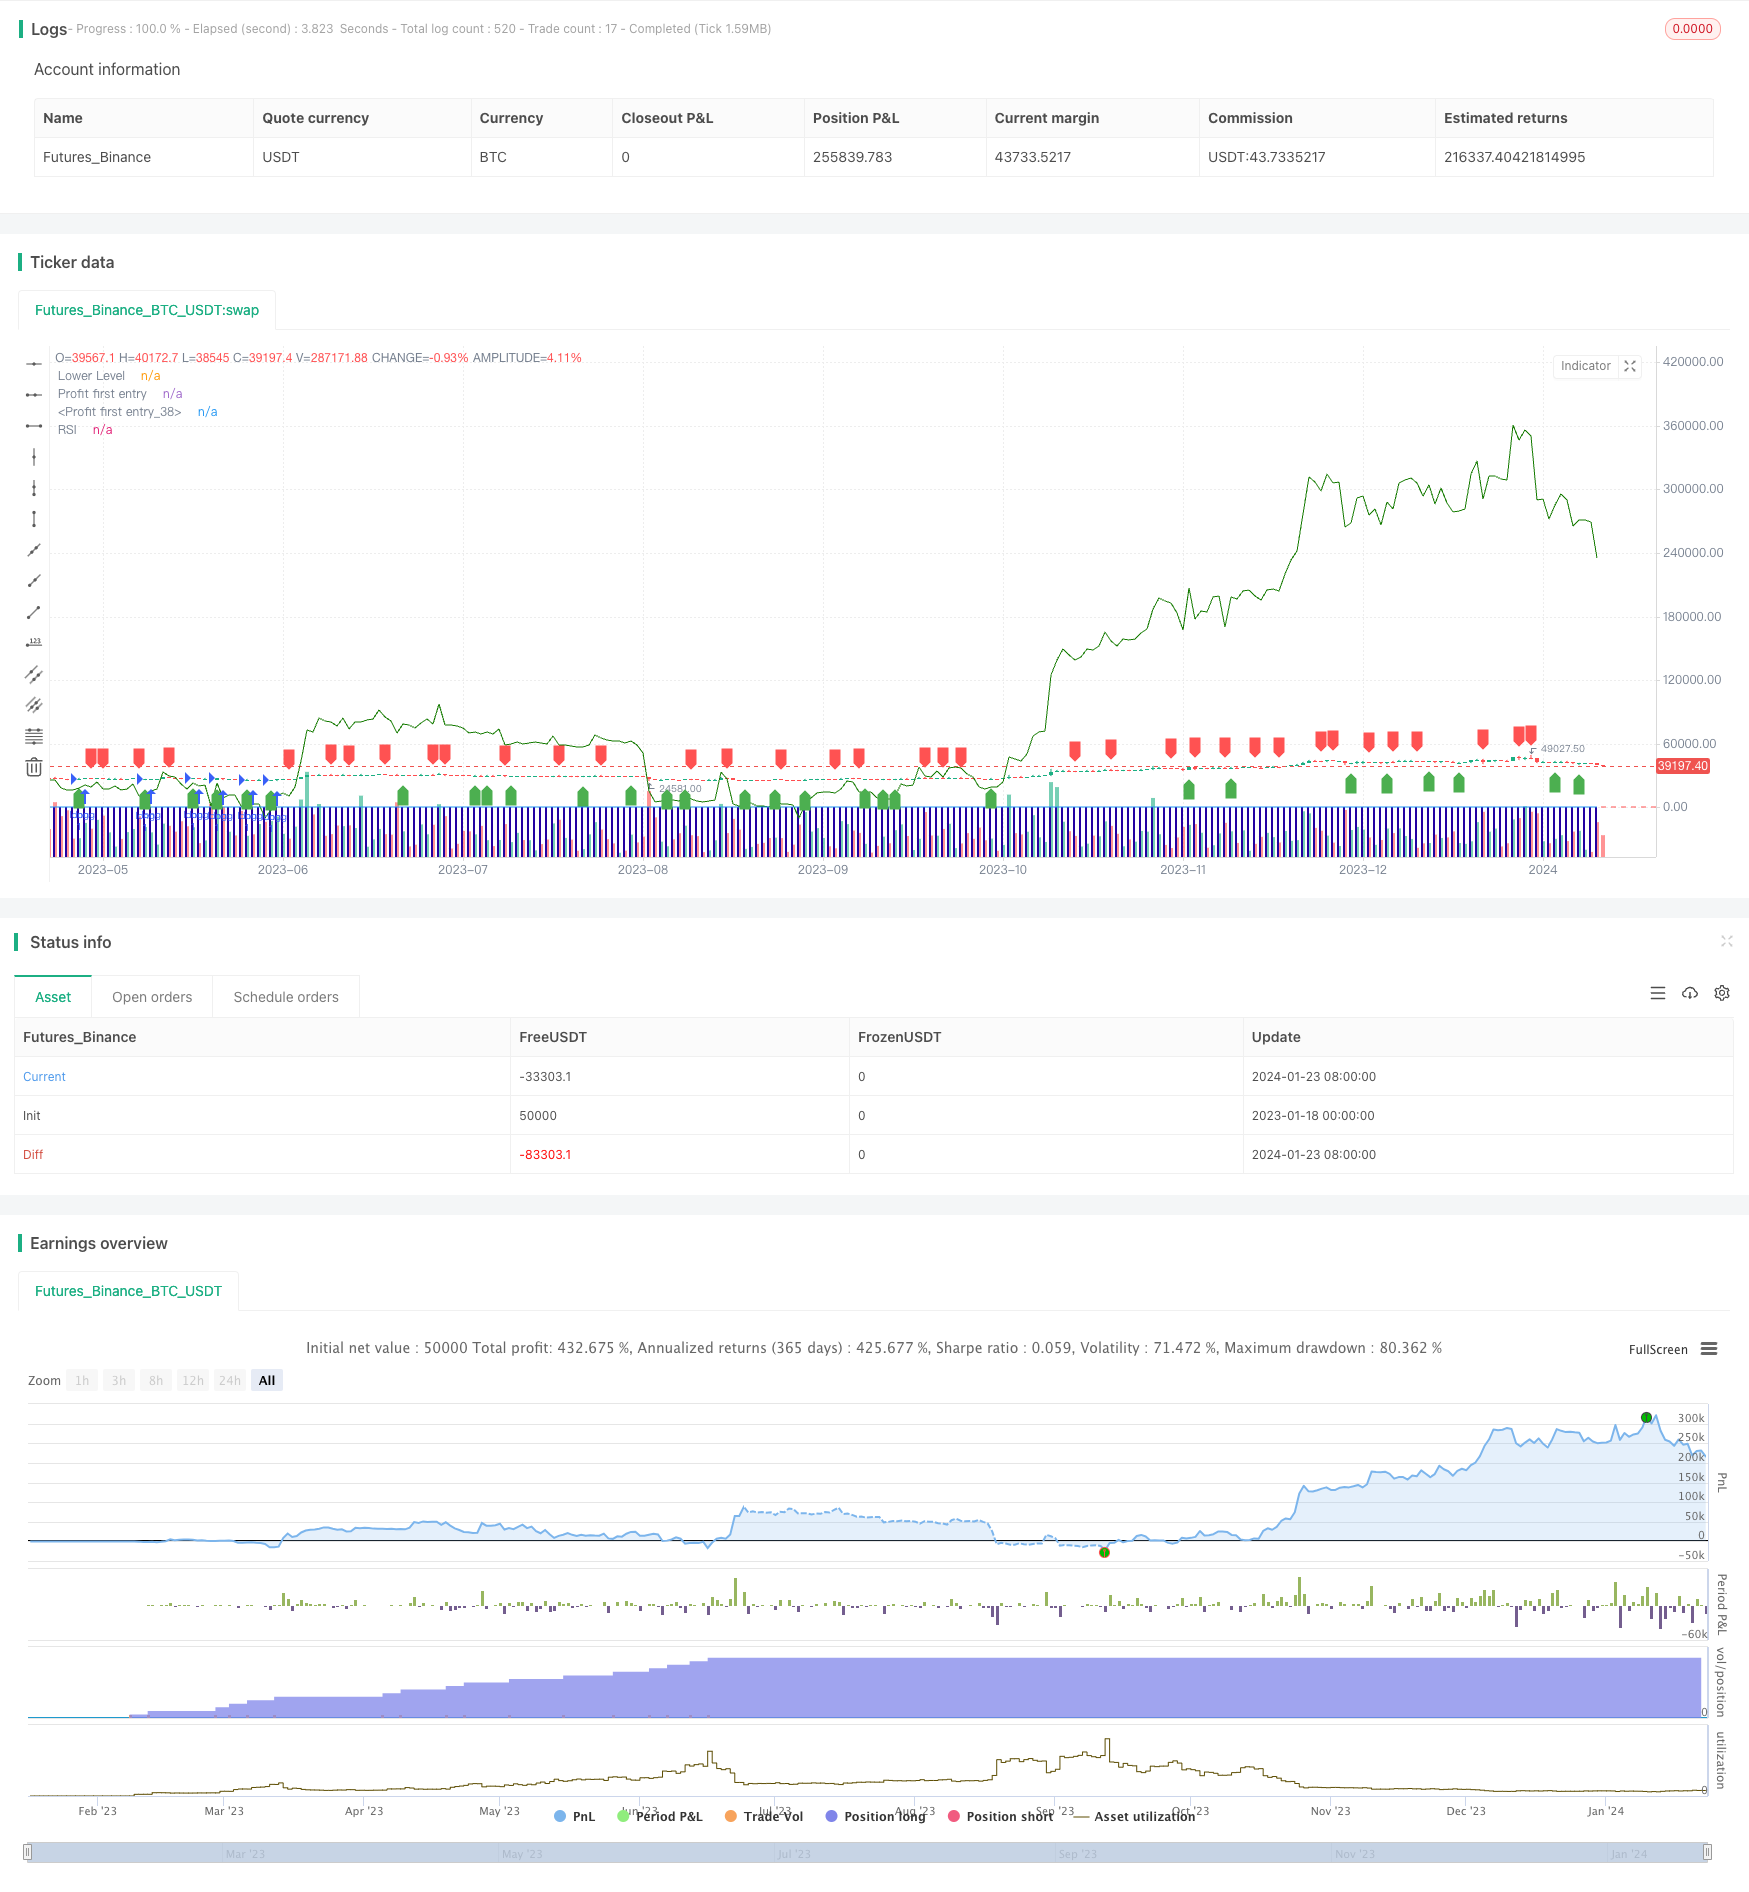
이 전략은 RSI 지표를 기반으로 한 단기 거래 전략을 고안하여 RSI 지표의 오버 바이 오버 셀 신호를 사용하여 낮은 가격과 높은 가격에 판매하여 초과 수익을 추구합니다. 이 전략의 원칙은 간단하고 구현하기 쉽습니다. 그러나 일정 수준의 거래 빈도가 있으며 장기 동향을 식별 할 수 없습니다.
전략 소스 코드
/*backtest
start: 2023-01-18 00:00:00
end: 2024-01-24 00:00:00
period: 1d
basePeriod: 1h
exchanges: [{"eid":"Futures_Binance","currency":"BTC_USDT"}]
*/

//@version=4
strategy("RSI Strategy", overlay=true,pyramiding = 1000)
rsi_period = 2
rsi_lower = 20
rsi_upper = 70

rsi_value = rsi(close, rsi_period)
buy_signal = crossover(rsi_value, rsi_lower)
sell_signal = crossunder(rsi_value, rsi_upper)
current_date1 =  input(defval=timestamp("01 Nov 2009 00:00 +0000"), title="stary Time", group="Time Settings")

current_date =  input(defval=timestamp("01 Nov 2023 00:00 +0000"), title="End Time", group="Time Settings")
investment_amount = 100000.0
start_time = input(defval=timestamp("01 Dec 2018 00:00 +0000"), title="Start Time", group="Time Settings")
end_time = input(defval=timestamp("30 Nov 2023 00:00 +0000"), title="End Time", group="Time Settings")

in_time = time >= start_time and time <= end_time
// Variable to track accumulation.
var accumulation = 0.0
out_time = time >= end_time

if (buy_signal )
    strategy.entry("long",strategy.long,qty= 1)
    accumulation += 1
if (out_time)
    strategy.close(id="long")

plotshape(series=buy_signal, title="Buy Signal", location=location.belowbar, color=color.green, style=shape.labelup)
plotshape(series=sell_signal, title="Sell Signal", location=location.abovebar, color=color.red, style=shape.labeldown)

plot(rsi_value, title="RSI", color=color.blue)
hline(rsi_lower, title="Lower Level", color=color.red)


plot(strategy.opentrades, style=plot.style_columns,
     color=#2300a1, title="Profit first entry")
plot(strategy.openprofit, style=plot.style_line,
     color=#147a00, title="Profit first entry")
// plot(strategy.position_avg_price, style=plot.style_columns,
//      color=#ca0303, title="Profit first entry")
// log.info(strategy.position_size * strategy.position_avg_price)