개요
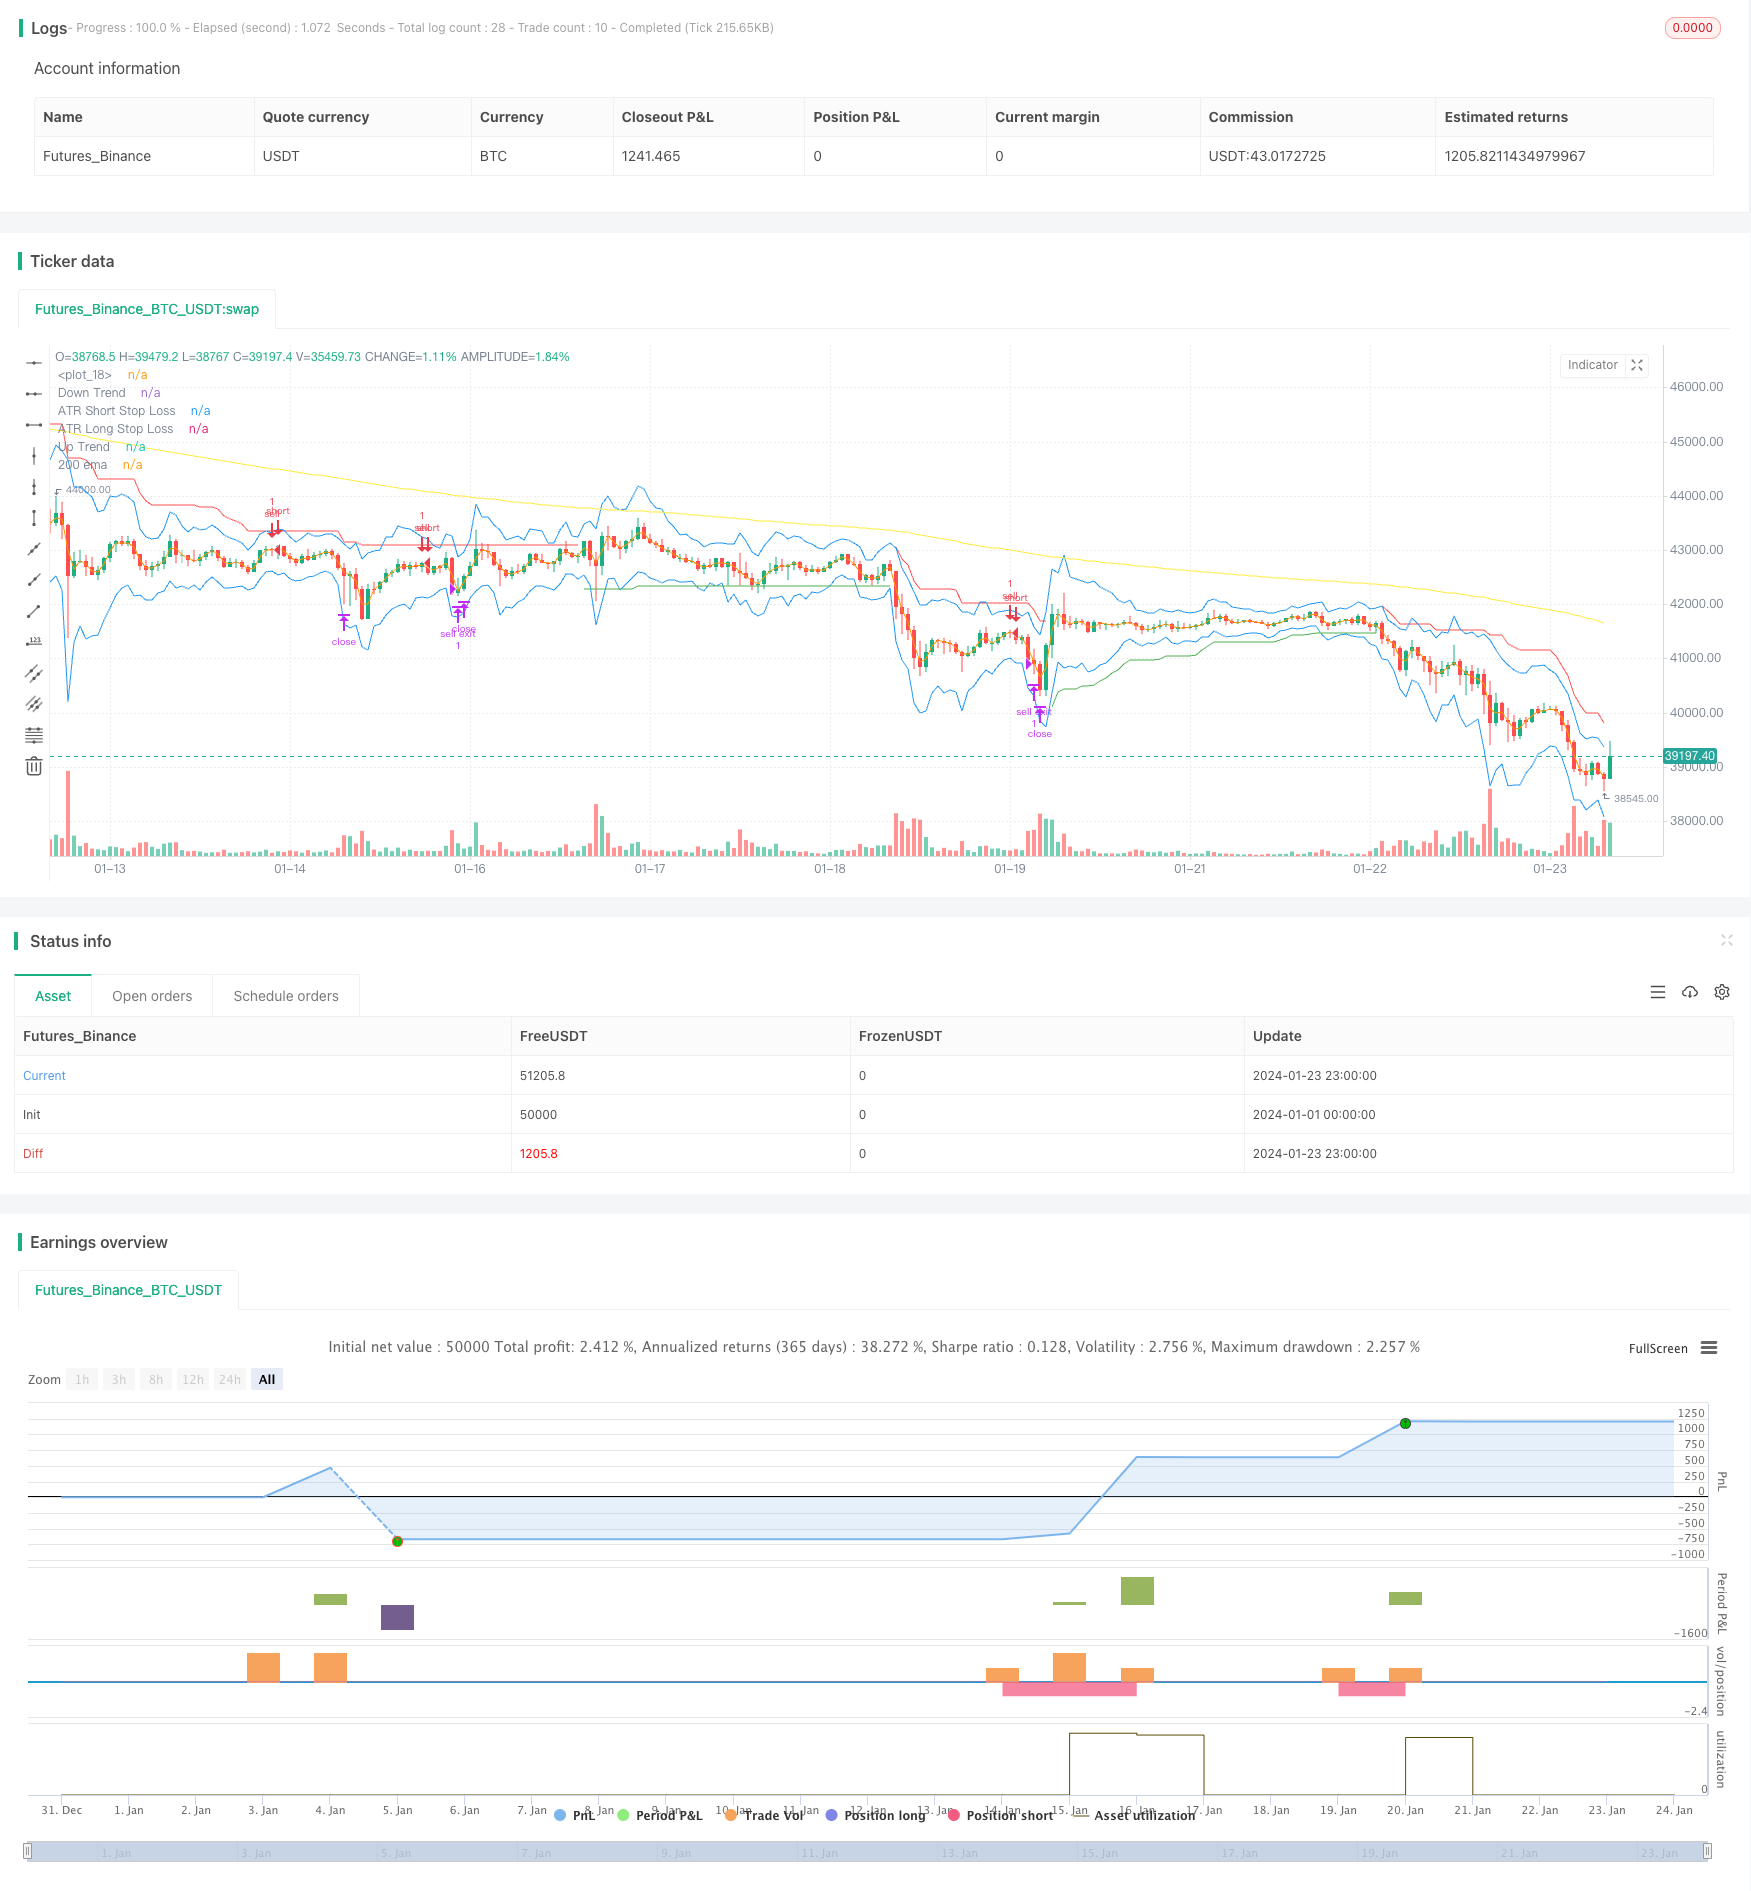
이것은 여러 가지 기술 지표들을 결합한 추적 스톱 손실 거래 전략이다. 주로 Supertrend, Stochastic, 200 일 이동 평균 및 ATR 스톱을 사용하여 거래 신호를 식별하고 스톱 손실 지점을 설정한다. 이 전략은 중장선 트렌드 거래에 적합하며 위험을 효과적으로 제어 할 수 있다.
전략 원칙
스토카스틱 K 선이 오버 바이 영역에서 내려가면, 슈퍼트렌드가 트렌드를 지시하면, 가격이 200일 이동 평균을 돌파하면, 더 많이 한다. 스토카스틱 K 선이 오버 세일 영역에서 올라갈 때, 슈퍼트렌드가 트렌드를 지시하면, 가격이 200일 이동 평균을 넘어갈 때, 더 많이 한다. 거래 후 ATR 지표 동적 설정 중지.
구체적으로, Stochastic K 값이 80을 넘으면 과매매 신호로 간주되며, Stochastic K 값이 20을 넘으면 과매매 신호로 간주됩니다. 슈퍼트렌드 지표는 가격 트렌드 방향을 결정합니다.
다중 신호 트리거 조건: Stochastic K 라인은 초상 구매 구역에서 아래로 ((<80)), Supertrend는 위쪽으로 지시, 가격은 200일 이동 평균보다 높습니다.
공백 신호 트리거 조건: Stochastic K 선이 초매 지역에서 상승 (> 20), Supertrend 지시 하향, 가격은 200 일 이동 평균 이하 ᅳ
입시 후, ATR을 설정하여 가격 변동 제어 위험을 추적하십시오. 다중 정지 손실은 최저 가격으로 ATR 값을 빼고 곱하기 인수; 공짜 정지 손실은 최고 가격으로 ATR 값을 더하여 곱하기 인수 ᄒ
전략적 이점
이 전략은 트렌드 방향과 입시 시기를 판단하는 여러 지표와 결합하여 가짜 신호를 효과적으로 필터링 할 수 있습니다. 동시에, ATR의 동적 추적 스톱로스는 시장의 변동 상황에 따라 위험을 제어하고 자금을 최대한 절약 할 수 있습니다.
간단한 이동 평균과 같은 트렌드 추적 전략에 비해 이 전략은 전환점을 더 잘 포착할 수 있다. 단일한 중지 방식에 비해 이 ATR 동적 중지 방식은 더 유연하다. 따라서, 이 전략은 전체적으로 더 좋은 위험-수익 비율을 가지고 있다.
전략적 위험
이 전략은 주로 지표 판단에 의존하며, 지표가 잘못된 신호를 발산하면 역작업으로 인한 손실이 발생할 수 있다. 또한, 충격적인 상황에서, 중지 손실은 자주 유발되어 손실이 발생할 수 있다.
또한, ATR 스톱은 변동에 따라 스톱 지점을 조정할 수 있지만, 스톱 스톱이 타격되는 확률을 완전히 피할 수는 없습니다. 가격 폭파가 발생하면 스톱 스톱이 직접적으로 유발 될 수 있습니다.
전략 최적화
이 전략은 다음과 같은 차원에서 최적화될 수 있습니다.
지표 매개 변수를 조정하여 구매/판매 신호의 정확도를 최적화한다. 예를 들어, 다른 매개 변수를 테스트할 수 있는 스토카스틱 지표, 또는 슈퍼트렌드 지표의 ATR 주기 및 곱하기 매개 변수를 조정한다.
다른 상쇄 방식의 효과를 테스트한다. 예를 들어 ATR 상쇄보다 더 유연한 적응형 지능형 상쇄 알고리즘을 시도하거나 상쇄가 이동 상쇄 지점을 따라가는 것을 고려한다.
필터링 조건을 추가하여 더 신뢰할 수 있는 상황에서 진입한다. 예를 들어 거래량 에너지 지표와 같은 필터를 추가하여 양이 부족할 때 지표에 따라 잘못된 진입을 피한다.
동적으로 포지션을 조정하는 것과 같은 자금 관리 전략을 최적화하십시오.
요약하다
Stochastic Supertrend는 여러 지표를 사용하여 트렌드 방향을 판단하고 ATR을 사용하여 위험을 제어합니다. 이 전략은 더 복잡한 시장 환경에 적응할 수 있도록 매개 변수를 조정하고, 중지 방법을 수정하고, 필터 조건을 추가하는 방법을 통해 지속적으로 최적화 할 수 있습니다.
/*backtest
start: 2024-01-01 00:00:00
end: 2024-01-24 00:00:00
period: 1h
basePeriod: 15m
exchanges: [{"eid":"Futures_Binance","currency":"BTC_USDT"}]
*/

// This source code is subject to the terms of the Mozilla Public License 2.0 at https://mozilla.org/MPL/2.0/
// © araamas

//@version=5
strategy("stoch supertrd atr 200ma", overlay=true, process_orders_on_close=true)
var B = 0
if strategy.position_size > 0 //to figure out how many bars away did buy order happen
    B += 1

if strategy.position_size == 0
    B := 0

atrPeriod = input(10, "ATR Length")
factor = input.float(3.0, "Factor", step = 0.01)

[supertrend, direction] = ta.supertrend(factor, atrPeriod)

bodyMiddle = plot((open + close) / 2, display=display.none)
upTrend = plot(direction < 0 ? supertrend : na, "Up Trend", color = color.green, style=plot.style_linebr)
downTrend = plot(direction < 0? na : supertrend, "Down Trend", color = color.red, style=plot.style_linebr)

ema = ta.ema(close, 200)
plot(ema, title="200 ema", color=color.yellow)

b = input.int(defval=14, title="length k%")
d = input.int(defval=3, title="smoothing k%")
s = input.int(defval=3, title="smoothing d%")
smooth_k = ta.sma(ta.stoch(close, high, low, b), d)
smooth_d = ta.sma(smooth_k, s)

////////////////////////////////////////////////////////////////////////////////
length = input.int(title="Length", defval=12, minval=1)
smoothing = input.string(title="Smoothing", defval="SMA", options=["RMA", "SMA", "EMA", "WMA"])
m = input(1.5, "Multiplier")
src1 = input(high)
src2 = input(low)
pline = input(true, "Show Price Lines")
col1 = input(color.blue, "ATR Text Color")
col2 = input(color.teal, "Low Text Color",inline ="1")
col3 = input(color.red, "High Text Color",inline ="2")

collong = input(color.teal, "Low Line Color",inline ="1")
colshort = input(color.red, "High Line Color",inline ="2")

ma_function(source, length) =>
	if smoothing == "RMA"
		ta.rma(source, length)
	else
		if smoothing == "SMA"
			ta.sma(source, length)
		else
			if smoothing == "EMA"
				ta.ema(source, length)
			else
				ta.wma(source, length)

a = ma_function(ta.tr(true), length) * m
x = ma_function(ta.tr(true), length) * m + src1
x2 = src2 - ma_function(ta.tr(true), length) * m

p1 = plot(x, title = "ATR Short Stop Loss", color=color.blue)
p2 = plot(x2, title = "ATR Long Stop Loss", color= color.blue)


///////////////////////////////////////////////////////////////////////////////////////////////

shortCondition = high < ema and direction == 1 and smooth_k > 80
if (shortCondition) and strategy.position_size == 0
    strategy.entry("sell", strategy.short)

longCondition = low > ema and direction == -1 and smooth_k < 20
if (longCondition) and strategy.position_size == 0
    strategy.entry("buy", strategy.long)

g = (strategy.opentrades.entry_price(0)-x2) * 2
k = (x - strategy.opentrades.entry_price(0)) * 2

if strategy.position_size > 0
    strategy.exit(id="buy exit", from_entry="buy",limit=strategy.opentrades.entry_price(0) + g, stop=x2)

if strategy.position_size < 0
    strategy.exit(id="sell exit", from_entry="sell",limit=strategy.opentrades.entry_price(0) - k, stop=x)

//plot(strategy.opentrades.entry_price(0) - k, color=color.yellow)
//plot(strategy.opentrades.entry_price(0) + g, color=color.red)