RSI 지표 롱 앤 숏 분리 거래 전략

개요
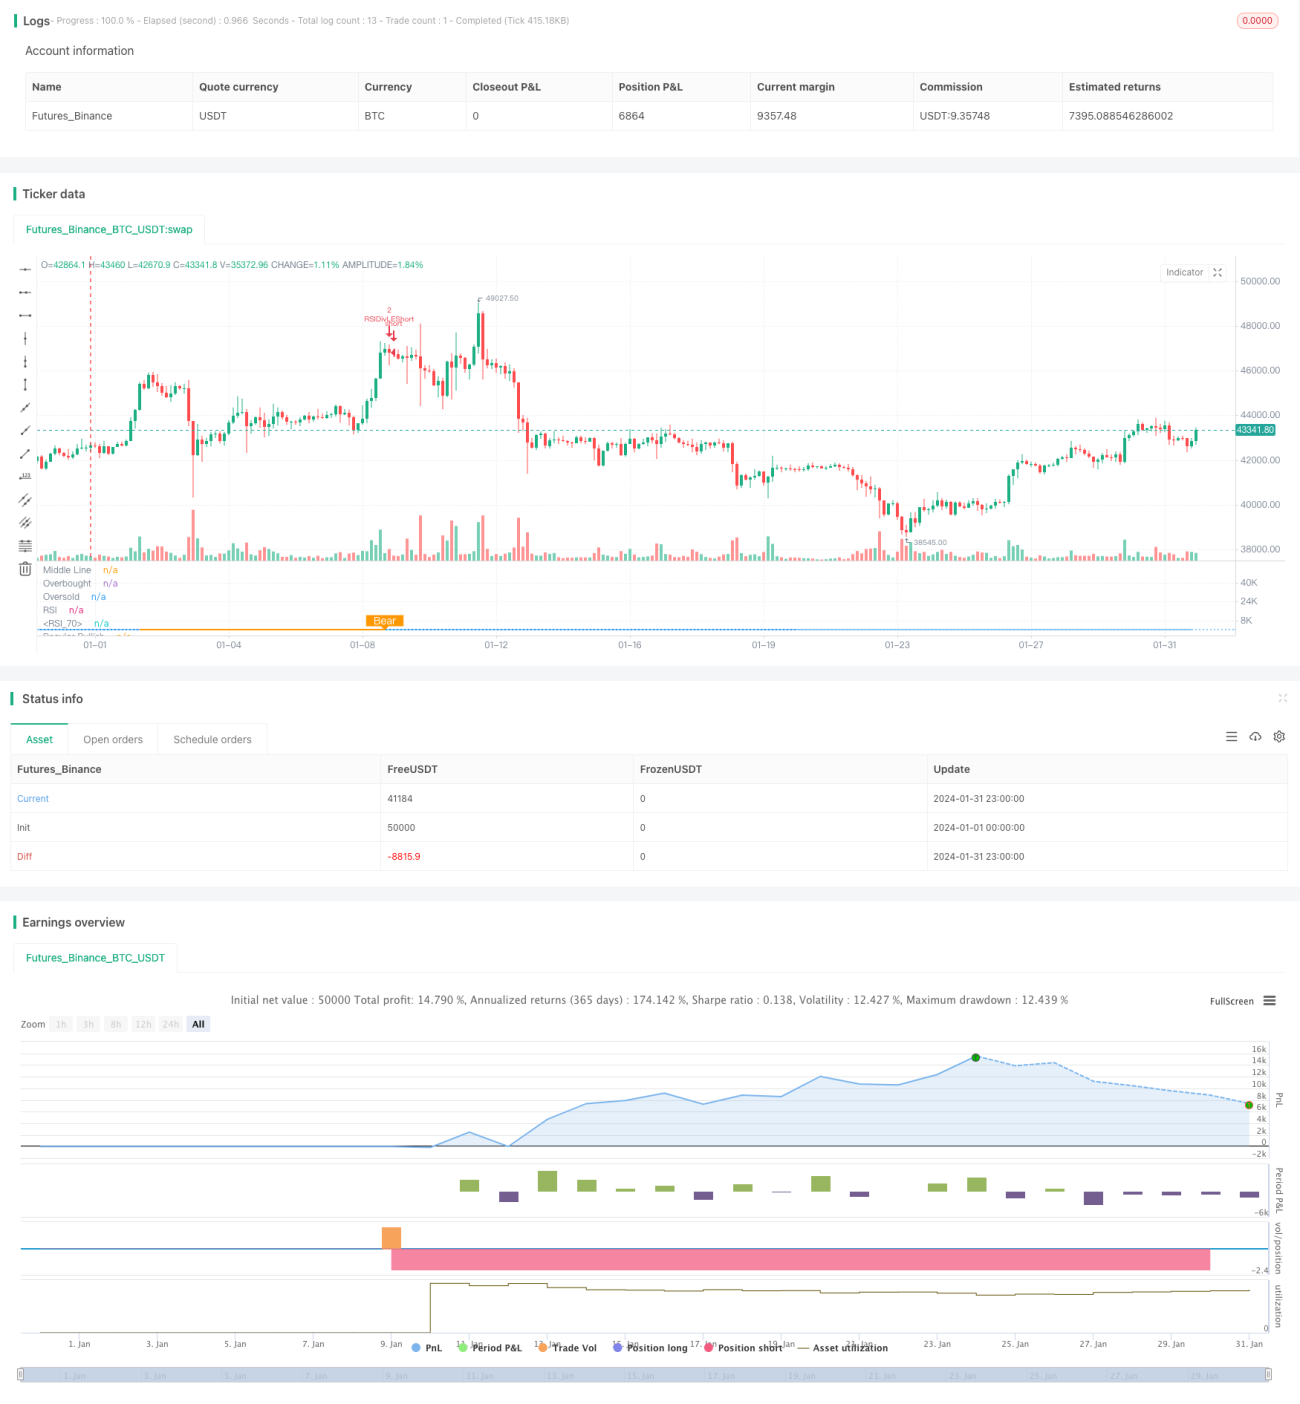
이 전략은 RSI 지표를 통해 다공간 분리 현상을 식별하고, 이에 따라 거래 결정을 한다. 그것의 핵심 아이디어는 가격이 새로운 낮은 그러나 RSI 지표가 새로운 높은 때, <unk> 다목적 분리 <unk> 신호를 구성하고, 바닥이 형성되어 있음을 나타냅니다. 더 많이; 가격이 새로운 높은 그러나 RSI 지표가 새로운 낮은 때, <unk> 공허 헤드 분리 <unk> 신호를 구성하고, 꼭대기가 형성되어 있음을 나타냅니다.
전략 원칙
이 전략은 주로 RSI 지표를 사용하여 가격과 RSI 사이의 다공간 분리 현상을 식별합니다. 구체적인 방법은 다음과 같습니다:
- RSI 지표 변수는 13이며, 소스 데이터는 종전 가격입니다.
- 다중 헤드 분리가 정의된 좌우 회귀 범위는 14일, 우측 회귀 범위는 2일
- 공허 분리가 정의된 좌우 회귀 범위는 47일, 우측 회귀 범위는 1일
- 가격이 더 낮은 하락을 기록하지만 RSI 지표가 더 높은 하락을 기록하면 다중 헤드 분리 조건이 충족되어 다중 신호가 발생합니다.
- 가격이 더 높은 고점을 기록하지만 RSI 지표가 더 낮은 고점을 기록하면 하위 분리 조건이 충족되어 하위 신호가 발생합니다.
가격과 RSI 지표 사이의 다공간 분리 현상을 식별함으로써 가격 움직임의 전환점을 사전에 잡을 수 있으며, 이에 따라 거래 결정을 내릴 수 있습니다.
전략적 이점
이 전략은 다음과 같은 장점을 가지고 있습니다.
- 가격과 RSI 지표 사이의 다중 격리 현상을 식별하여 가격 동향의 전환점을 미리 판단하여 거래 기회를 잡을 수 있습니다.
- 지표 분석을 이용하기 때문에 주관적인 감정에 영향을 받지 않습니다.
- 고정 회귀 간격 식별 분리 현상을 적용하여 자주 调参을 피합니다.
- 일일 RSI와 같은 추가 조건과 결합하여 잘못된 거래의 가능성을 줄일 수 있습니다.
위험과 해결책
이 전략에는 위험도 있습니다.
-
RSI 지표의 이탈은 가격의 즉각적인 반전을 예고하지 않으며, 시간 차이가 있을 수 있으며, 이는 정지 손실이 유발되는 위험을 초래할 수 있습니다. 해결책은 정지 손실을 적절히 느슨하게 하고, 가격에 분리 신호를 확인하는 데 충분한 시간을 주는 것입니다.
-
분리 현상이 장기간 지속되면 위험도 증가한다. 해결책은 더 장기간 일선 또는 둘레 RSI를 필터링 조건으로 결합하는 것이다.
-
너무 작은 격차는 트렌드 회전을 확인하지 못하며, 더 큰 RSI 격차를 찾기 위해 회귀 간격을 적절히 확대해야 합니다.
전략 최적화 방향
이 전략은 다음과 같은 방향으로 최적화될 수 있습니다.
-
RSI 변수를 최적화하여 최적의 조합을 찾습니다.
-
다공간 분리 현상을 식별하기 위해 MACD, KD 등 다른 기술 지표를 시도하십시오.
-
적절한 불안정 기간 필터링 조건을 추가하여 불안정 기간의 잘못된 거래를 방지하십시오.
-
더 많은 시간 주기의 RSI 지표와 함께 최적의 조합 신호를 찾으십시오.
요약하다
RSI 다공간 분리 거래 전략은 RSI 지표와 가격 사이의 다공간 분리 현상을 식별하여 가격 움직임의 전환점을 판단하여 거래 신호를 구축합니다. 이 전략은 간단하고 실용적이며, 매개 변수 설정을 최적화하고 필터 조건을 추가하여 수익 가능성을 더욱 높일 수 있습니다.
- 1