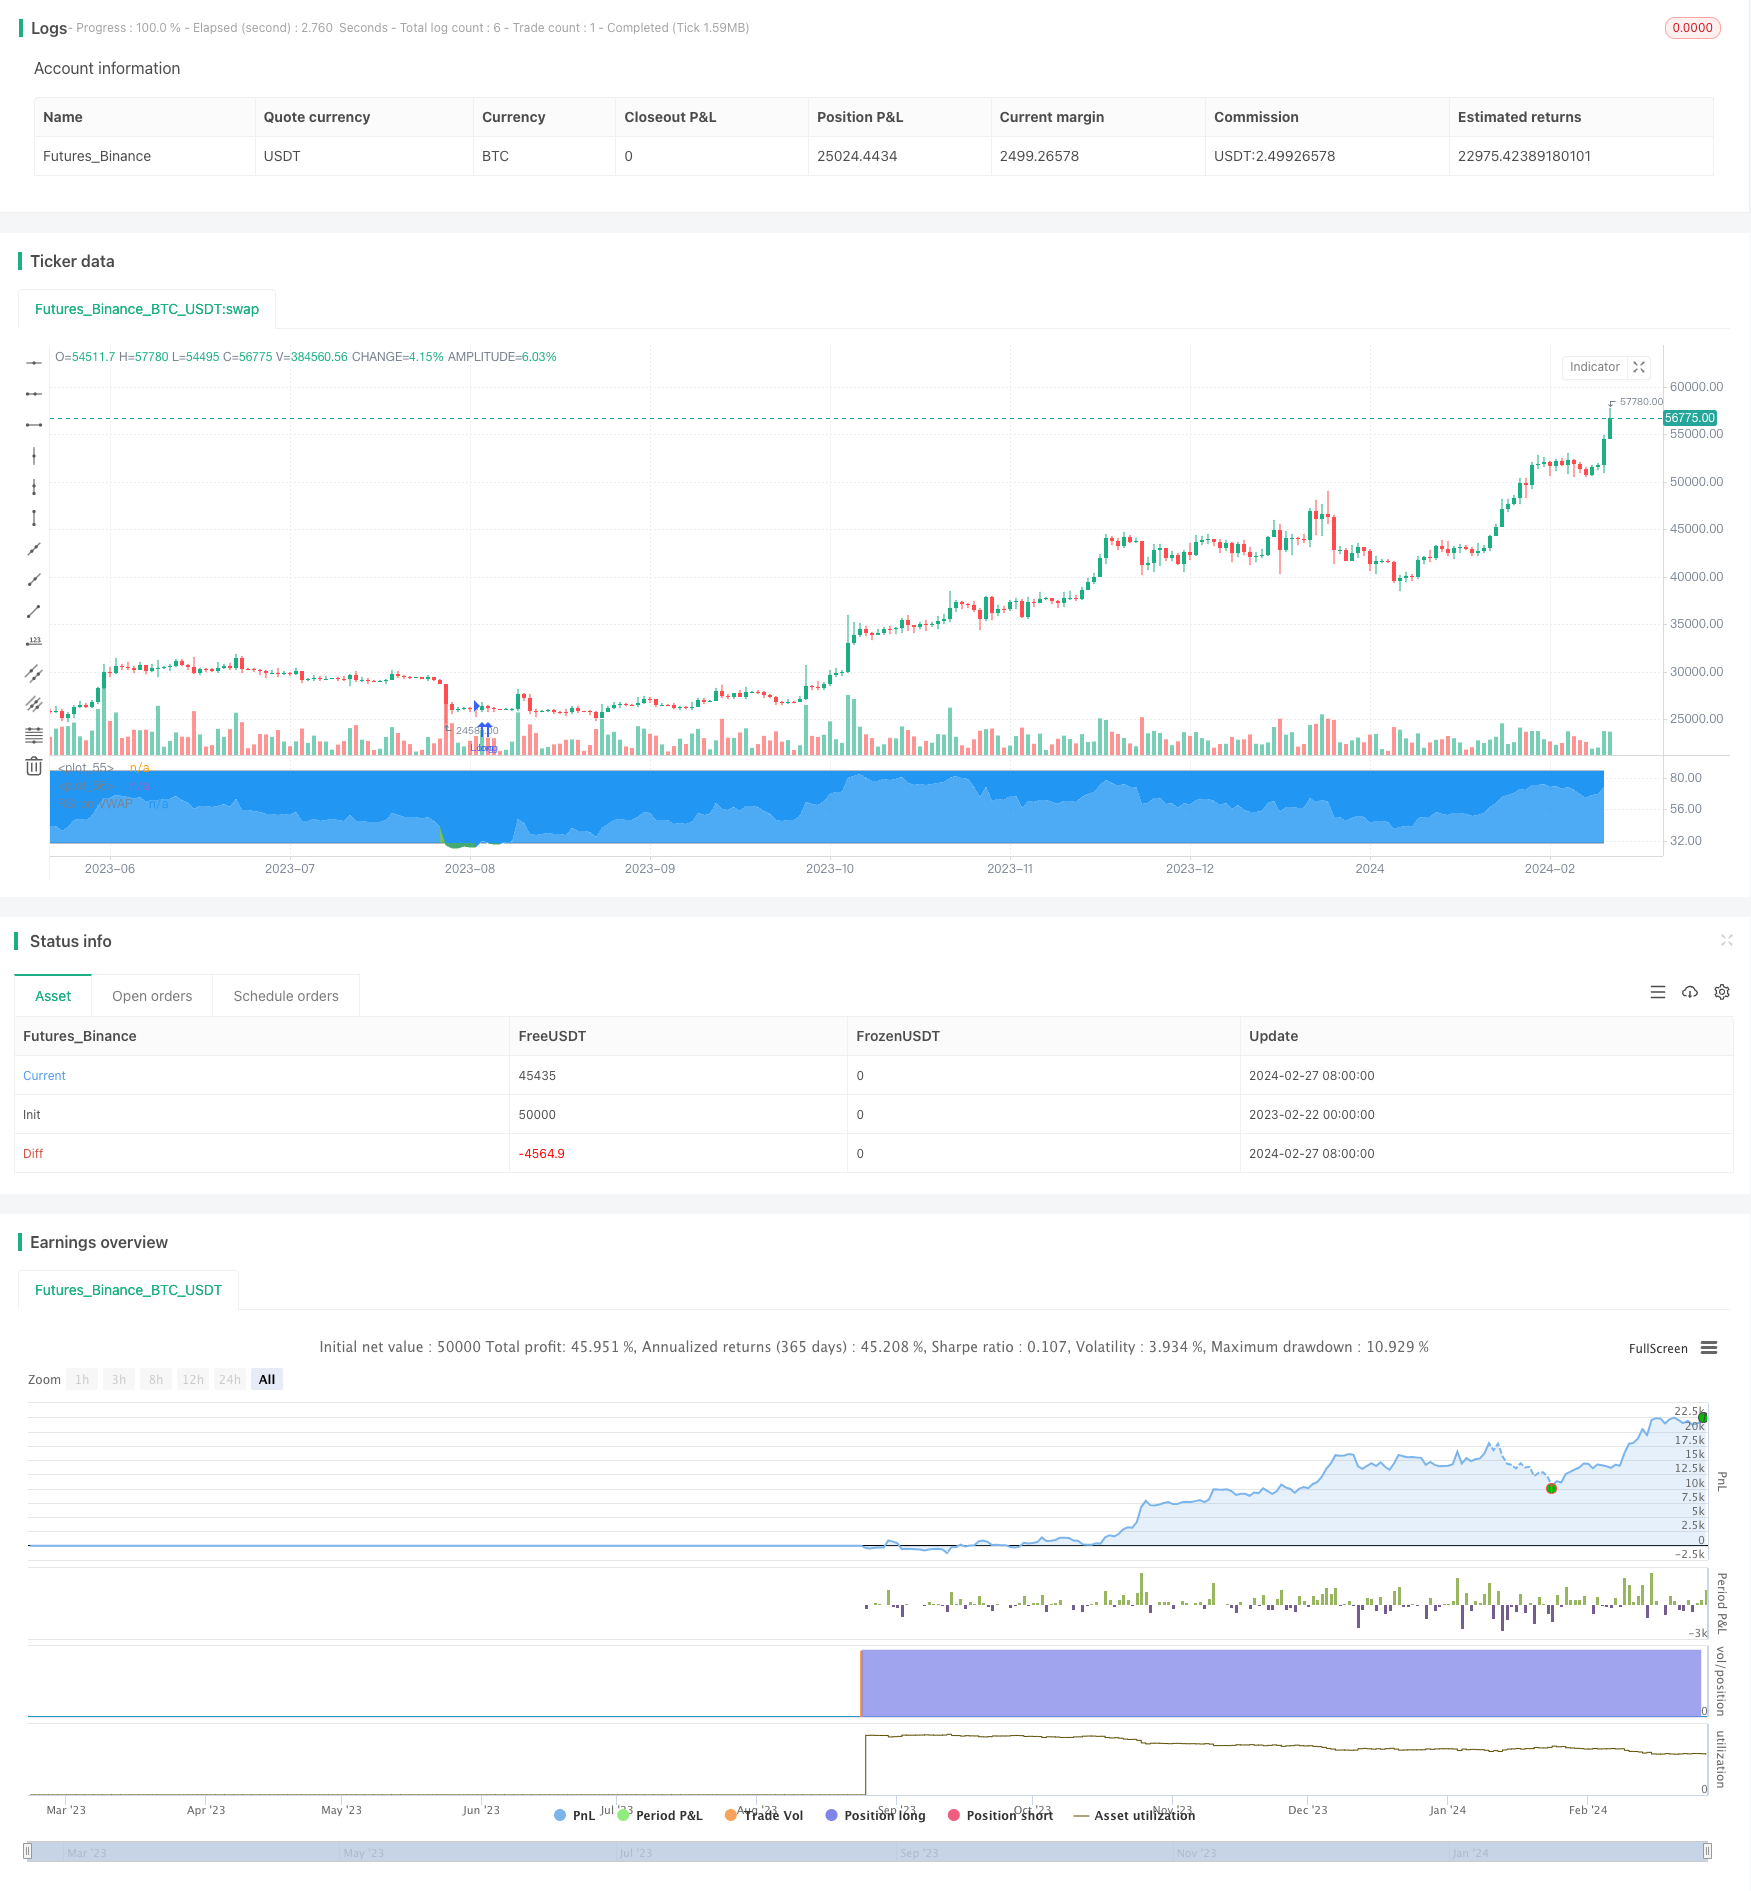
개요
이 전략은 RSI 지표에 기반한 다중 하위 자동 거래 시스템을 설계했다. 이 시스템은 RSI가 초과할 때 자동으로 입문하여 더 많은 하위권을 취하고 특정 조건이 유발되면 적극적으로 손실을 중지할 수 있다.
전략 원칙
이 전략은 RSI 지표를 사용하여 시장의 과매매 현상을 판단한다. 구체적으로, RSI 지표가 설정된 과매매 라인보다 낮을 때, 더 많은 입장을 취하고, RSI 지표가 설정된 과매매 라인보다 높을 때, 더 많은 입장을 취한다.
또한, 이 전략은 출장 조건을 설정합니다. RSI 지표가 다시 오버 바이 라인을 통과하면, 더 많은 단위의 손실을 유발합니다. 마찬가지로, RSI 지표가 다시 오버 세일 라인을 통과하면, 빈 단위의 손실을 유발합니다.
우위 분석
이 전략의 가장 큰 장점은 RSI 지표를 사용하여 시장의 과매매 현상을 판단하는 데 있습니다. 이것은 양적 거래에서 더成熟한 신뢰할 수있는 기술 분석 방법입니다. 간단한 이동 평균 전략에 비해 이 전략은 시장의 전환점을 더 정확하게 포착하여 거래 시스템의 수익 공간을 향상시킬 수 있습니다.
또한, 이 전략은 출장 조건을 설정하여 한방향 시장에서 가져오는 손실 위험을 효과적으로 제어 할 수 있습니다. 이것은 전통적인 추세를 따르는 전략과 확연한 대조를 형성하여 포지션 포장이 발생하는 상황을 피할 수 있습니다.
위험 분석
이 전략의 가장 큰 위험은 RSI 지표에서 나오는 거래 신호가 잘못 판단될 수 있다는 것입니다. 어떤 기술적 지표도 시장의 움직임을 100% 정확하게 판단할 수 없습니다. RSI 지표도 예외는 아닙니다. RSI 지표가 오버 바이 오버 셀 신호를 잘못 판단하면 이 전략은 잘못된 입장을 초래합니다.
이러한 위험을 줄이기 위해 이 전략은 스톱로스 라인을 설정한다. 그러나 일방적인 상황에서는 스톱로스 라인이 촉발될 확률이 더 크다. 이 시점에서는 수동 개입이 필요하며, 잘못된 위치를 수동으로 닫는다.
최적화 방향
이 전략에는 더 많은 최적화 가능성은 있습니다:
여러 지표가 결합되어 입구를 확인하는 신호를 통해 RSI 지표가 개별적으로 판단되는 잘못된 입구를 피할 수 있다. 예를 들어, 이동 평균 지표 등이 포함될 수 있다.
RSI 변수를 최적화하여 더 적합한 RSI 길이를 찾아 오버 바이 오버 소드를 더 정확하게 판단합니다.
손실을 최대한 방지하면서도 너무 민감하지 않도록 스톱 라인 설정을 최적화하십시오.
요약하다
전반적으로, RSI 기반의 자동 거래 전략은 과매매 및 과매매 시장 상황을 효과적으로 식별하는 장점이 있습니다. RSI 극적 수준 동안 다수 및 공수 위치에 진입하여 시장의 역전으로부터 이익을 얻으려는 것입니다.
/*backtest
start: 2023-02-22 00:00:00
end: 2024-02-28 00:00:00
period: 1d
basePeriod: 1h
exchanges: [{"eid":"Futures_Binance","currency":"BTC_USDT"}]
*/


//@version=4

strategy("Soran Strategy 2 - LONG SIGNALS", pyramiding=1, initial_capital=1000, default_qty_type=strategy.percent_of_equity, default_qty_value=50, overlay=false)


// ----------------- Inputs ----------------- //

reso = input(title="Resolution", type=input.resolution, defval="")
length = input(20, title="RSI Length", type=input.integer)
ovrsld = input(30, "RSI Oversold level", type=input.float)
ovrbgt = input(85, "RSI Overbought level", type=input.float)
lateleave = input(28, "Number of candles", type=input.integer)
// lateleave : numbers of bars in overbought/oversold zones where the position is closed. The position is closed when this number is reached or when the zone is left (the first condition).

// best parameters BTCUSDTPERP M15 : 20 / 30 / 85 / 28


stratbull = input(title="Enter longs ?", type = input.bool, defval=true)
stratbear = input(title="Enter shorts ?", type = input.bool, defval=true)

stratyear = input(2020, title = "Strategy Start Year")
stratmonth = input(1, title = "Strategy Start Month")
stratday = input(1, title = "Strategy Start Day")
stratstart = timestamp(stratyear,stratmonth,stratday,0,0)


// --------------- Laguerre ----------------- //

laguerre = input(title="Use Laguerre on RSI ?", type=input.bool, defval=false)
gamma = input(0.06, title="Laguerre Gamma")

laguerre_cal(s,g) =>
    l0 = 0.0
    l1 = 0.0
    l2 = 0.0
    l3 = 0.0
    l0 := (1 - g)*s+g*nz(l0[1])
    l1 := -g*l0+nz(l0[1])+g*nz(l1[1])
    l2 := -g*l1+nz(l1[1])+g*nz(l2[1])
    l3 := -g*l2+nz(l2[1])+g*nz(l3[1])
    (l0 + 2*l1 + 2*l2 + l3)/6


// ---------------- Rsi VWAP ---------------- //

rsiV = security(syminfo.tickerid, reso, rsi(vwap(close), length))

rsiVWAP = laguerre ? laguerre_cal(rsiV,gamma) : rsiV


// ------------------ Plots ----------------- //

prsi = plot(rsiVWAP, color = rsiVWAP>ovrbgt ? color.red : rsiVWAP<ovrsld ? color.green : color.white, title="RSI on VWAP", linewidth=1, style=plot.style_line)
hline = plot(ovrbgt, color = color.gray, style=plot.style_line)
lline = plot(ovrsld, color = color.gray, style=plot.style_line)
fill(prsi,hline, color = rsiVWAP > ovrbgt ? color.red : na, transp = 30)
fill(prsi,lline, color = rsiVWAP < ovrsld ? color.green : na, transp = 30)


// ---------------- Positions: only shows Buy and close Buy positions --------------- //

timebull = stratbull
timebear = stratbear

strategy.entry("Long", true, when = timebull and crossover(rsiVWAP, ovrsld), comment="")
strategy.close("Long", when = timebull and crossover(rsiVWAP, ovrbgt)[lateleave] or crossunder(rsiVWAP, ovrbgt), comment="")