HALFTREND + HEMA + SMA (Strategi Isyarat Palsu)
Penulis:ChaoZhang, Tarikh: 2022-05-12 17:36:04Tag:SMAWMAEMA
=== Pengantar dan Kredit ===
Skrip ini adalah gabungan 3 penunjuk untuk mencipta semula strategi FALSE SIGNAL
=== STRATEGI ===
Tetapan lalai sudah seperti FALSE SIGNAL
- HEMA mesti berada di atas SMA.
- Badan lilin mesti berada sepenuhnya di atas HEMA (wick boleh menyentuh HEMA, tetapi terdapat pilihan untuk mengaktifkan / mematikan penapis ini).
- Halftrend mesti mencetuskan anak panah BUY (warna aqua melihat ke atas).
FOR SHORTS (red background menunjukkan entri SHORT).
- HEMA* mesti di bawah SMA.
- Badan lilin mesti berada di bawah HEMA (wick boleh menyentuh HEMA, tetapi terdapat pilihan untuk mengaktifkan / mematikan penapis ini).
- Halftrend mesti mencetuskan anak panah SELL (warna oren yang melihat ke bawah). * FALSE SIGNAL mencadangkan untuk menukar tempoh HEMA kepada 40 untuk seluar pendek dan bukannya 50.
Sila lihat saluran YouTube FALSE SIGNAL untuk maklumat lanjut.
=== Peningkatan Umum === Tingkatkan ke PineScript 5. Beberapa peningkatan prestasi. SMA mengambil warna GREEN apabila hanya LONGs harus diambil, warna MERAH untuk SHORTS. HEMA mengambil warna AQUA apabila hanya LONGs harus diambil, warna ORANGE untuk SHORTS.
=== Nota Peribadi === Jangka masa yang tinggi (1 jam +) boleh mengambil masa yang lama untuk mencetuskan entri, bersabar atau gunakan jangka masa yang lebih rendah.
Terima kasih sekali lagi kepada penulis petunjuk yang menyusun skrip ini dan kepada FALSE SINGAL untuk membuat strategi ini.
Ujian belakang
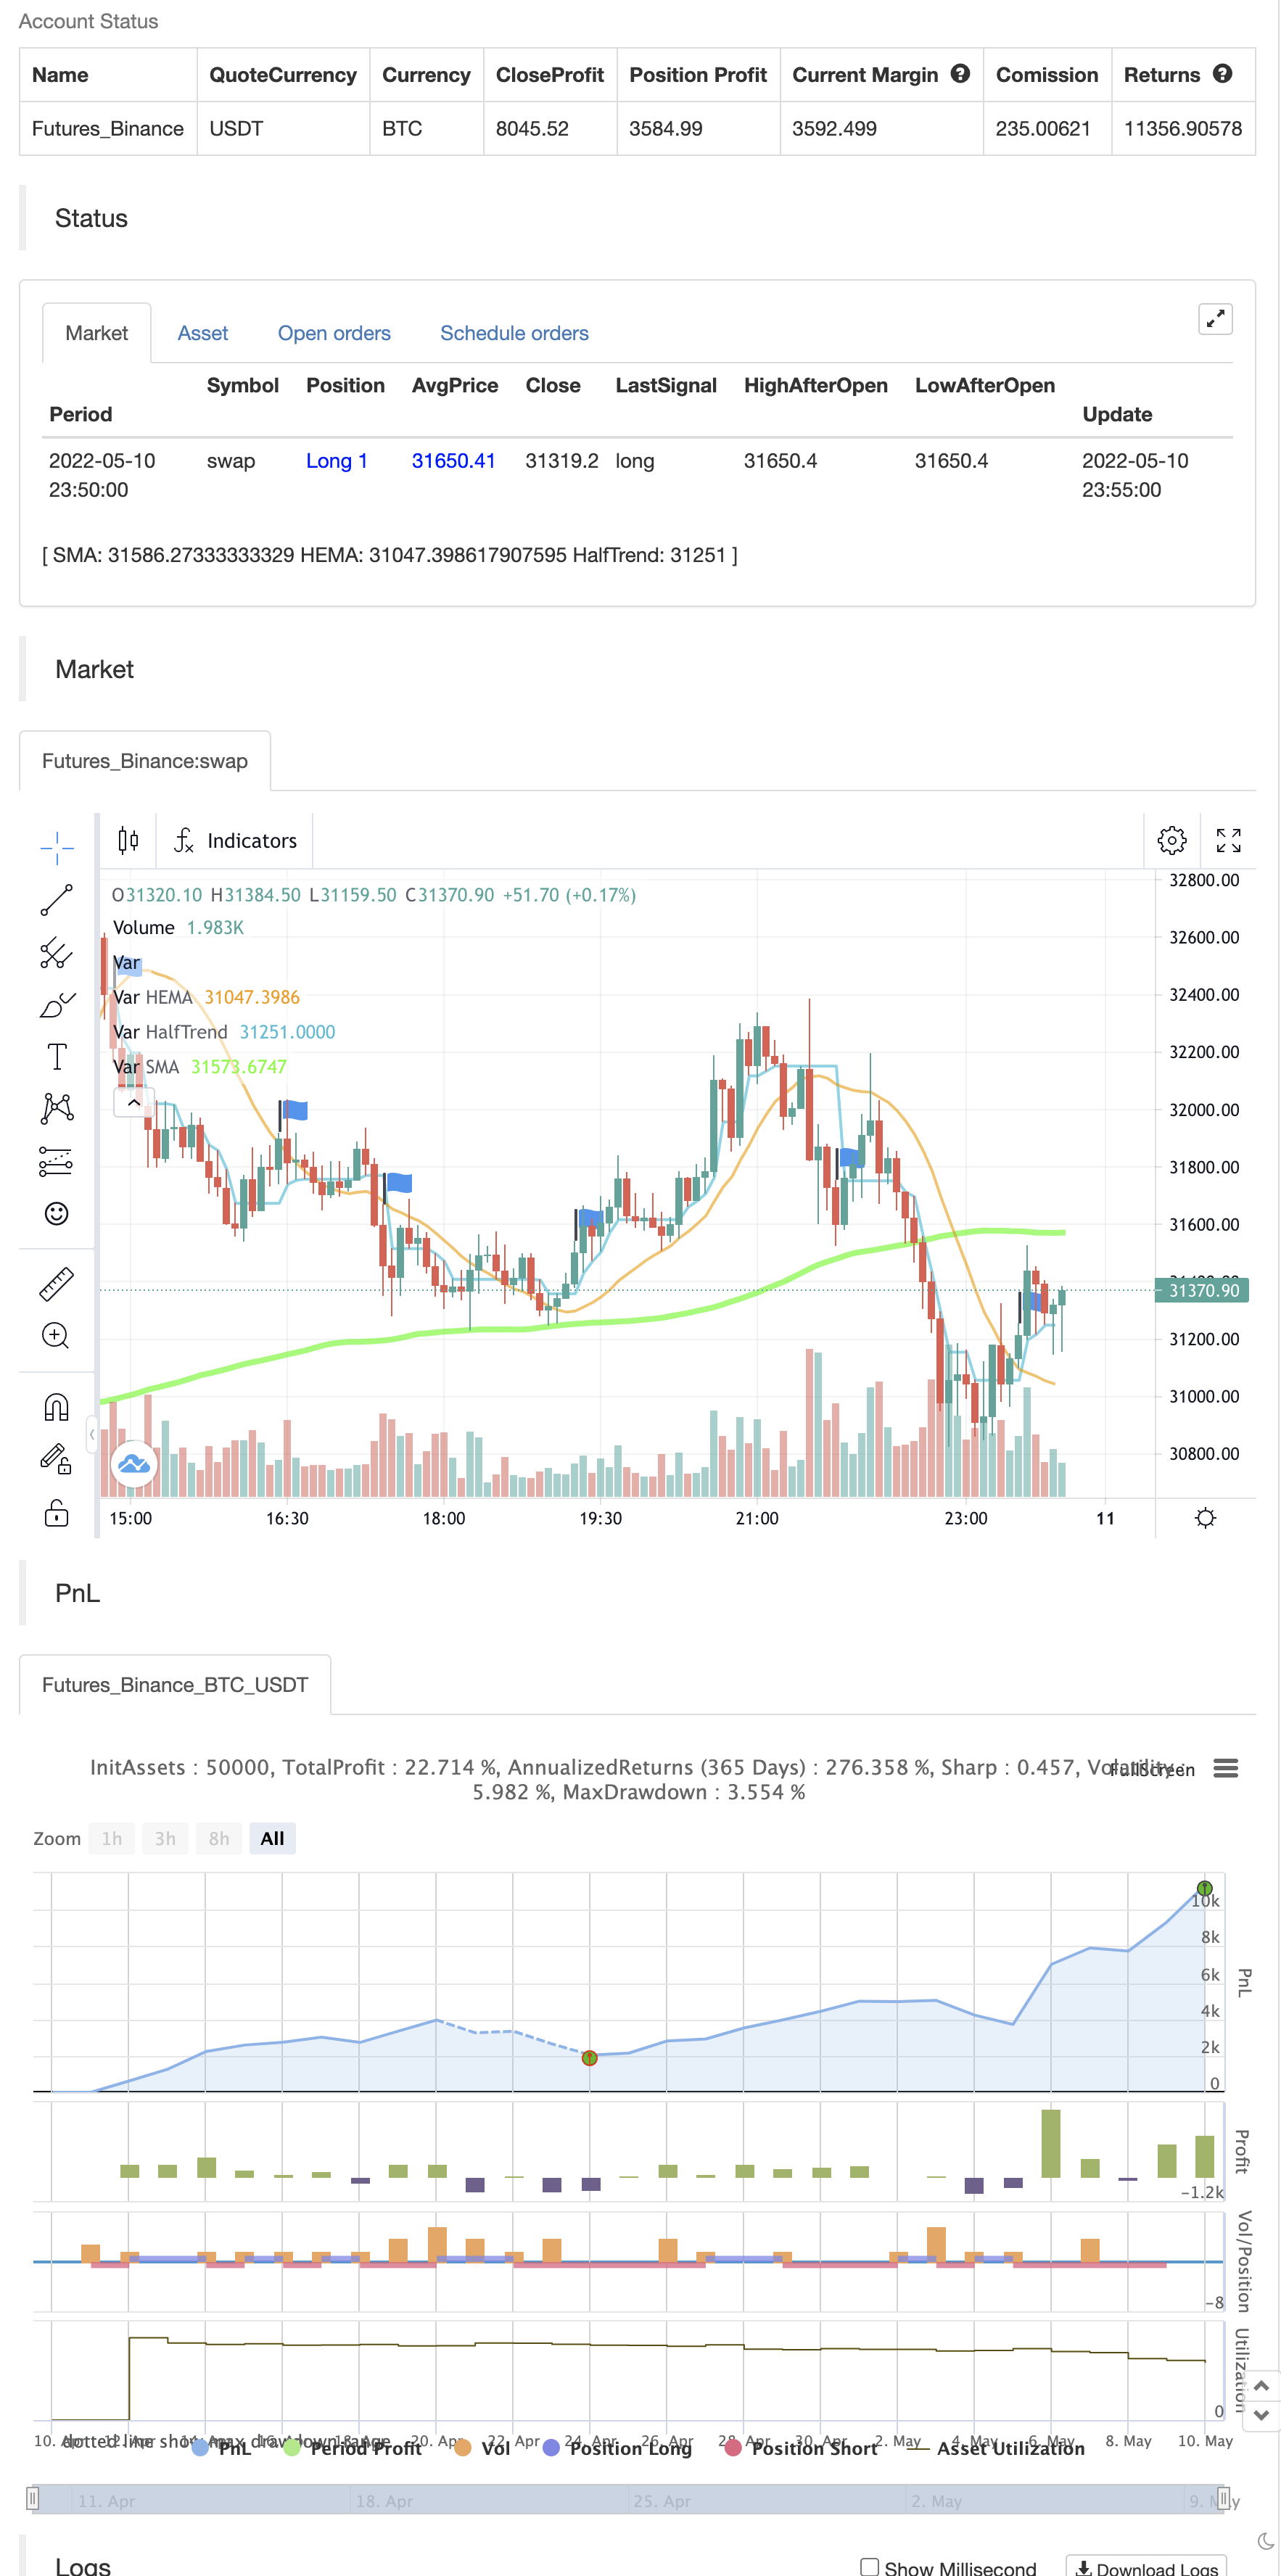
/*backtest
start: 2022-04-11 00:00:00
end: 2022-05-10 23:59:00
period: 5m
basePeriod: 1m
exchanges: [{"eid":"Futures_Binance","currency":"BTC_USDT"}]
*/

// Source code is subject to the terms of the Mozilla Public License 2.0 at https://mozilla.org/MPL/2.0/ - © José Manuel Gassin Pérez-Traverso
// Credit for each indicator belongs to its author.

//@version=5
indicator(title="HALFTREND + HEMA + SMA (FALSE SIGNAL)", shorttitle="HALFTREND + HEMA + SMA (FALSE SIGNAL)", overlay=true)


//== Constantes
c_negro               = color.rgb(0, 0, 0, 0)
c_verde_radiactivo    = color.rgb(0, 255, 0, 0)
c_verde               = color.rgb(0, 128, 0, 0)
c_verde_oscuro        = color.rgb(0, 80, 0, 0)
c_rojo_radiactivo     = color.rgb(255, 0, 0, 0)
c_rojo                = color.rgb(128, 0, 0, 0)
c_rojo_oscuro         = color.rgb(80, 0, 0, 0)
c_red_t               = color.new(color.red, 90)
c_amarillo            = color.rgb(255, 255, 0, 0)
noneColor             = color.new(color.white, 100)


//== Estrategia
GRUPO_ESTRATEGIA = "Strategy"
ESTRATEGIA_vela_completa_fuera_hema = input.bool(title="Full candle must be outside the HEMA / Wicks can touch the HEMA but body must be out", defval=false, group=GRUPO_ESTRATEGIA)

//== Simple Moving Average (SMA)
GRUPO_SMA = "Simple Moving Average (SMA)"
len = input.int(150, minval=1, title="Length", group=GRUPO_SMA)
src = input(close, title="Source", group=GRUPO_SMA)
offset = input.int(title="Offset", defval=6, minval=-500, maxval=500, group=GRUPO_SMA)
sma = ta.sma(src, len)


//== Hull Estimate (HEMA) - Source code is subject to the terms of the Mozilla Public License 2.0 at https://mozilla.org/MPL/2.0/ - © alexgrover
GRUPO_HEMA = "Hull Estimate (HEMA)"
length = input.int(title="Length", defval=50, minval=1, group=GRUPO_HEMA)
hema = 3 * ta.wma(close, length / 2) - 2 * ta.ema(close, length / 2)


//== HALFTREND - Copyright (c) 2021-present, Alex Orekhov (everget)
GRUPO_HT = "Halftrend"
amplitude = input(title='Amplitude', defval=1, group=GRUPO_HT)
channelDeviation = input(title='Channel Deviation', defval=2, group=GRUPO_HT)
showArrows = input(title='Show Arrows', defval=true, group=GRUPO_HT)
showChannels = input(title='Show Channels', defval=false, group=GRUPO_HT)

var int trend = 0
var int nextTrend = 0
var float maxLowPrice = nz(low[1], low)
var float minHighPrice = nz(high[1], high)

var float up = 0.0
var float down = 0.0
float atrHigh = 0.0
float atrLow = 0.0
float arrowUp = na
float arrowDown = na

atr2 = ta.atr(100) / 2
dev = channelDeviation * atr2

highPrice = high[math.abs(ta.highestbars(amplitude))]
lowPrice = low[math.abs(ta.lowestbars(amplitude))]
highma = ta.sma(high, amplitude)
lowma = ta.sma(low, amplitude)

if nextTrend == 1
    maxLowPrice := math.max(lowPrice, maxLowPrice)

    if highma < maxLowPrice and close < nz(low[1], low)
        trend := 1
        nextTrend := 0
        minHighPrice := highPrice
        minHighPrice
else
    minHighPrice := math.min(highPrice, minHighPrice)

    if lowma > minHighPrice and close > nz(high[1], high)
        trend := 0
        nextTrend := 1
        maxLowPrice := lowPrice
        maxLowPrice

if trend == 0
    if not na(trend[1]) and trend[1] != 0
        up := na(down[1]) ? down : down[1]
        arrowUp := up - atr2
        arrowUp
    else
        up := na(up[1]) ? maxLowPrice : math.max(maxLowPrice, up[1])
        up
    atrHigh := up + dev
    atrLow := up - dev
    atrLow
else
    if not na(trend[1]) and trend[1] != 1
        down := na(up[1]) ? up : up[1]
        arrowDown := down + atr2
        arrowDown
    else
        down := na(down[1]) ? minHighPrice : math.min(minHighPrice, down[1])
        down
    atrHigh := down + dev
    atrLow := down - dev
    atrLow

ht = trend == 0 ? up : down

var color buyColor = color.aqua
var color sellColor = color.orange

htColor = trend == 0 ? buyColor : sellColor

buySignal = not na(arrowUp) and trend == 0 and trend[1] == 1
sellSignal = not na(arrowDown) and trend == 1 and trend[1] == 0


//== Plots
// SMA
sma_color = ohlc4 > sma ? c_verde_radiactivo : c_rojo_radiactivo
plot(sma, title="SMA", color=sma_color, linewidth=4, offset=offset)

// HEMA
hema_color = hema > sma ? color.aqua : color.orange
plot(hema, title="HEMA", color=hema_color, linewidth=2)

// HALFTREND
htPlot = plot(ht, title='HalfTrend', linewidth=2, color=htColor, display=display.none)
atrHighPlot = plot(showChannels ? atrHigh : na, title='ATR High', style=plot.style_circles, color=color.new(sellColor, 0))
atrLowPlot = plot(showChannels ? atrLow : na, title='ATR Low', style=plot.style_circles, color=color.new(buyColor, 0))
fill(htPlot, atrHighPlot, title='ATR High Ribbon', color=color.new(sellColor, 90))
fill(htPlot, atrLowPlot, title='ATR Low Ribbon', color=color.new(buyColor, 90))
plotshape(showArrows and buySignal ? atrLow : na, title='Arrow Up', style=shape.triangleup, location=location.absolute, size=size.tiny, color=color.new(buyColor, 0))
plotshape(showArrows and sellSignal ? atrHigh : na, title='Arrow Down', style=shape.triangledown, location=location.absolute, size=size.tiny, color=color.new(sellColor, 0))

//== Señales estrategia
min = ESTRATEGIA_vela_completa_fuera_hema ? low : math.min(open, close)
max = ESTRATEGIA_vela_completa_fuera_hema ? high : math.max(open, close)
long_sma_y_hema  = hema > sma
short_sma_y_hema = hema < sma
long_halftrend   = buySignal
short_halftrend  = sellSignal
long_vela        = min > hema and max > hema
short_vela       = min < hema and max < hema
long = long_sma_y_hema and long_halftrend and long_vela
short = short_sma_y_hema and short_halftrend and short_vela
color_fondo = long ? color.new(color.lime, 85) : short ? color.new(color.red, 80) : noneColor
bgcolor(color_fondo)


//== Alertas
alertcondition(long, title="▶ LONG", message="[{{exchange}}:{{ticker}}] LONG ENTRY")
alertcondition(short, title="▶ SHORT", message="[{{exchange}}:{{ticker}}] SHORT ENTRY")


if long
    strategy.entry("Enter Long", strategy.long)
else if short
    strategy.entry("Enter Short", strategy.short)
- RedK Dual VADER dengan Bar Tenaga
- Strategi Dagangan Kuantitatif Berdasarkan Purata Bergerak dan Bollinger Bands
- Amaran rentas rata-rata bergerak, pelbagai jangka masa (MTF)
- Rasio Tenaga Arah RedK Volume-Pengcepat
- Oscillator Pelangi
- Bar Momentum RedK
- ESSMA
- Super Scalper
- SuperJump Turn Back Bollinger Band
- MACD yang lebih bijak
- KLineChart Demo
- Villa Dinamic Pivot Supertrend Strategi
- Supertrend Crodl
- RSI oleh zdmre
- FTL - Penapis Julat X2 + EMA + UO
- BRAHMASTRA
- Band Mobo
- SAR + 3SMMA dengan SL & TP
- SSS
- Templat Isyarat Pelancaran Bulan [Indikator]
- RSI Perbezaan dengan Pivot, BB, SMA, EMA, SMMA, WMA, VWMA
- RSI dan BBand oversold pada masa yang sama
- Menggulung Heikin Ashi lilin
- Kombo 2/20 EMA & Penapis Bandpass
- ESSMA
- 3EMA
- Blok Perintah Pivot
- NMVOB-S
- EMA/SMA berwarna purata bergerak
- Band MAHL